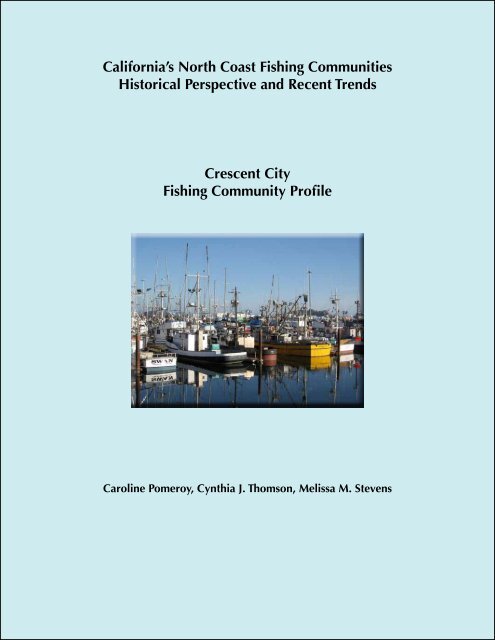
Crescent City Profile - California Sea Grant
Crescent City Profile - California Sea Grant
Crescent City Profile - California Sea Grant
- No tags were found...

You also want an ePaper? Increase the reach of your titles
YUMPU automatically turns print PDFs into web optimized ePapers that Google loves.
<strong>California</strong>’s North Coast Fishing CommunitiesHistorical Perspective and Recent Trends<strong>Crescent</strong> <strong>City</strong>Fishing Community <strong>Profile</strong>Final Reportto the<strong>California</strong> State Coastal ConservancyAward 06–128Online November 2011Original Report August 2010Caroline Pomeroy 1 , Cynthia J. Thomson 2 , Melissa M. Stevens 1,21<strong>California</strong> <strong>Sea</strong> <strong>Grant</strong>, University of <strong>California</strong>, Santa Cruz, Center for Ocean Health, 100 Shaffer Road,Santa Cruz, CA 950602NOAA, National Marine Fisheries Service, Southwest Fisheries Science Center, Fisheries Ecology Division,110 Shaffer Road, Santa Cruz, CA 95060
ContentsExecutive Summary ........................................................................................................................ iAcknowledgments ......................................................................................................................... viIntroduction......................................................................................................................................1History of the Port and the Surrounding Area .............................................................................2The Expansion of Commercial and Recreational Fisheries ...................................................4The Expansion of Fishery Management .................................................................................6The <strong>Crescent</strong> <strong>City</strong> Fishing Community Today ..............................................................................10Commercial Fisheries................................................................................................................10<strong>Crescent</strong> <strong>City</strong> Harbor <strong>Sea</strong>food Receiving, Processing and Marketing .....................................12Ocean Recreational Fishing ......................................................................................................13Harbor Infrastructure and Fishery-Support Businesses ............................................................14Fishing Organizations and Events .............................................................................................16Commercial Fishery Activity at <strong>Crescent</strong> <strong>City</strong> Harbor ..................................................................17Activity Within Commercial Fisheries......................................................................................21The Dungeness Crab Pot Fishery .........................................................................................21The Groundfish Trawl Fishery ............................................................................................23The Salmon Troll Fishery .....................................................................................................25The Ocean (Pink) Shrimp Trawl Fishery .............................................................................27The Rockfish and Lingcod Hook-and-Line Fishery .............................................................29The Coonstripe Shrimp Trap Fishery ...................................................................................31The Albacore Troll Fishery ..................................................................................................32The Pacific Whiting (Hake) Trawl Fishery ..........................................................................34Commercial Fishery Combinations...........................................................................................34Revenue Per Boat ......................................................................................................................37Recreational Fishery Activity at <strong>Crescent</strong> <strong>City</strong> Harbor ................................................................39Recreational Fishing Effort ......................................................................................................39Key Factors Affecting <strong>Crescent</strong> <strong>City</strong> Fisheries ..............................................................................41A Watershed Event, Expansion and Contraction ......................................................................41Changing Fisheries, Changing Community .........................................................................43Economic Factors and Impacts .................................................................................................44Commercial Fisheries ...........................................................................................................44Recreational Fisheries ..........................................................................................................47The Harbor District .............................................................................................................48Current Situation and Outlook .......................................................................................................50References......................................................................................................................................51Endnotes.........................................................................................................................................55<strong>Crescent</strong> <strong>City</strong> Fishing Community <strong>Profile</strong>
along much of the North Coast, resulting insubstantial reductions in both commercial andrecreational fishing activity, and contributing tosocial and economic impacts in the area.The <strong>Crescent</strong> <strong>City</strong> Fishing Community Today<strong>Crescent</strong> <strong>City</strong>’s primary commercial fisheriesinclude the Dungeness crab pot, groundfishand shrimp trawl, groundfish hook-andlineand coonstripe shrimp trap fisheries.The brief whiting trawl season involves asmall number of nonresident vessels. Someresident fishermen travel north into Oregon orsouth (as far as San Francisco) to participatein troll fisheries for Chinook salmon and/or albacore tuna. Of the approximately 100vessels homeported at <strong>Crescent</strong> <strong>City</strong>, 85–90 aredescribed by locals as crabber/trollers, 12 arenearshore fishermen, and five are groundfish/shrimp trawlers. Most fishermen participatein more than one fishery, and more than 75%have participated in the crab fishery.Local fish receiving and processing capacityconsists of six buyers with receiving stations atthe harbor and one onsite receiver/processor,Alber <strong>Sea</strong>foods, Inc. Alber processes somecrab and groundfish onsite; however, mostof the catch is shipped out of the area forprocessing as well as distribution. Somebuyers and fishermen (through off-the-boat andother direct sales) sell small amounts of crab,groundfish and albacore seasonally. All of thecoonstripe shrimp catch is sold through the livemarket in the San Francisco Bay area.Following the reduction in recreationalsalmon fishing opportunities beginning in theearly 1990s and the more recent influenceof economic factors, participation in oceanrecreational fishing at <strong>Crescent</strong> <strong>City</strong> hasdeclined. Today, the most avid <strong>Crescent</strong> <strong>City</strong>anglers still pursue an annual round of fisheriesthat includes salmon (when the season isopen), albacore in late summer (when it is<strong>Crescent</strong> <strong>City</strong> Fishing Community <strong>Profile</strong>within range), crab in winter, and rockfishyear-round (subject to closure when quotashave been reached). Private boat fishingcontinues to be the primary recreational fishingmode, although up to two six-passengercharters also operate at the port.The harbor district and approximately 20businesses at or near the harbor (and morein the larger region) provide considerableinfrastructure, goods and services to supportthese activities. Harbor infrastructure includes15 acres of dock, pier and boat slip facilities,two commercial fish processing facilities (onecurrently in operation), several small receivingstations, an ice plant, a fuel dock, a wastewatertreatment plant, an indoor vessel repair facility,retail spaces, a storage yard, launch ramps, andequipment such as a Travelift and hoists.Commercial Fishing Activity HighlightsRelative to the long term (1981–2007), averageannual total fishing activity has decreased inrecent years (2003–2007) in terms of landings(-44%), ex-vessel value (-4%), boats (-57%),trips (-48%) and buyers (-15%).• The crab fishery, which accounted for anannual average of 43% of landings and45% of ex-vessel value between 1947 and1980, has become the dominant fisheryat <strong>Crescent</strong> <strong>City</strong>, accounting for 64% oflandings and 83% of ex-vessel value inrecent years.• Although the groundfish trawl fishery haslong been integral to the port, averageannual landings and ex-vessel value andnumbers of boats, trips and buyers are all70%–79% lower in recent years relative tothe long term.• Salmon historically played a substantialrole at the port, accounting for an annualaverage of 12% of landings and 31%of ex-vessel value for the period 1947through 1980, and involving up to 84%ii
of boats into the early 1980s. However, inrecent years the number of boats and tripsdeclined by 78% and 92% relative to thelong term, while landings, ex-vessel valueand the number of buyers declined by over40%. This decline was largely underwayin the early 1980s, due to the limited entryprogram and highly restrictive regulationsin the Klamath Management Zone (KMZ).Whereas some salmon fishing occurslocally (as regulations permit), localfishermen who choose to participate in thefishery travel to areas with greater fishingopportunities to fish and deliver their catch.• Landings in the pink shrimp trawl fisherypeaked in 1992 at 17.2 million pounds,with an ex-vessel value of $7.8 million.Landings, value, boats, trips and buyersall declined steadily and substantially (by83%–98%) in recent years relative to thelong term due to market, infrastructure andother factors.• A small hook-and-line fishery for rockfishand lingcod accounted on average for 1%–5% of landings and ex-vessel value duringthe period 1981–2007, with an average of23% of boats participating in that fishery.• The coonstripe shrimp fishery, started bylocal fishermen in the early 1990s, remainsa relatively small fishery in terms oflandings, value and fishing effort. Landingspeaked in 2000 at just over 81,000 poundsworth $396,600.Total ex-vessel value (for all fisheries) peakedat $24.7 million in 1988, while landingspeaked at 39.3 million pounds in 1992. In bothcases, the shrimp trawl fishery accounted fora plurality (38% and 44%, respectively) of theactivity. In 2007, 8.2 million pounds worth$12.2 million was landed at the port, with crabaccounting for 81% of landings and 52% ofvalue.The number of boats peaked in 1981, when1,082 boats made 14,494 deliveries, 53% ofwhich were salmon and 25% of which werecrab. Vessel participation was lowest in 2005,when 137 boats made 3,178 deliveries, 3% ofwhich were salmon and 54% of which werecrab. In 2007, 157 boats made deliveries, 67%of which were crab.Of the 20 buyers that received fish at <strong>Crescent</strong><strong>City</strong> in 2007, three accounted for just over 55%of the landed value of the catch, five accountedfor 75% and seven accounted for 90%. The 20buyers include several fishermen who marketat least some of their catch directly to retailersand/or consumers.Average annual prices were lower in recentyears relative to the long term in the shrimptrawl (-33%), whiting (-13%), albacore (-21%),crab (-11%) and shrimp pot (-7%) fisheries, buthigher in the rockfish hook-and-line (+82%),salmon (+13%), and groundfish trawl (+5%)fisheries.The number of ‘<strong>Crescent</strong> <strong>City</strong> boats’ (i.e.,those with a plurality of their ex-vessel revenueat <strong>Crescent</strong> <strong>City</strong>) declined from an averageof 516 per year from 1981 through 1983 to82 from 2005 through 2007, while averagerevenue per boat increased from $37,799 to$141,067. When boats were assigned to theirprimary fishery (the fishery accounting forthe plurality of each vessel’s landed value),this trend was apparent in most fisheries, mostnotably rockfish, salmon and crab. It is notclear, however, how these increases in revenueper boat compare to costs, which also haveincreased over time.<strong>Crescent</strong> <strong>City</strong> Fishing Community <strong>Profile</strong>iii
Recreational Fishing ActivityRecreational fishery data specific to <strong>Crescent</strong><strong>City</strong> are limited.• According to the <strong>California</strong> Departmentof Fish and Game (CDFG) RecreationalFisheries Survey (CRFS), which providesdata on fishing activity at the ‘district’level, an annual average of 143,000 anglertrips were made in the Redwood District(which comprises Del Norte and Humboldtcounties) between 2005 and 2007. About31% of these trips were from private boats,and 3% from charter boats.• Data from CDFG’s Ocean Salmon Projectfor the <strong>Crescent</strong> <strong>City</strong> area indicate an 86%decline in salmon angler trips (charter andprivate boats) from 1981 to 2007. Privateboat trips accounted for more than 98% ofsalmon effort both over the long term andin recent years.Key Factors Affecting <strong>Crescent</strong> <strong>City</strong> HarborFisheriesHistoric events: The 1964 tsunamifundamentally changed the course of historyfor <strong>Crescent</strong> <strong>City</strong> and its fishing community.The devastation evoked national sympathy andcatalyzed the community, paving the way forit to obtain federal funding to build a state-ofthe-artfishing harbor. In a relatively short time,<strong>Crescent</strong> <strong>City</strong>’s fishery-support infrastructurewas significantly improved and, together withvarious federal programs, provided one ofmany incentives at that time for local fisheryexpansion.Salmon fishery management: Dramaticreductions in (and at times, closures of)commercial seasons by the PFMC as well asthe state’s limited entry program, implementedin the early 1980s, led to a sharp decline in thecommercial salmon fleet. Effort was displacedinto other fisheries such as groundfish and<strong>Crescent</strong> <strong>City</strong> Fishing Community <strong>Profile</strong>crab. Reduced allocations to nontribal fisheriesin the early 1990s led to further reductionsin fishing opportunities, this time for therecreational sector, and sharply curtailed theseasonal influx of summer fishermen and theassociated economic activity on which manylocal businesses such as smokehouses, tackleshops, grocers and RV parks depended.Groundfish fishery management:Increasingly strict federal catch limits sincethe 1990s, together with the 2003 federalgroundfish trawl buyback and the state’simplementation of restricted access in theNearshore Fishery, have limited commercialfishery participation. Of 17 resident groundfishtrawlers, 16 participated in the 2003 groundfishtrawl buyback. Their removal from thelocal fleet led to a marked reduction in localfishery activity, including seafood processingand the use of fuel, ice and other supportservices. Recent time and area closures toprotect yelloweye rockfish, coupled with the2008 salmon closure and the limited (10-day) 2009 salmon season, eliminated manylocal recreational fishing opportunities,further straining local support businesses andnegatively affected the community’s sense ofwell-being.Economics: Commercial fishery participantsand support businesses cited rising operatingcosts, especially those for gear, vesselmaintenance, insurance and fuel, as amongthe biggest challenges they are facing. Atthe same time, many commercial fishermencommented on stagnant or declining pricesin several fisheries. Increasing costs and lessfavorable economic conditions also haveaffected fishery-support businesses, bothdirectly and indirectly. The reduction in fishingopportunities and activity has resulted inreduced demand for goods and services thatthese businesses provide.iv
Harbor Infrastructure: As fishing activityhas declined over the last 30 years, so has theharbor’s revenue base. Insufficient provisionfor basic maintenance and repair of docks andrelated infrastructure has led to their disrepairand vulnerability to events such as the 2006tsunami. These and other costs, particularlyfor dredging and dredge material disposal,and maintaining and operating the wastewatertreatment plant, have become significant.Local processing of seafood is limited, duein part to the high cost of using the harbor’swastewater treatment plant, which is requiredfor fish processing. This factor contributed tothe closure of two local processing facilities,as well as the harbor, in the past decade,and has continued to be an issue for currentand prospective processors. The reductionin landings in key fisheries coupled withincreasing transportation costs have led toregional consolidation of processing facilities.Finally, <strong>Crescent</strong> <strong>City</strong>’s small local population,many of whom fish recreationally for theirown catch, creates limited demand for localprocessing and seafood retail.Current Situation and OutlookThe reduction in fishing opportunities andactivity have reduced shoreside activity,leading businesses to close, reduce servicesand/or inventory, or diversify their operations.With limited alternative sources of revenue,harbor infrastructure has deteriorated. Inaddition, the Marine Life Protection Actprocess begun in late 2009 in the North CoastRegion, and an individual quota programfor the federal groundfish trawl fishery, havethe potential to fundamentally change localfisheries and the community.Yet the <strong>Crescent</strong> <strong>City</strong> community has a wellestablishedhistory of adapting to changethat may enable it to meet these challenges.Community members have a history ofworking together to support the harbor and itsfisheries. Recently, funds have been secured tobegin much-needed dredging of the harbor’smain navigation channel, and additional fundsto support reconstruction of the inner basinand other improvements are pending. Theseefforts together with the port’s location nearrich fishing grounds, its safe and easy access,and the availability of key services createthe potential for <strong>Crescent</strong> <strong>City</strong> to regain itsresilience and vitality as a fishing port.The <strong>Crescent</strong> <strong>City</strong> Harbor fishing communityhas become particularly dependent on thecommercial crab fishery, as activity in severalother key fisheries has been sharply curtailed.Recreational fisheries now engage perhapsa tenth the number of anglers they did in the1980s, focusing on groundfish and crab ratherthan salmon, which is still highly valued butrestricted.<strong>Crescent</strong> <strong>City</strong> Fishing Community <strong>Profile</strong>v
AcknowledgmentsWe gratefully acknowledge the support and input provided by <strong>Crescent</strong> <strong>City</strong> fishing communitymembers, including local fishermen, fish buyers and fishery-support business owners and staff.We thank <strong>Crescent</strong> <strong>City</strong> Harbormaster Richard Young and staff, UCCE Del Norte CountyDirector and <strong>Sea</strong> <strong>Grant</strong> Marine Advisor Emeritus Jim Waldvogel and Assistant Jackie Bennet,Ernestine Buzzini of the Del Norte County Historical Society, and Mary Massel of the CoastGuard Auxiliary, <strong>Crescent</strong> <strong>City</strong> Flotilla. We also thank Rebecca Rizzo and Holly Davis, UCSanta Cruz and National Marine Fisheries Service (NMFS), and Debbie Marshall, <strong>California</strong><strong>Sea</strong> <strong>Grant</strong> Extension Program (SGEP), for assistance with graphics and other elements of thisreport; and Brad Stenberg, Pacific States Marine Fisheries Commission, for access to the PacificFisheries Information Network (PacFIN) data; and community members, <strong>Sea</strong> <strong>Grant</strong> colleaguesand others for their feedback on drafts of this document. The information presented here isbased on work supported by the <strong>California</strong> State Coastal Conservancy, the <strong>California</strong> SGEP, theNMFS Economics and Social Sciences Program in Silver Spring, MD and the NMFS SouthwestFisheries Science Center in Santa Cruz, CA.Cover photo by C. Pomeroy.<strong>Crescent</strong> <strong>City</strong> Fishing Community <strong>Profile</strong>vi
Introduction<strong>Crescent</strong> <strong>City</strong> Harbor, <strong>California</strong>’snorthernmost harbor, historically has been oneof the state’s most active fishing ports. Located350 miles north of San Francisco and 20 milessouth of the Oregon border (Figure 1), it issituated near some of the West Coast’s mostproductive fishing grounds for groundfish,salmon, crab, and shrimp. People living in thisisolated part of the state have long utilizedfishery resources for livelihood, sport andsubsistence. Community initiative led to theconstruction of Citizens Dock in 1950 and,following a destructive tsunami in 1964, thedevelopment of <strong>Crescent</strong> <strong>City</strong> Harbor as astate-of-the-art fishing port by the mid-1970s.<strong>Crescent</strong> <strong>City</strong> fisheries are subject toenvironmental conditions and events thataffect both fishing and fishery-supportactivities. NOAA’s National Weather Servicehas noted that the area from Eureka north,including <strong>Crescent</strong> <strong>City</strong>, is uniquely positionedto experience some of the worst and mostdangerous winter storms and summer fogassociated with coastal upwelling. Theseconditions are often an important limitingfactor for fishing. Nonetheless, many fishermenconsider <strong>Crescent</strong> <strong>City</strong> harbor the safest andmost accessible on the West Coast north ofSan Francisco, both because it lacks a bar atthe harbor entrance (a notable drawback ofHumboldt Bay and Fort Bragg) and affordsprotection from storms.<strong>Crescent</strong> <strong>City</strong> is Del Norte County’s onlyincorporated city and the county seat. About30% of the County’s approximately 26,000residents live within the city. 1 A significantportion of the county’s 1,070 square milesis owned and managed by state and federalgovernment, and include portions of RedwoodNational Park, various state parks and thePelican Bay State Prison, which opened in1989. According to the Bureau of EconomicAnalysis, the government sector accounted for47% of earnings in the county in 2007, threetimes the proportion for the state as a whole.This profile of the <strong>Crescent</strong> <strong>City</strong> Harbor fishingcommunity provides a brief history of theharbor and its fisheries; a detailed descriptionof present-day fishery operations, activitiesand associated infrastructure; and discussessome of the key regulatory, economic andFigure 1. <strong>California</strong> map locating <strong>Crescent</strong> <strong>City</strong> and aerial view of <strong>Crescent</strong> <strong>City</strong> Harbor.<strong>Crescent</strong> <strong>City</strong> Fishing Community <strong>Profile</strong> 1
other factors highlighted by study participantsthat interact with and affect the local fishingcommunity. 2The information presented is based on archivaland field research conducted between July2007 and March 2009. 3 Fieldwork includedobservation, informal and formal interviewsand group meetings. These activities engagedapproximately 50 people, including 20 localcommercial and recreational fishermen, 10fish buyers, owners and/or employees of 10fishery-support businesses, the harbormasterand staff, as well as other community memberswho have experience and knowledge of localfisheries. Field data were analyzed togetherwith commercial fishery landings data 4 , andinformation from other primary and secondarysources to interpret patterns, variability andchange within and across fisheries and thefishing community over time.History of the Port and theSurrounding AreaNamed after its crescent-shaped beach,<strong>Crescent</strong> <strong>City</strong> was settled in the 1850sfollowing the discovery of gold on the TrinityRiver. Mining along with logging, farming andfishing opportunities soon brought thousandsof new settlers to the area, which at that timewas inhabited by the native Tolowa and Yurokpeoples. Conflicts arose as more settlersarrived and acquired land (often by forcefrom the native people), eventually leadingto the Red Cap War in 1856 and the removalof several tribes to the Hoopa Valley IndianReservation (Norman et al. 2007).The town of <strong>Crescent</strong> <strong>City</strong> was incorporatedin 1854, and its natural harbor (the only onebetween Humboldt Bay, <strong>California</strong> and CoosBay, Oregon) became a key port of entry andsupply center for settlers. The <strong>Crescent</strong> <strong>City</strong>Whaling Company was established in 1855(Starks 1923) but was short-lived (Bertão2006). However, offshore whaling operationscontinued at <strong>Crescent</strong> <strong>City</strong> until 1894. Inthe late 1880s, the Battery Point Lighthouse(located on the mainland) and St. George ReefLighthouse (located eight miles offshore) werebuilt to help mariners navigate the treacherouscoastal waters (Scofield 1954). 5Road transportation began with theconstruction of the county’s first plank road in1858; the Redwood Highway between Eurekaand <strong>Crescent</strong> <strong>City</strong> opened in 1923 (Pierce1998). The first local railroad opened in theearly 1900s, primarily to transport lumberfrom nearby Smith River to <strong>Crescent</strong> <strong>City</strong> forshipment to the growing San Francisco Bayarea and beyond (McEvoy 1986).As the gold rush slowed in the late 1800s,residents turned to other natural resourcesin the area, massive redwood forests andabundant fishery resources such as salmon,groundfish and crab. Timber harvestingwas the primary industry for many decades,particularly during the post-World War IIU.S. housing boom. However, by the 1960s,an estimated 90% of the redwoods were gone(Norman et al. 2007). As logging declined,fisheries became an increasingly importantindustry in this sparsely populated coastalcommunity.On March 28, 1964, a 9.2 magnitudeearthquake off Alaska caused a tsunami thatdestroyed much of the town and harbor, badlydamaged Citizens Dock, and resulted in 11deaths. (A 1,000-year storm in December1964 exacerbated the damage.) However, thisdisaster enabled the city and the harbor districtto acquire state and federal emergency reliefand other funds to develop the harbor (RRMDesign Group 2006). The boat basin openedin 1968, and the development of associatedharbor infrastructure including offloadingdocks, fish processing and boat-buildingfacilities continued into the 1970s.<strong>Crescent</strong> <strong>City</strong> Fishing Community <strong>Profile</strong> 2
<strong>Crescent</strong> <strong>City</strong> Harbor Fishing Community Timeline1800s Local tribes’ first contact with European-Americans1850 Gold discovered on Trinity River1854 <strong>Crescent</strong> <strong>City</strong> incorporated1892 Point St. George Lighthouse built1923 Redwood Highway between <strong>Crescent</strong> <strong>City</strong> and Eureka completed1935 <strong>Crescent</strong> <strong>City</strong> Harbor District established1950 Citizen’s Dock built1964 Tsunami devastates harbor and town1970 Two processing plants and Del Norte Ice plants open1973 Inner boat basin completed1974 Boldt decision1976 Magnuson-Stevens Fishery Conservation and Management Act (MSA)1977 Fashion Blacksmith opens at harbor1979 Klamath Management Zone (KMZ) established1980 Englund Marine opens1982 Salmon limited entry1982-83 El Niño1985 KMZ commercial salmon fishery closure1987 Ice plant opens on Citizen’s Dock1991 KMZ recreational salmon fishery closure1992 Wastewater Treatment Plant (WTP) opensKMZ recreational salmon fishery limited to 14 daysDungeness crab fishery moratorium on entry1993 Salmon re-allocation to tribes (50%)Coho retention prohibited in commercial fishery1994 Groundfish limited entrySalmon disasterCoho retention prohibited in KMZ recreational fisheryDel Norte Ice ceases operations1995 Dungeness crab limited entry1996 Sustainable Fisheries Act (MSA re-authorized)1998 Harbor district takes over WTP operations from cityMarine Life and Nearshore Fishery Management Acts1999 Marine Life Protection Act (MLPA)2000 <strong>Sea</strong> Products ceases operationsFederal groundfish disasterAlber <strong>Sea</strong>foods begins receiving and processing2001 Eureka Fisheries ceases operations2002 Nearshore Fisheries Management Plan (FMP) adoptedFirst federal Rockfish Conservation Area (RCA) established2003 Groundfish trawl buybackNearshore fishery restricted access2006 TsunamiKlamath salmon disaster2008 Statewide salmon disaster and fishery closureTrawl Individual Quota program approvedNorthern <strong>California</strong> shrimp trawl grounds closed2009 Statewide salmon disaster and fishery closureNorth Coast MLPA process begins<strong>Crescent</strong> <strong>City</strong> Fishing Community <strong>Profile</strong> 3
The Expansion of Commercial andRecreational FisheriesRiver fisheries for coho (Oncorhynchuskisutch) and Chinook salmon (O.tschawytscha) began in the mid-1800s whilethe ocean salmon fishery, which developedin Monterey Bay in the late 1880s, reachedthe North Coast in the 1920s (Feinberg andMorgan 1980). Information about fisheriesat <strong>Crescent</strong> <strong>City</strong> in the latter 1800s is scant;however, interest in developing the harbor tosupport fishing as well as mining and timberis evident. The first wharf reportedly wasbuilt in 1855 at Whaler’s Island, but was soondestroyed by heavy seas (Scofield 1954).According to Leidersdorf (1975), the U.S.Army Corps of Engineers first consideredimproving the harbor for navigation in 1867,but did not recommend such developmentuntil 1911. Because the harbor was vulnerableto waves and storm surge, the Corps firstbuilt a breakwater, completed in 1930, whichafforded protection from westerly wavesand surge but not from southerly forces. Inaddition, it caused shoaling, which led theharbor district (established in 1935) to initiatemaintenance dredging. Over the next severalyears, additional breakwaters and barriers wereconstructed with varying degrees of success inaddressing this problem.These improvements, along with manytechnological developments following WorldWar II, stimulated the expansion of commercialand recreational fisheries at <strong>Crescent</strong> <strong>City</strong>.Local citizens sought federal assistance forrebuilding the municipal wharf. When none wasforthcoming, they donated materials, moneyand labor to build Citizens Dock, which wascompleted in 1950 (Leidersdorf 1975, Powers2005). Around that time, Scofield (1954) reportedon fishing activity at four piers at <strong>Crescent</strong> <strong>City</strong>,including Citizens Dock:A recently constructed municipal pier(Citizens Dock) is the receiving pointfor about 90% of the fishing boats inthe harbor. The three fish piers areequipped with hoists, scales and truckroads. There is a modern fish canneryand a crab processing plant. Most ofthe boats are salmon trollers and crabboats, but there is some set lining andoccasional deliveries by trawlers.The town is chiefly a salmon and crabport, but other species landed are sole,lingcod, rockfish, albacore tuna, smelt,sablefish, shark and halibut.By the late 1950s, <strong>Crescent</strong> <strong>City</strong> had fourresident commercial fish companies 6 and anumber of fishery-support businesses 7 , andwas the site of substantial recreational andcommercial fishing activity. Fishing vesselswere moored in the lee of Whaler’s Island,and most of the commercial fish offloadingactivities occurred at Citizens Dock. Evidenceof this activity was used to obtain a $250,000loan from the state’s Division of Small CraftHarbors to expand and improve Citizens Dock(Trice 1960). 8<strong>California</strong> Department of Fish and Game(CDFG) Fish Bulletin data provide a measureof this activity beginning in the late 1940s(Figure 2). During the 1950s and 1960s,commercial fishermen in the area landedprimarily crab and salmon The groundfish andshrimp trawl fleets became increasingly active<strong>Crescent</strong> <strong>City</strong> Fishing Community <strong>Profile</strong> 4
45Pounds and ex-vessel value (millions, 2007$)403530252015105019471950All ElseShrimpCrabAlbacoreSalmonGroundfishEx-vessel valuein the late 1960s and early 1970s (due largelyto the use of double-rig trawl nets for shrimp),bringing the total landings at <strong>Crescent</strong> <strong>City</strong>to more than 10 million pounds worth $12.6million (2007$) by 1968.Receiving and processing capacity expanded in theaftermath of the 1964 tsunami with the constructionof two large seafood processing plants. Whengovernment funds for the project came up $40,000short, more than 130 individuals and businessesdonated money to ensure the project’s success(Anon. 1976). In 1970 the Harbor District leasedthe buildings to <strong>Crescent</strong> Fisheries and EurekaFisheries, the latter one of the largest seafoodprocessing companies along the West Coast at thetime. Eureka Fisheries’ new 16,000 ft 2 processingfacility was capable of handling some six millionpounds of shrimp, crab, salmon and groundfishannually (Eureka Fisheries 1992). The considerableincrease in processing capacity (as well as jobs andincome for residents) likely encouraged an increasein the amount of fish landed at the port.1953195619591962196519681971197419771980198319861989199219951998200120042007Figure 2. Pounds and ex-vessel value (2007$) of commercial fishery landings at <strong>Crescent</strong> <strong>City</strong>, 1947–2007(CDFG Fish Bulletin Series). Note: Ex-vessel value data for 1977–1980 are not available.The completion of the inner boat basin providedthe first secure berthing space for recreational andcommercial fishing vessels, and led to a substantialinflux of fishermen into the area, which at thattime was economically depressed following thesharp decline in the local timber industry. As ofMay 1975, the inner harbor’s 300 berths were fullyoccupied by permanent tenants, and there was asubstantial slip waiting list (Leidersdorf 1975).The resident commercial fishing fleet consistedof 100 to 120 boats, many of which were new orupdated vessels compared to those of the previousdecade. In addition to the resident fleet, a growingnumber of transient vessels used the port. In 1981,there were over 1,000 boats making landings atthe port, about ten times the number of residentboats. These boats, many from Eureka and pointssouth or from Oregon, came to access the richlocal fishing grounds and to take advantage of theharbor’s infrastructure, including fish receiving andprocessing capacity.<strong>Crescent</strong> <strong>City</strong> Fishing Community <strong>Profile</strong> 5
As of the late 1970s, recreational fishing in<strong>Crescent</strong> <strong>City</strong> involved some 500 boats inseasonal slips and as many as 100 more onmoorings in the harbor’s outer basin. At thattime the recreational fisheries for groundfishand both coho and Chinook salmon wereopen most of the year, although most fishingoccurred during the summer season (Maythrough August). The recreational fleetincluded out-of-towners as well as locals.Retirees, school teachers and others wouldtrailer their salmon boats to the harbor and stayfor weeks or the entire summer to fish. 9 Manystayed in local RV parks at the harbor andelsewhere in town.During the 1980s, three receiver/processors(often referred to as ‘fish houses’) and atleast another four buyers were resident at theport. In addition to <strong>Crescent</strong> Fisheries andEureka Fisheries, Consolidated Factors/<strong>Sea</strong>Products received and packed frozen seafoodproducts. Pacific Choice <strong>Sea</strong>food received andtransported seafood to its processing facilitiesin Eureka. By the end of the decade, therewere as many as eight receivers (includingprocessors) operating out of <strong>Crescent</strong> <strong>City</strong>, andmany more small-scale buyers.In addition to harbor development, <strong>Crescent</strong><strong>City</strong>’s fishing community benefited fromvarious federal programs aimed at encouragingthe development of the nation’s fisheries.The 1971 reauthorization of the Farm CreditAct enabled commercial fishermen to obtainloans through local Production CreditAssociations, which had been making suchloans to farmers and ranchers since 1933(Dewees 1976, NOAA 1999). Additionally,the Capital Construction Fund and FishingVessel Obligation Guarantee program(authorized by the Federal Ship Financing Actof 1972) offered low interest or governmentbackedloans, tax-deferred vessel repair andconstruction programs, fuel tax relief, gearreplacement funds, market expansion programsand technical assistance (NOAA 1999). Theseopportunities, collectively referred to by onestudy participant as a “fleet promotion act,”helped to substantially increase fleet size andcapacity. For <strong>Crescent</strong> <strong>City</strong>, as for many otherU.S. fishing communities, the 1970s and 1980swere the boom years, as fisheries expandedthrough industry, technology, and internationaltrade.The Expansion of Fishery ManagementCommercial Fishery ManagementThrough the late 1970s, <strong>Crescent</strong> <strong>City</strong> fisherieswere subject to modest management, andlandings were driven largely by resourceavailability and market demand. With thepassage of the federal Fishery Conservationand Management Act (later the MSA) in1976 and the creation of the Pacific FisheryManagement Council (PFMC), as well asincreased state fishery management, thingsbegan to change. By the early 1980s, thefishing community experienced increasingrestrictions in the salmon troll and groundfishtrawl fisheries.In the late 1970s, concern for Klamath Riverfall run Chinook led the newly formed PFMCto begin restricting seasons and areas of catchthrough the implementation of a SalmonFishery Management Plan (FMP). In 1979,to better address concerns regarding fisheryimpacts on Klamath River fall Chinook, thePFMC established the Klamath ManagementZone (KMZ; (Pierce 1998). The area extendedfrom Humbug Mountain near Port Orford,Oregon to Horse Mountain, <strong>California</strong>,encompassing <strong>Crescent</strong> <strong>City</strong> fishermen’sprimary fishing grounds. In 1982, <strong>California</strong>adopted a statewide limited entry program forcommercial trollers. By 1984, the PFMC hadshortened the commercial salmon season inthe KMZ to approximately two months, muchshorter than the five- to six-month seasonsin other areas along the coast. In 1985, thecommercial season in the KMZ was closed<strong>Crescent</strong> <strong>City</strong> Fishing Community <strong>Profile</strong> 6
completely. These actions reflected the PFMCpolicy of imposing greater restrictions in areaswith greater impacts on Klamath fall Chinook(the KMZ) in lieu of lesser restrictions over alarger geographic area.Beginning in 1992, the PFMC prohibitedretention of coho in the commercial salmonfishery south of Cape Falcon, Oregon dueto conservation concerns regarding OregonCoastal Natural coho (PFMC 1992). This ledto fishery disaster declarations for <strong>California</strong>and Oregon fishing communities in 1994and 1995. Although the KMZ commercialfishery was not nearly as dependent on cohoas fisheries further north, the <strong>California</strong> KMZwas completely closed from 1992 through1995, largely due to more localized factorsthat compounded the effects of the cohononretention policy. In 1993, Klamath fallChinook was declared overfished (PFMC1994), and the Department of Interior Solicitorissued an opinion allocating 50% of Klamath-Trinity River salmon to the Yurok and Hoopatribes. This was significantly higher than the30% tribal allocation brokered by the KlamathFishery Management Council in a previous1987–1991 agreement, and required reducedallocations to nontribal fisheries, includingthe KMZ commercial fishery (Pierce 1998). 10As a result, commercial salmon seasons inthe <strong>California</strong> KMZ have at times been onlydays or weeks in duration, and in some yearscompletely closed (as occurred in 1985). Thecumulative effect of these management actionswas to discourage (nontribal) salmon fishingalong much of the North Coast, resulting insubstantial reductions in both commercial andrecreational fishing activity at <strong>Crescent</strong> <strong>City</strong>, aselsewhere.In 2006, failure of Klamath fall Chinook toachieve its escapement floor 11 for the thirdconsecutive year triggered a conservationalert and prompted the PFMC to close thecommercial fishery in the <strong>California</strong> KMZ andcurtail the season in other areas. Unusually lowescapement of Sacramento River fall Chinookin 2008 and 2009 lead to unprecedentedclosures of <strong>California</strong>’s commercial fishery anddramatically curtailed seasons in Oregon. The2008–2009 closures have been unprecedentedfor many salmon-dependent communities,though less so for <strong>Crescent</strong> <strong>City</strong>, which hasbeen subject to stringent KMZ regulations formore than two decades.Fishing opportunities also have been curtailedby state and federal management in theWest Coast groundfish fishery. In 1982, thePFMC implemented the federal West CoastGroundfish FMP, and began to manage thecommercial fishery with measures suchas harvest guidelines, trip landing and tripfrequency limits, and gear restrictions.However, it wasn’t until 1994 that PFMCimplemented a coastwide limited entryprogram for the trawl and fixed gear (hookand-lineand pot) fisheries, and a small openaccess fishery for nontrawl fishermen.In 1992, the PFMC adopted a harvest ratepolicy for groundfish based on the assumptionthat West Coast groundfish were similar inproductivity to other well-studied groundfishstocks. Over the next eight years, as growingscientific evidence indicated that rockfish(Sebastes spp.) had productivity rates muchlower than other groundfish species, the PFMCadopted increasingly restrictive managementmeasures for rockfish. 12 However, thesemeasures came too late to reverse the effectsof longstanding harvest policies based oninaccurate assumptions, and between 1999 and2002, eight groundfish stocks were declaredoverfished. 13 In 2000, a federal disaster wasdeclared in the West Coast groundfish fishery.To rebuild overfished stocks, optimum yields(OYs) and trip landing limits for healthy stockstypically taken with the species of concern,as well as those overfished species, were<strong>Crescent</strong> <strong>City</strong> Fishing Community <strong>Profile</strong> 7
cut further for both limited entry and openaccess vessels. To afford fishery participantsmore flexibility and enable them to reducediscards, trip limits were subsequentlyreplaced with cumulative landing limits thatgradually expanded in duration (weekly,biweekly, monthly, bimonthly). The PFMCalso implemented rockfish conservation areas(RCAs) to reduce the catch of overfishedspecies (PFMC 2008). Implemented inSeptember 2002, the first federal RCAclosed continental shelf and slope waters tocommercial groundfish fishing from nearCape Mendocino (north of Fort Bragg) northto the Canadian border. The severe decline inharvest opportunities exacerbated the problemof excess harvest capacity, and led to measuressuch as the industry-funded federal WestCoast groundfish trawl buyback program in2003. Sixteen of <strong>Crescent</strong> <strong>City</strong>’s 17 residentgroundfish trawl vessels participated in thebuyback and were removed from the localfleet, leading to further reductions in localfishery activity. In subsequent years, limitedentry and open access vessels have beensubject to area closures to protect groundfishEssential Fish Habitat (EFH) and required tocarry vessel monitoring systems (VMS). 14The ocean shrimp fishery has been active at<strong>Crescent</strong> <strong>City</strong> since the early 1970s. Overthe years, this fishery has been subject torestrictions including finfish excluder devicesto minimize groundfish bycatch (2002), areaclosures to protect groundfish EFH (2006), andVMS (2007). In addition, these vessels are alsosubject to state regulations including limitedentry (for vessels north of Point Conception),a November through March closure (to protectegg-bearing females), and maximum countper-poundand minimum mesh size (to protectjuvenile shrimp; (CDFG 2007). Prior to 2008,shrimp trawling was allowed in state waters2–3 miles from shore between Point Reyesand False Cape; since then, ocean shrimp trawlgrounds in state waters have been closed. Ofthe 85 pink shrimp permits retired by the 2003groundfish trawl buyback (which requiredvessels bought out of the groundfish fisheryto retire all of their permits for West Coastfisheries), 31 were held by <strong>California</strong> vessels,and 12 of these were held by <strong>Crescent</strong> <strong>City</strong>basedboats (Federal Register 2003).Management of the groundfish fishery instate waters (0–3 miles) also has becomesubstantially more restrictive. Motivatedby the rapid growth of the live fish fishery(McKee-Lewis 1996), the passage of theNearshore Fishery Management Act (withinthe state’s Marine Life Management Act,MLMA) in 1998 established a permit programand minimum sizes for 10 commonly caughtnearshore species (effective in 1999), andmandated the development of a NearshoreFMP. In 2001, the nearshore rockfish fisherywas closed outside 20 fathoms from Marchthrough June. Two years later, the stateimplemented the Nearshore FMP whichspecified management measures for 19nearshore species including gear and seasonalrestrictions, as well as a restricted accessprogram as a means to achieve the statewidecapacity goal of 61 participants (down from1,128 in 1999). Statewide, the number ofpermits issued in 2009 (179) was still wellabove the capacity goal. In the North CoastRegion, however, the 22 permits were issued in2009, and as of mid-2010, 15 permits had beenissued – one greater than the capacity goal of14 for the region. 15The Dungeness crab fishery at <strong>Crescent</strong> <strong>City</strong>has not experienced the types of dramaticmanagement changes as have occurred in thesalmon and groundfish fisheries. In managingthe fishery, the state has used a “three S” (sex,size, season) strategy that includes male-onlyharvest (since 1897), a minimum size limit(since 1911) and a limited season (since 1957).In 1992, the state placed a moratorium onentry; in 1995, a restricted access program<strong>Crescent</strong> <strong>City</strong> Fishing Community <strong>Profile</strong> 8
was implemented. The northern crab seasonusually runs from December 1 through July15 (with an early season opener off SanFrancisco starting November 15), but its starthas been delayed in some years because ofprice disputes. In addition, the opening of theseason may be delayed to insure that the crabshave completed molting, as occurred in 2005.In 2009, pursuant to SB 1690 (2008), the stateconvened a Dungeness Crab Task Force inresponse to concerns about recent increasesin participation and gear use. Following therecommendation of the Task Force (<strong>California</strong>Dungeness Crab Task Force 2010), a bill thatwould establish a pilot crab pot allocationprogram to address those concerns (SB 1039,Wiggins) is pending in the State Legislature.Recreational Fishery ManagementConcerns regarding Klamath fall Chinookand coho have influenced management of therecreational salmon fisheries in the <strong>Crescent</strong><strong>City</strong> area. Many of the factors that haveconstrained the KMZ commercial fishery alsohave affected the recreational ocean salmonfishery. However, due to its lesser impact onKlamath fall Chinook, the KMZ recreationalfishery has generally been less constrained thanthe KMZ commercial fishery, although more sothan the recreational salmon fishery elsewherein the state.In 1979, the KMZ recreational season and bag limitwere reduced for the first time (PFMC 2005). In1986, the season was reduced from about nine tofive months. Since then, seasons in the <strong>California</strong>KMZ have generally ranged from one to sixmonths, with several notable exceptions (i.e., the14-, 0-, and 10-day openings in 1992, 2008, and2009, respectively), in contrast to other parts ofthe state, where the recreational season generallyextends for six to nine months (PFMC 2009). Whilethe KMZ recreational fishery is much reduced fromthe peak 1970s and 1980s, it remains an activefishery that attracts both resident and nonresidentanglers – at least in those years when recreationalopportunity is available.The recreational rockfish fishery has beenincreasingly constrained since the late 1990sto address concerns regarding overfishedgroundfish stocks. Beginning in 1998, sublimitswere added to the overall groundfishbag limit to protect species of concern. For themanagement area north of Cape Mendocino(including <strong>Crescent</strong> <strong>City</strong>), the species ofconcern were lingcod, canary and (by theearly 2000s) yelloweye rockfish. <strong>California</strong>’slongstanding groundfish bag limit of 15 fishwas reduced to 10 fish in 2000. By 2009,regulations included a 2-fish sub-limit eachfor greenling, bocaccio, and cabezon, andprohibited retention of cowcod, canary,yelloweye and bronze-spotted rockfishes. TheState began implementing inseason closuresin this area in 2000, and added depth-basedrestrictions as inseason measures in 2004.By 2005, preseason specifications includedclosures or depth-based restrictions for everymonth of the year. In 2008, the once yearroundseason was compressed to four months.In 2008, CDFG considered Yelloweye RCAs inaddition to existing depth-based closures, butultimately did not implement them. Instead, thenearshore recreational groundfish fishery wasclosed four months early.<strong>Crescent</strong> <strong>City</strong> Fishing Community <strong>Profile</strong> 9
The <strong>Crescent</strong> <strong>City</strong> Fishing Community TodayThe <strong>Crescent</strong> <strong>City</strong> Harbor fishing communityis comprised of commercial and recreationalfishery participants and their families, as wellas fishery-support businesses (including theharbor district) that provide goods and servicesthat fishery participants need to operate safelyand effectively (Table 1 and Table 2). Localcommercial fisheries include a diversity ofparticipants engaged in a range of fisheriesand fishery-related activities. Recreationalfisheries include private boat operations and acommercial passenger fishing vessel (CPFV,or charter) operation that involve locals andnonlocals alike.Commercial FisheriesThe primary commercial fisheries at <strong>Crescent</strong><strong>City</strong> include the pot fishery for DungenessTable 1. Local support businesses used by <strong>Crescent</strong> <strong>City</strong> fishery participants (as of March 2009).Business Type Business Name Estimated EmploymentReceivers Alber <strong>Sea</strong>food 4–18 FT, 100–120 seasonalCaito Fisheries1 FT, some seasonalCarvalho Fisheries4 FTLCZ Unloaders16–20 FT/PTNext <strong>Sea</strong>food1 FT, 10–25 seasonalNor-Cal <strong>Sea</strong>foodPacific Choice <strong>Sea</strong>food1FT, 2–4 PTProcessors Alber <strong>Sea</strong>food (see above)Marine Supply Englund Marine 4 FTMarine Repair(mechanical, electrical,or hydraulic)<strong>Crescent</strong> <strong>City</strong> ElectricGeorge’s Auto Diesel ElectricLarry’s Equipment & Marine Repair 1 FTMor-Jon, Inc.10–11 FT, 1 PTNorthcoast Marine Electronics1 FTPete’s Auto & Marine Repair2 FTMarine Refrigeration Frank’s RefrigerationCold Storage none -Ice Facility Del Norte Ice (Pacific Choice <strong>Sea</strong>food) 1 FT, 1 PT*Fuel Dock C Renner Petroleum 1 PT (dock service)Bait Englund Marine (same as above)Vessel Repair/MaintenanceFashion Blacksmith10 FTCommercial Diver UnknownRetail Fish Market Lucy’s <strong>Sea</strong>food (seasonal)Charter Operation Golden Bear Fishing ChartersTally Ho II1 FTPort Management <strong>Crescent</strong> <strong>City</strong> Harbor District 4 FT, 3 PT, 2 seasonalRV ParksHarbor RV ParkBayside RV Park3 PT* Overlaps with Pacific Choice <strong>Sea</strong>food<strong>Crescent</strong> <strong>City</strong> Fishing Community <strong>Profile</strong> 10
Table 2. Out-of-area businesses used by <strong>Crescent</strong> <strong>City</strong> fishery participants.Business Name Business Type LocationMonterey Fish Co. Bait Watsonville, SalinasVariousBaitDavid Peterson Boatwright EurekaHarbor Logging Cable Brookings, ORTrilogy Crab pot materials Bellingham, WACustom Crab Pots Crab pot materials EurekaFred’s Marine Electronics EurekaChetco Marine Marine supplies Chetco, ORCostco Miscellaneous supplies EurekaOutboard mechanicLos Angeles, Eureka; Reedsport, ORIlwaco, Westport, WAEureka; Medford and <strong>Grant</strong>s Pass,ORCabella’s Sport fishing clothing, gear OnlineFoul Weather Trawl Trawl nets/gear Newport, ORVarious suppliesRedding; Medford, ORNOAA Weather Service Weather information Eureka (online)crab, and the trawl 16 , hook-and-line and trapfisheries for various groundfish species. 17Other current include the trawl fisheries forpink shrimp (Pandalus jordani) and Pacificwhiting (Merluccius productus), the pot fisheryfor coonstripe shrimp (Pandalus danae), andtroll fisheries for Chinook or king salmon andalbacore tuna (Thunnus alalunga).Most of these fisheries are seasonal as afunction of resource availability, regulationsthat define when, where and how eachfishery is allowed to operate, the availabilityof buyers, and market demand (Table 3).However, it should be noted that the actualtemporal distribution of activity is oftenmore compressed, variable and complexthan suggested by the table. For instance, theavailability of albacore varies widely fromone year to the next. The salmon fishery in<strong>California</strong>’s KMZ was completely closed in2006, 2008 and 2009, and open only brieflyin 2007. The Dungeness crab fishery isconcentrated in the winter months due to peakholiday demand. Groundfish seasons tend tobe defined in two-month increments (reflectingthe use of bimonthly vessel cumulative landinglimits), vary by species and fishery sector, andare sometimes subject to inseason closure toprevent OYs of selected species from beingexceeded.About 100 commercial fishing vessels arehomeported at <strong>Crescent</strong> <strong>City</strong>. Commercialfishery participants described the makeup ofthe resident fleet as including five trawlers, 12nearshore fishing operations, and about 85 to90 crabber/trollers. While most local fishermenfocus on a particular fishery, most participatein one or more additional fisheries during theyear. The fleet includes both full-time andpart-time fishermen. Full-time skippers dependon fishing for their livelihood and fish yearround,as resource availability, weather andregulations permit. Part-time skippers fish partof the year, often focusing on a single fishery,and may pursue other activities as part of theirlivelihood.<strong>Crescent</strong> <strong>City</strong> Fishing Community <strong>Profile</strong> 11
Table 3. <strong>Sea</strong>sonality of selected commercial fisheries at <strong>Crescent</strong> <strong>City</strong> Harbor.JANFEBMARAPRMAYJUNEJULYAUGSEPOCTNOVDECAlbacore tunaCoonstripe shrimpDungeness crabGroundfishPacific whitingPink shrimpSalmonVessels are characterized as either ‘big boats’(55 feet long or larger) or ‘small boats’ (lessthan 55 feet). Big boats include trawlers andlarger crabber/trollers. These vessels tendto be ‘trip-boats’, equipped with comfortand safety features that enable them toventure as far south as the San FranciscoBay area (particularly for the mid-NovemberDungeness crab opener), north into Oregonand Washington, and further offshore for afew days to several weeks to follow the fish.Small boats tend to fish for some combinationof crab, groundfish, coonstripe shrimp, andperhaps salmon. These vessels usually work as‘day-boats’, leaving port early in the morningto fish nearby, then returning to <strong>Crescent</strong> <strong>City</strong>the same day to unload their catch. Largerboats may carry two to four crew (includingthe skipper); smaller operations may carry oneto three crew.In addition to resident vessels, many transientvessels also use the harbor. For example, of the157 boats that landed at <strong>Crescent</strong> <strong>City</strong> in 2007,an estimated 37 (about 24%) were nonresidentvessels from Oregon and Washington as wellas other <strong>California</strong> ports. According to studyparticipants and other sources, historically,more than half of the vessels that landedfish commercially at <strong>Crescent</strong> <strong>City</strong> werenonresident. A small number of nonlocalgroundfish trawlers still do deliver their catch,obtain services or reprovision at the port. Allof the vessels that deliver whiting at <strong>Crescent</strong><strong>City</strong> are nonresident.<strong>Crescent</strong> <strong>City</strong> Harbor <strong>Sea</strong>foodReceiving, Processing and MarketingPresently, local fish receiving and processingcapacity consists of six buyers with receivingstations at the harbor and one onsite receiver/processor, Alber <strong>Sea</strong>foods, Inc. Some buyersreceive fish on behalf of other entities basedelsewhere along the West Coast as well as theirown business. The chain of custody generallyfollows from fishing vessel to receiver, withmost of the catch transported out of <strong>Crescent</strong><strong>City</strong> for processing and distribution (Figure3). Some businesses are vertically integratedand function in multiple roles (e.g., receiver,processor, wholesaler).In 2007, about half of the 20 entities that receivedfish at <strong>Crescent</strong> <strong>City</strong> (including fishermenwho sold their own and in some cases others’catch) were based in the area. One of the sevenfish businesses that operate receiving stationson Citizens Dock is locally owned. The otherreceivers, as well as outside buyers for whomthey serve as agents, are based as far north asIlwaco, Washington and as far south as LosAngeles, <strong>California</strong>. There is also a seasonal crabmarket near the boat basin.<strong>Crescent</strong> <strong>City</strong> Fishing Community <strong>Profile</strong> 12
Figure 3. Pathways of seafood landed at <strong>Crescent</strong><strong>City</strong> Harbor. Note: Thicker arrows indicate mostcommon pathways.Product forms vary within and across fisheries(Table 4). Most whiting, groundfish and crabis processed on a relatively large scale locally.Live crab, coonstripe shrimp and rockfishhave become more common over the pastdecade, largely due to growing demand in theSan Francisco Bay area. Small amounts ofgroundfish and crab are processed on a smallscale (e.g., as groundfish fillets) in the <strong>Crescent</strong><strong>City</strong> area for local and regional distribution.One local buyer sells to the public during crabseason (winter), and a handful of albacoretrollers sell directly to consumers (through offthe-boatsales) during the late summer and fall.Ocean Recreational FishingDecades ago, “salmon was king,” and for studyparticipants, it still is. In addition, anglerstarget albacore, groundfish (i.e., rockfish andlingcod, Ophiodon elongates), and Dungenesscrab. Private boat fishing has long been thedominant mode of ocean recreational fishinghere. For a period of 4 to 5 years in the late1990s, <strong>Crescent</strong> <strong>City</strong> had no charter operations.Then in 2000, the Tally Ho II began operations.Although equipped to carry up to 14 fishingpassengers or 20 whale watching passengers,it currently operates primarily as a ‘six-pack’,carrying no more than six fishing passengersreportedly because of the limited availabilityof crew. The operator describes his clienteleas 15% local (within Del Norte County) and85% nonlocal, coming primarily from inlandcommunities throughout <strong>California</strong>, Arizonaand outside the US. 18As with commercial fisheries, the seasonalityof <strong>Crescent</strong> <strong>City</strong>’s recreational fisheries (Table5) is defined by resource availability, weatherand regulations, and is often more compressedand variable than indicated in the table. Forinstance, the availability of albacore varieswidely from year to year. The salmon fisheryin <strong>California</strong>’s KMZ is open only for a subsetof days in some months in order to extend thelength of the season; it was completely closedin 2008 and open for only 10 days in 2009.The groundfish fishery, which was open yearroundthrough the early 2000s, has not openeduntil May in recent years and has also beenTable 4. Product forms, processing location and destination of seafood landed at <strong>Crescent</strong> <strong>City</strong> Harbor.Fishery Product forms Processing location MarketsCoonstripe shrimp Live n/a San Francisco Bay areaDungeness crabCooked whole §ioned, picked and <strong>Crescent</strong> <strong>City</strong>, Eureka, Other West Coast Local to nationwidecanned, liveGroundfish Whole, filet, live<strong>Crescent</strong> <strong>City</strong>, Eureka, Fort Bragg, OtherWest CoastLocal to overseasPink shrimp Picked and canned Eureka State to nationwideSalmon Whole, filet, steak Eureka, Fort Bragg, Other West Coast Local to nationwidePacific whiting Filet, head/gut, surimi <strong>Crescent</strong> <strong>City</strong> (little), Other West Coast Overseas<strong>Crescent</strong> <strong>City</strong> Fishing Community <strong>Profile</strong> 13
Table 5. <strong>Sea</strong>sonality of major recreational fisheries at <strong>Crescent</strong> <strong>City</strong> Harbor.JANFEBMARAPRMAYJUNEJULYAUGSEPOCTNOVDECAlbacoreCrabGroundfishSalmonsubject to late-season closure to prevent OYsof selected species from being exceeded.Harbor Infrastructure and Fishery-Support Businesses<strong>Crescent</strong> <strong>City</strong>’s commercial and recreationalfishery participants depend on infrastructure,including docks, equipment, various facilities,and goods and services provided by theharbor district and other local and regionalfishery-support businesses. Harbor-ownedinfrastructure consists of 15 acres of dock, pierand boat slip facilities, as well as buildings,parking and storage areas, launch ramps (onewith trailer parking), and equipment such asa Travelift and hoists (Table 6). Buildingsinclude two commercial fish processingfacilities (one currently in operation), severalsmall receiving stations, an ice plant, a fueldock, a wastewater treatment plant, an indoorvessel repair facility, retail spaces, a storageyard and the harbor office. Two RV parks(with 129 and 137 spaces, respectively), fivefood service establishments and several otherbusinesses lease space from the harbor. A CoastGuard base for the Cutter Dorado), a Sheriff’sMarine Patrol station, and a former aquaculturefacility also are located on Whalers Island. Inall, approximately 20 businesses at or near theharbor provide goods and services that directlysupport commercial and recreational fishingactivities (see Table 1).commonly used by commercial fishermen atthe harbor include receivers/processors, andmarine repair and supply services, as wellas restaurants and grocery stores located intown. A vessel fabrication and repair facility(Fashion Blacksmith) primarily services outof-towncommercial vessels, but also workson local vessels and fabricates equipment suchas fish and boat hoists. Although recreationalfishermen do not use facilities related tofish receiving and processing or large vesselconstruction and repair, they use the marinesupply store, mechanical and electronicservices, RV parks, and local restaurants andgroceries.When it was built in the early 1970s, the innerboat basin had 308 slips for vessels rangingin length from 30 to 70 feet. By 2006, theAlthough specific needs vary by fisheryand fishing operation, the businesses most<strong>Crescent</strong> <strong>City</strong> Fishing Community <strong>Profile</strong> 14
Table 6. <strong>Crescent</strong> <strong>City</strong> Harbor user groups, infrastructure and services.User groupsHarbor-ownedinfrastructureHarbor servicesResident businesstypesCommercial fishingRecreational fishing(charter, privateboat and shorebased)Resident businesses& organizationsCommunityresidentsTouristsDocks/slipsInner Basin (~230)Outer Basin (variable)Launch ramps (2)ParkingOffloading Infrastructure- Docks (4)- Hoists (6 receiving,- 1 public)- Receiving stations (7)- Receiving/processingbuildings (2)Other Infrastructure- Fish cleaning station- Work dock- Transient dock- Boatyard- Wastewater treatmentplantBilge pump-out stationOil recycling stationBathrooms/showersDredging of harborchannel and berthingVisitor berthingFuel, water, iceDock powerWaste disposal andrecyclingDry storageFish buyers (7)Fish processor (1)Electronics services(2)Marine supplies (1)Bait/tackle shop (1)Fuel dock (1)Ice Plant (1)Commercial divers (4)Boatyard (1)Restaurants (5)RV parks (2)number of slips dropped to 228 because ofdeferred maintenance (RRM Design Group2006), and decreased further following damagefrom the tsunami in November of that year.The outer boat basin contains docks that areinstalled seasonally, and can provide berthingfor up to 500 smaller boats. These slips areused primarily by recreational fishermenduring the summer. Occupancy of bothinner and outer basin berthing has declinedin recent years with the reduction in fishingopportunities. Occupancy of the inner basin’s228 slips averaged 68% between 1999 and2003, down from full occupancy in prior years(RRM Design Group 2006). Outer basin slipoccupancy declined from about 500 in 1980, to250 in 1999, and to about 50 in 2008.Although <strong>Crescent</strong> <strong>City</strong> has considerableinfrastructure and fishery-support businesses,some fishermen obtain goods and servicesat other ports, usually in connection withfishing near those ports. For example,some reported purchasing bait in Eureka orWestport, Washington (see Table 2). Somelarger operations haul out (for maintenance) atports in Oregon and Washington. Fishermenreported traveling to Eureka for supplies,vessel maintenance and repair; some alsoreported obtaining crab and trawl gear inEureka, Newport, Oregon and Bellingham,Washington.Fishing Organizations and EventsTwo commercial fishing associations are activeat <strong>Crescent</strong> <strong>City</strong>. The Fishermen’s MarketingAssociation (FMA), based in McKinleyville,<strong>California</strong>, was established in 1952 by a groupof Eureka-based groundfish trawl fishermen toaddress marketing issues with fish buyers, andin later years, management issues. In the late1980s, the organization expanded to include<strong>Crescent</strong> <strong>City</strong> Fishing Community <strong>Profile</strong> 15
shrimp trawlers and groundfish trawlers fromother areas. With the 2003 groundfish trawlbuyback retiring a large portion of the <strong>Crescent</strong><strong>City</strong> trawl fleet, the FMA has a somewhatdiminished presence locally.The locally-based Del Norte Fishermen’sMarketing Association, established in the early1970s, primarily represents crabber/trollers,and has focused on market orders for salmonand crab and legal issues in the crab fishery.The organization also has sponsored two fishfries a year, through which it raises fundsand educates the public. The association’smembership has ebbed and flowed inconnection with issues and conditions inthe fisheries. As one local fisherman noted,“when salmon was big,” the organization wasvery active, with about 95% of local crabbersand trollers as members. They funded theorganization with self-imposed assessments ontheir catch. Following the establishment of theKMZ and the drop in local salmon fishingactivity, however, the organization becameinactive. More recently, the organization hasbecome active again, supported by annualmembership fees rather than catch-basedassessments to address issues includingmanagement of the crab fishery and the state’sMarine Life Protection Act (MLPA) process,began in the North Coast region in late 2009.At one time, <strong>Crescent</strong> <strong>City</strong> also had aCommercial Fishermen’s Wives Association,which sponsored an annual Labor Day <strong>Sea</strong>foodFestival (1983–1993) with the local <strong>Sea</strong><strong>Grant</strong> Extension Program However, as manywives and partners entered the workforce, theFishermen’s Wives Association has becomeinactive.Although there are a number of recreationalfishing organizations in the state, some ofwhich cover the North Coast, none of these isactive at <strong>Crescent</strong> <strong>City</strong>.<strong>Crescent</strong> <strong>City</strong> Fishing Community <strong>Profile</strong> 16
Commercial Fishery Activity at <strong>Crescent</strong> <strong>City</strong>HarborThe information in this section is based oncustomized summaries of Pacific FisheriesInformation Network (PacFIN) landingsreceipt data, augmented by sources thatprovide earlier and/or longer-term data, as wellas data from fieldwork conducted in 2007 and2008. In the discussion that follows, the ‘longterm’ is the period from 1981 through 2007,whereas ‘recent years’ pertains to the periodfrom 2003 through 2007, unless otherwisenoted. 19 The purpose of focusing on these twotime periods is to demonstrate how recentactivity compares to longer-term historicallevels. While the long-term trends described inthis section begin in 1981, it should be notedthat some local fisheries (e.g., groundfish,salmon, crab) were established well before thatyear (see Figure 2). 20We use five measures of fishing activityderived from the landings receipts data forthe most common local fisheries, define asspecies-gear combinations (e.g., salmontroll, groundfish trawl), and for all fisheriescombined. Landings are reported as ‘roundweight’ (in pounds), which reflects the totalweight of the fish caught. (For species likesalmon, which are gutted at sea, landedweights are converted to round weights toprovide comparability with other species.)Ex-vessel value represents the amount paidto fishermen at the first point of sale (usuallyto a dockside buyer or receiver). Prices arecalculated as the total ex-vessel value dividedby total pounds landed, and therefore representan average, rather than the (potentially wide)range of prices paid over the year. Both exvesselvalue and price (US$) are adjusted forinflation using 2007 values as a base. Boatcounts represent individual (resident andnonresident) fishing operations, though notnecessarily individual fishermen, as somefishermen may own and/or operate multipleboats. Buyer counts are based on the numberof unique buyer IDs in the landings data,and include fishermen who land their owncatch (e.g., for off-the-boat sales, deliveryto restaurants) as well as fishermen and fishbuyers who purchase fish from fishermendelivering their catch at the docks. The numberof trips provides a count of the number ofdeliveries each boat makes at the port. 21Data are reported by calendar year. To insureconfidentiality, data are not reported for somefisheries and/or years if fewer than threevessels and/or buyers participated in that yearor fishery.Fishing activity at <strong>Crescent</strong> <strong>City</strong> Harbor variedconsiderably over the period 1981–2007.Annual landings were 14.6–23.4 millionpounds during the period 1981–1987,increased to 21.1–39.3 million pounds duringthe period 1988–1998, then declined to5.3–17.8 million pounds during the period1999–2007 (Figure 4). Annual ex-vessel valuewas $12.2–$23.1 million between 1981 and1987, $13.6–$24.8 million between 1988 and1998, and $6.4–$23.4 million between 1999and 2007. Whereas the increase in revenuebetween the first two periods was modest, thedecline between the second and third periodswas notable, with record low revenues (lessthan $7.2 million) experienced in three recentyears (2001, 2002, 2005; Figure 5).<strong>Crescent</strong> <strong>City</strong> Fishing Community <strong>Profile</strong> 17
Pounds (millions)Ex-vessel value (2007$, millions)454035302520151050302520151050198119821983198419851986198719881989199019911992199319941995199619971998199920002001Rockfish/lingcod H&LShrimp trawlSalmon trollCrab potGroundfish trawl198119821983198419851986198719881989199019911992199319941995199619971998199920002001200220032004200520062007Figure 5. Ex-vessel value (2007$) of commercial fishery landings at <strong>Crescent</strong> <strong>City</strong> for selected fisheries andoverall, 1981–2007. Note: Activity cannot be reported for years when more than zero and fewer than threeboats or buyers participated in the groundfish trawl (2006–2007), salmon troll (1992, 1995, 1997) and shrimptrawl (2003–2005, 2007) fisheries.<strong>Crescent</strong> <strong>City</strong> Fishing Community <strong>Profile</strong> 18TotalRockfish/lingcod H&LShrimp trawlSalmon trollCrab potGroundfish trawlTotal200220032004200520062007Figure 4. Commercial fishery landings (pounds) at <strong>Crescent</strong> <strong>City</strong> for selected fisheries and overall, 1981–2007.Note: Activity cannot be reported for years when more than zero and fewer than three boats or buyersparticipated in the groundfish trawl (2006–2007), salmon troll (1992, 1995, 1997) and shrimp trawl (2003–2005, 2007) fisheries.
Average annual landings in recent years (12.1million pounds) were 44% lower compared tothe long-term average (21.4 million pounds;Table 7). At the same time, the total ex-vesselvalue of the landings was only 4% lower inrecent years ($16.7 million) than the long-termaverage ($17.3 million). This discrepancy isdue primarily to the growth of the crab fishery(with higher ex-vessel prices compared totrawl-caught groundfish). The emergenceof lower volume, higher price-per-poundlive fish fisheries for rockfish and coonstripeshrimp, and the increase in sablefish activityand prices, together with declines in thehigher-volume, lower-price groundfish andshrimp trawl fisheries have contributed to thisdifferential outcome.The recent average number of vessels (154,resident and nonresident combined) withlandings at <strong>Crescent</strong> <strong>City</strong> is 57% less than thelong-term average of 363 boats (Table 7). Thischange is due largely to the curtailment of thesalmon fishery in the mid-1980s, but also toattrition following implementation of limitedentry programs in several fisheries, and thereduction in local processing capacity in recentyears. The number of boats declined sharplyfrom 1,082 (mostly salmon trollers) in 1981 to320 in 1985, then ranged between 312 and 503through 1994 before declining further to fewerthan 170 since 2001 (Figure 6). Of the 1,082boats that made commercial fishery landingsat <strong>Crescent</strong> <strong>City</strong> in 1981, 911 (84%) landedsalmon and 246 (23%) landed crab. Since1990, however, the proportion landing salmonhas declined to 0%–29%, while the proportionlanding crab has increased to 57%–89%.The number of trips in <strong>Crescent</strong> <strong>City</strong> droppedsharply from a high of nearly 15,000 in 1982 (amajority of which were salmon) to fewer than3,800 since 1998 (Figure 7). Annual effort inrecent years averaged 3,044 trips, 48% lowerthan the long-term annual average of 5,882. Theonly fishery for which effort has been higher inrecent years than the long term is the relativelynew coonstripe shrimp fishery, which has a smallnumber of participants and a limited (five-month)season. In the early 1980s, the salmon fisheryaccounted for 53% of all trips into <strong>Crescent</strong> <strong>City</strong>.As salmon fishing declined, crab trips accountedfor a variable but increasing proportion of trips,peaking at 80% in 2006, and averaging 68% forthe short term. The rockfish and lingcod hook–and-line fishery accounted for 22% of trips overthe long term and 19% over the short term. Allother fisheries accounted for 8% or less of tripsover the long term, and 3% or less in the shortterm.The number of fish buyers at <strong>Crescent</strong> <strong>City</strong>has varied considerably over the last 27 years,both within and among fisheries. Overall,the number of buyers was 34–45 during theperiod 1981–1983, decreased to 19–28 duringTable 7. Long-term and recent annual average, percent difference, and highs and lows in selected measuresfor commercial fisheries at <strong>Crescent</strong> <strong>City</strong>, 1981–2007.Long-termaverage1981–2007Recentaverage2003–2007Percent High year(s) Low year(s)All Fisheriesdifference (amount) (amount)Landings (lbs) 21,411,639 12,087,253 -44 1992 (39,336,658) 2005 (5,260,636)Ex-vessel value ($) 17,255,298 16,651,100 -4 1988 (24,786,105) 2002 (6,358,568)Boats 363 154 -57 1981 (1,082) 2005 (137)Buyers 41 35 -15 1998 (65) 2007 (20)Trips 5,882 3,044 -48 1982 (14,943) 2005 (2,128)Price ($/lb) 0.89 1.39 +55 2003 (1.55) 1989 (0.51)<strong>Crescent</strong> <strong>City</strong> Fishing Community <strong>Profile</strong> 19
1,2001,000800TotalGroundfish trawlSalmon trollCrab potShrimp trawlRockfish/lingcod H&LBoatsTrips600400200016,00014,00012,00010,0008,0006,0004,0002,0000198119821983198419851986198719881989199019911992199319941995199619971998199920002001Rockfish/lingcod H&LShrimp trawlSalmon trollCrab potGroundfish trawl198119821983198419851986198719881989199019911992199319941995199619971998199920002001200220032004200520062007Figure 7. Number of trips by fishing vessels landing at <strong>Crescent</strong> <strong>City</strong> for selected fisheries and overall,1981–2007. Note: Activity cannot be reported for years when more than zero and fewer than three boats orbuyers participated in the groundfish trawl (2006–2007), salmon troll (1992, 1995, 1997) and shrimp trawl(2003–2005, 2007) fisheries.<strong>Crescent</strong> <strong>City</strong> Fishing Community <strong>Profile</strong> 20Total200220032004200520062007Figure 6. Number of boats with commercial fishery landings at <strong>Crescent</strong> <strong>City</strong> for selected fisheries andoverall, 1981–2007. Note: Activity cannot be reported for years when more than zero and fewer than threeboats or buyers participated in the groundfish trawl (2006–2007), salmon troll (1992, 1995, 1997) and shrimptrawl (2003–2005, 2007) fisheries.
the period 1984–1991, increased to 30–50during the period 1992–2004, and decreasedagain to 20–27 during the period 2005–2007.Participants noted that despite an increasein the number of buyers, the actual numberof ‘fish houses’ – large volume fish buyersthat process and/or distribute the catch – hasdeclined in the region.Of the 23 buyers that received commerciallycaught seafood at <strong>Crescent</strong> <strong>City</strong> in 2005,about 75% were predominantly engagedin fish receiving (and perhaps processing,wholesale activities and distribution). Theremaining receivers were fishermen whosell their own (and perhaps others’) catchdirectly to restaurants and other retailers and/or consumers. Of the 20 buyers that receivedfish at <strong>Crescent</strong> <strong>City</strong> in 2007, three accountedfor slightly more than 55% of the landed valueof the catch, five accounted for 75% and sevenaccounted for 90%. Eleven (just over half)of those receivers relied entirely on <strong>Crescent</strong><strong>City</strong> for their <strong>California</strong> receipts, and 14 reliedon <strong>Crescent</strong> <strong>City</strong> for more than 50% of their<strong>California</strong> receipts.The average ex-vessel price for all fisheriescombined is 55% greater in the recent term($1.39 per pound) compared to the long term($0.89 per pound). However, the trends varyamong fisheries. Recent-term prices are lowerthan long-term prices in the shrimp trawl(-33%), whiting (-13%), albacore (-21%),crab (-11%) and shrimp pot (-7%) fisheries.In contrast, recent-term prices are greater inthe rockfish hook-and-line (+82%), salmon(+13%), and groundfish trawl (+5%) fisheries.The distribution of ex-vessel value amongvessels and buyers provide insights intothe extent to which consolidation of fishingactivity has occurred. Over the past decade(1998–2007), the number of boats deliveringfish to <strong>Crescent</strong> <strong>City</strong> decreased from 247 to157, while the proportion of boats accountingfor 90% of landed value at the port increasedslightly from 42%–46% prior to 2003 to45%–54% thereafter. Over the same period,the number of buyers decreased from 50 to 20,while the proportion of buyers accounting for90% of the landed value increased from 16%to 35%. While vessel and buyer concentrationremain a feature of <strong>Crescent</strong> <strong>City</strong> fisheries,both have lessened since 1998. The reductionin buyer concentration has been more dramaticand is likely related to the closure of two majorprocessors at the port around 2000.Activity Within Commercial Fisheries<strong>Crescent</strong> <strong>City</strong> has supported a diversityof fisheries over time. Crab, salmon, andgroundfish trawl have historically been themainstay of <strong>Crescent</strong> <strong>City</strong>’s commercialfisheries, together accounting for an averageof 91% of the ex-vessel value of landings peryear over the long term (1981–2007) and 97%in recent years (2003–2007). This sectionexamines fishery activity based on landingsdata for these fisheries and for two othershighlighted in our meetings with communitymembers: the shrimp trawl and rockfish/lingcod hook-and-line and pot fisheries.Albacore troll, coonstripe shrimp pot andPacific whiting trawl fisheries have played arole as well, and are discussed briefly.The Dungeness Crab Pot FisheryDungeness crab has ranked first among the port’scommercial fisheries on most measures over thelong term and in recent years. According to studyparticipants, some of the best crab grounds arewithin a few miles of the harbor and, although theabundance of crab is cyclical, these grounds havebeen extremely productive. Historically, the crabwas cooked and canned, but today crab is soldeither cooked and frozen (whole or in sections),or live.Between 1981 and 2002, landings varied widelybetween 1.1 million pounds (worth $3.0 million)and 7.0 million pounds (worth $12.3 million)<strong>Crescent</strong> <strong>City</strong> Fishing Community <strong>Profile</strong> 21
Pounds and ex-vessel value (millions, 2007$)2520151050Moratoriumon entryFigure 8. Landings, ex-vessel value (2007$), and number of boats and buyers for the commercial Dungenesscrab fishery at <strong>Crescent</strong> <strong>City</strong>, 1981–2007.Table 8. Long-term and recent annual average, percent difference, and highs and lows in selected measuresfor commercial crab pot fishery at <strong>Crescent</strong> <strong>City</strong>, 1981–2007.Long-term RecentPercent High year(s) Low year(s)average averagedifference (amount) (amount)Crab pot 1981–2007 2003–2007Landings (lbs) 4,449,260 8,133,587 +83 2006 (12,916,602) 2001 (1,135,811)Ex-vessel value ($) 8,625,771 14,301,909 +66 2006 (21,434,629) 2002 (2,830,656)Boats 189 124 -34 1982 (276) 2005 (106)Buyers 26 34 +34 2004 (45) 2007 (16)Trips 2,416 2,108 -13 1982 (3,880) 2002 (730)Price ($/lb) 2.04 1.81 -11 1983 (2.80) 1993 (1.46)Limitedentry19811982198319841985198619871988198919901991199219931994199519961997Crab PotPounds landedEx-vessel valueBoatsBuyers1998199920002001200220032004200520062007300250200150100500Boats and buyers(Figure 8, Table 8). The record low activityexperienced in 2001 and 2002 (1.1–1.6 millionpounds, $2.8–$3.0 million) was followed bythree extraordinary years (2003, 2004, 2006) inwhich landings and value ranged between 9.4 and12.9 million pounds and $16.3 and $21.4 million,respectively. 22The numbers of boats and buyers participatingin the crab fishery also have fluctuated,although not in synchrony with landings.Average annual vessel participation in recentyears was 124 boats, 34% lower than thelong-term average of 189 boats. Participationpeaked at 246–276 boats during the period1981–1984 and 256 boats in 1993. However,the general trend has been a marked decline<strong>Crescent</strong> <strong>City</strong> Fishing Community <strong>Profile</strong> 22
from more than 245 boats in the early 1980sto 109–137 boats since 2001. The averagenumber of buyers (including fishermen sellingtheir own catch) was 34 in recent years, a 34%increase from the long-term average of 26.The number of buyers increased from 6–11 forthe period 1981–1997 to 11–19 for the period1998–2005, then declined to 11–12 for theperiod 2006–2007.The number of crab trips at <strong>Crescent</strong> <strong>City</strong>averaged 2,108 in recent years, 13% lowerthan the long-term average of 2,416 trips. Tripspeaked at more than 3,500 in 1981–1983 and1996, and were at their lowest (730–1,981trips) in 2001 and 2002 (the years of recordlow landings). During years of record highlandings (2003, 2004, 2006), the number oftrips ranged from 2,052 to 3,033, a rather“ordinary” level of effort. This apparent lackof synchrony between landings and trips mayreflect, to a large extent, the marked increase inthe number of traps used.in recent years. Prices have varied considerablynonetheless, from a low of $1.46 per pound(1993) to a high of $2.80 per pound (1983).The crab fishery has played an increasinglycentral role for the <strong>Crescent</strong> <strong>City</strong> commercialfishing community as a result of severalfactors, most notably reduced opportunities inother fisheries and availability of and access tothe resource. The proportion of fishing activityat <strong>Crescent</strong> <strong>City</strong> involving crab has been muchhigher in recent years relative to the longterm. Crab boats as a proportion of total boatslanding at <strong>Crescent</strong> <strong>City</strong> has increased from52% to 81%. The contribution of crab tripshave increased from 41% to 69%, of landingsfrom 22% to 67%, and of ex-vessel value from52% to 86% of those totals.The Groundfish Trawl FisheryAnnual landings of groundfish declined steadilyfrom 6.1–10.6 million pounds during the period1981–1990 to 2.8–5.9 million pounds duringthe period 1991–2000, and to 1.1–2.8 millionpounds during the period 2001–2007 (Figure 9,Table 9). Landings have averaged 1.4 millionpounds in recent years, a 73% decline from thelong-term average of 5.1 million pounds. The exvesselvalue of groundfish landings declined by70%, from a long-term average of $2.7 million to$821,000 in recent years. Landed value fell from$3.0–$4.5 million during the period 1981–1990,to $1.9–$3.9 million during the period 1991–2000, and to $500K–$1.8 million during theperiod 2001–2007.Local ex-vessel prices for crab averaged$1.81 in recent years, an 11% decline fromthe long-term average of $2.04. This change issomewhat unexpected, given the growth in thelive market, which can offer prices twice thosefor cooked crab. However, larger landings in2003, 2004 and 2006, especially early in theseason when most of the product is directed tothe lower-priced cooked and frozen sectionedcrab market, may have kept average prices low<strong>Crescent</strong> <strong>City</strong> Fishing Community <strong>Profile</strong> 23
Pounds and ex-vessel value (millions, 2007$)121086420Limited Entry 19811982198319841985198619871988198919901991199219931994199519961997199819992000Groundfish TrawlPounds landedEx-vessel valueBoatsBuyersGroundfish disaster Non-reportableTrawl buyback 2001200220032004200520062007Figure 9. Landings, ex-vessel value (2007$), and number of boats and buyers for the commercial groundfishtrawl fishery at <strong>Crescent</strong> <strong>City</strong>, 1981–2007. Note: Activity cannot be reported for 2006 and 2007, when morethan zero but fewer than three boats or buyers participated in the fishery.Table 9. Long-term and recent annual average, percent difference, and highs and lows in selected measuresfor commercial groundfish trawl fishery at <strong>Crescent</strong> <strong>City</strong>, 1981–2007. Note: Data for 2006 and 2007, yearswhen fewer than three boats or buyers participated in the fishery, are included in averages but excluded fromhighs and lows.Groundfish trawlLong-termaverage1981–2007Recentaverage2003–2007PercentdifferenceHigh year(s)(amount)Low year(s)(amount)Landings (lbs) 5,076,900 1,375,267 -73 1982 (10,595,055) 2004 (1,065,626)Ex-vessel value ($) 2,710,460 821,198 -70 1989 (4,531,671) 2004 (500,702)Boats 28 8 -75 1993 (48) 2004 (3)Buyers 7 2 -71 1987 (15) 2005 (3)Trips 478 102 -79 1983 (946) 2004 (56)Price ($/lb) 0.56 0.59 +5 1995 (0.79) 1983 (0.41)6050403020100Boats and buyersThe number of trawlers landing groundfishat <strong>Crescent</strong> <strong>City</strong> averaged eight boats inrecent years, a 75%, decline from the longtermaverage of 28 boats. From 1981 through1999, the number of boats ranged from 27to 40 (except for the peak of 48 in 1993).Participation declined to 19–24 boats duringthe 2000–2003 period (as regulations becamemore restrictive to protect overfished stocks),then fell sharply to 3–7 boats during the 2004–2007 period (following the trawl buyback).The number of groundfish buyers in <strong>Crescent</strong><strong>City</strong> averaged 2 in recent years, a 71% declinefrom the long-term average of 7 buyers. The<strong>Crescent</strong> <strong>City</strong> Fishing Community <strong>Profile</strong> 24
number of buyers peaked at 10–13 from 1981through 1986 and 1993 through 1994, and was5–9 throughout the rest of the pre-2003 period.Since 2003, however, the number of buyers hasfallen to 1–4.An average of 102 groundfish trips weretaken in <strong>Crescent</strong> <strong>City</strong> in recent years, a 79%decline from the long-term average of 478 trips(see Table 9). During the period 1981–1985,728–946 trips were made per year; over thenext 14 years (1986–1999), trips stayed withinthe 409–679 range. Effort declined to 221–401trips during the period 2000–2003, thendeclined even further to 56–90 trips between2004 and 2007 (after the trawl buyback).The annual price of trawl-caught groundfishaveraged $0.59 per pound (for all speciescombined) in recent years, a modest 5%increase over the long-term average of $0.56.The fishery targets a mix of species, with somespecies commanding a higher dockside priceper pound than others. Changes in the speciescomposition of landings, due to changingmarkets, abundance and limits on the catch ofindividual species, affect average ex-vesselprices.Groundfish trawl activity at <strong>Crescent</strong> <strong>City</strong> hasdeclined not only in absolute terms, but alsoas a proportion of total activity at the port.The proportion of vessels at <strong>Crescent</strong> <strong>City</strong>consisting of groundfish trawlers averaged 8%over the long term, relative to 5% in recentyears. Over these same periods, the groundfishcontribution to total trips declined from 8% to3%, the contribution to landings declined from24% to 11%, and the contribution to landedvalue declined from 16% to 5%.The Salmon Troll FisheryThe commercial salmon troll fishery hashistorically played a vital role in the <strong>Crescent</strong><strong>City</strong> fishing community (see Figure 2).However, dramatic changes occurred in<strong>Crescent</strong> <strong>City</strong>’s salmon fishery during theperiod 1981–2007 (Figure 10, Table 10).Average annual landings in recent years(89,000 pounds) are 40% lower than thelong-term average of 149,000 pounds. Theseaverages reflect a precipitous decline thatoccurred largely in the 1980s. Since 1990,landings have been consistently and verylow, with the notable exception of 2004,when landings reached 337,000 pounds. The2004 spike is due to an unusual abundanceof Chinook salmon off the Southern Oregoncoast; <strong>California</strong> fishermen fished nearby inwaters off Oregon and delivered their catch at<strong>Crescent</strong> <strong>City</strong>. 23 Fishing was not allowed in theKMZ in 1985, 1992–1995 and again in 2006.Minimal landings occurring in those years, andwere due to a small number of trollers whofished in other areas but landed their catch at<strong>Crescent</strong> <strong>City</strong>.Ex-vessel values follow a pattern similar tolandings, with average landed value in recentyears ($270,000) 49% lower than the longtermaverage of $524,000. Landed valueranged between $3.7 million and $4.4 millionin 1981 and 1982, then fell to $57,000 in 1985;through the rest of the 1980s, ex-vessel valueranged from $364,000 to $1.5 million. Since1990, ex-vessel values have been consistentlyvery low (well below $200,000 per year), withthe notable exception of 2004, when the valuewas $980,000.The average annual number of boats in thefishery declined by 78% from a long-termaverage of 134 boats to an average of 29 boatsin recent years (Tab. Participation declinedfrom 911 boats in 1981 to 21 boats in 1985(closure of the <strong>California</strong> KMZ in 1985limited salmon participation to vessels fishingoutside the KMZ that were willing to travel to<strong>Crescent</strong> <strong>City</strong> to land those fish). Participationrebounded to 248 boats in 1986 (when theKMZ reopened), then continued its downwardtrajectory to 18 boats by 1991. Participation<strong>Crescent</strong> <strong>City</strong> Fishing Community <strong>Profile</strong> 25
Pounds and ex-vessel value (millions, 2007$)543210Limited entry KMZ closed 19811982198319841985198619871988198919901991KMZ closed Coho salmon disasters Figure 10. Landings, ex-vessel value (2007$), and number of boats and buyers for the commercial salmon trollfishery at <strong>Crescent</strong> <strong>City</strong>, 1981–2007. Note: Activity cannot be reported for 1992, 1995 and 1997, when morethan zero but fewer than three boats or buyers participated in the fishery.Table 10. Long-term and recent annual average, percent difference, and highs and (nonzero) lows in selectedmeasures for commercial salmon troll fishery at <strong>Crescent</strong> <strong>City</strong>, 1981–2007. Note: No landings occurred in1994 and 2006. Data for 1992, 1995 and 1997, when fewer than three boats or buyers participated in thefishery, are included in averages but excluded from highs and lows.Salmon trollLong-termaverage1981–2007Recentaverage2003–2007PercentdifferenceHigh year(s)(amount)Low year(s)(amount)Landings (lbs) 148,643 89,499 -40 1981 (1,120,731) 1998 (753)Ex-vessel value ($) 524,265 269,718 -49 1981 (4,401,181) 1998 (1,685)Boats 134 29 -78 1981 (911) 1998 (3)Buyers 7 4 -43 1982 (23)1993, 1998,2000, 2003 (3)Trips 866 66 -92 1982 (7,871) 1993, 1998 (6)Price ($/lb) 2.83 3.21 +13 2007 (4.89) 1983 (1.20)KMZ closed 1992199319941995199619971998Salmon trollPounds landedEx-vessel valueBoatsBuyersNon-reportableKlamath salmon disaster 1999200020012002200320042005200620071,0009008007006005004003002001000Boats and buyersdeclined further to 0–11 boats during theperiod 1992–2001, then increased to 21–47vessels during the period 2002–2007 (exceptfor 2006, when the KMZ was closed again).The number of salmon buyers averaged fourin recent years, 43% lower than the long-termaverage of seven. The number of buyers was19–23 between 1981 and 1983, fell to 9–14from 1984 through 1990, and declined furtherto 0–10 thereafter. Several fishermen who selltheir own catch are included in these counts.<strong>Crescent</strong> <strong>City</strong> Fishing Community <strong>Profile</strong> 26
The annual number of salmon trips averaged66 in recent years, a 92% decline from thelong-term average of 866 trips. Fishing effort,which exceeded 7,800 trips in 1981 and 1982,declined precipitously to 26 trips in 1985(when the <strong>California</strong> KMZ was closed). Effortrebounded to 708 trips in 1986, when theKMZ reopened, then continued its downwardtrajectory to 21 trips by 1991. Since 1992,effort has ranged from 0 to 178 trips per year,exceeding 100 in only two years (2002 and2004).Annual ex-vessel prices for salmon averaged$3.21 per pound in recent years, a modest 13%increase compared to the long-term averageof $2.83 per pound. From 1981 through 1993,prices varied from $2.51 to $4.31. From1995 through 2004, prices shifted downwardto $1.58–$2.91 per pound. After the fisheryclosure in 2006, prices peaked at $4.89 in2007.Salmon troll activity at <strong>Crescent</strong> <strong>City</strong> hasdeclined not only in absolute terms, but alsoas a proportion of total activity at the port.The proportion of vessels that participated inthe fishery averaged 37% over the long term,and 19% in recent years. Over these sameperiods, the salmon contribution to total tripsdeclined from 15% to 2%, the contribution tolandings remained unchanged at 1%, and thecontribution to landed value declined slightlyfrom 3% to 2%.and participation, and provided part of theincentive for the construction of a wastewatertreatment facility at the harbor. Since 2008,ocean shrimp trawl grounds in state watershave been closed between Point Reyes andFalse Cape (located south of Eureka). <strong>Crescent</strong><strong>City</strong> shrimp fishermen reported fishing south ofCape Mendocino (delivering to <strong>Crescent</strong> <strong>City</strong>,Eureka or Fort Bragg) many years in the past,as the resource was often more abundant andaccessible than in federal waters off <strong>Crescent</strong><strong>City</strong>.Shrimp landings exceeded three millionpounds in 1981 and 1982, declined abruptly asthe resource became scarce during the 1982–83El Niño, then expanded steadily to 6.5 millionpounds in 1987 (Figure 11, Table 11). Landingspeaked between 1988 and 1992, ranging from7.8 million to 17.3 million pounds. Landingsdeclined to 1.2–8.8 million pounds between1993 and 2002, then declined more abruptlyto 0–350,000 pounds between 2003 and 2007.Annual landings averaged 172,000 pounds inrecent years, 96% lower than the long-termaverage of 4.6 million pounds. Ex-vesselvalue followed a similar pattern, peaking at$5.5–$7.9 million between 1987 and 1992and reaching lows of $0–$172,000 duringthe period 2003–2007. Annual landed valueaveraged $78,700 in recent years, 97% lowerthan the long-term average of $3.1 million.The Ocean (Pink) Shrimp Trawl FisheryThe shrimp trawl fishery, managed by the statewith some federal oversight, 24 started alongthe North Coast in the 1950s, and expandedin the 1970s largely due to technologicalchanges in fishing (i.e., double-rig trawlnets) and processing (i.e., shrimp peelingmachines) (Frimodig et al. 2009). Although theshrimp trawl fishery has played a lesser roleat <strong>Crescent</strong> <strong>City</strong> in recent years, historicallyit accounted for substantial landings, value<strong>Crescent</strong> <strong>City</strong> Fishing Community <strong>Profile</strong> 27
The number of boats participating in thefishery dropped sharply from 57 in 1981 to 15in 1983 (due to the scarcity of shrimp duringthe El Niño event), then peaked at 83 in 1994(likely in anticipation of a state moratoriumon entry into the fishery). Since then, thenumber of boats has declined, reaching lowsof 0–7 boats since 2003. Annual participationaveraged three boats in recent years, 93% lessthan the long-term average of 41 boats.From 1981 to 1982, 10–12 buyers of trawlcaughtshrimp operated in <strong>Crescent</strong> <strong>City</strong>. Thenumbers of buyers fell to 4–9 from 1983 to2001. Since 2002, however, the number ofbuyers has averaged one, 83% lower than thePounds and ex-vessel value (millions, 2007$)20181614121086420El Nino Moratorium on entry 1981198219831984198519861987198819891990199119921993199419951996199719981999Shrimp TrawlPounds landedEx-vessel value20002001200220032004200520062007Figure 11. Landings, ex-vessel value (2007$), and number of boats and buyers for the commercial shrimptrawl fishery at <strong>Crescent</strong> <strong>City</strong>, 1981–2007. Note: Activity cannot be reported for 2003–2007, when more thanzero but fewer than three boats or buyers participated in the fishery.<strong>Crescent</strong> <strong>City</strong> Fishing Community <strong>Profile</strong> 28BoatsBuyersLimited entry northern region Non-reportableBycatch reduc6on devices required Table 11. Long-term and recent annual average, percent difference, and highs and (nonzero) lows in selectedmeasures for commercial ocean shrimp trawl fishery at <strong>Crescent</strong> <strong>City</strong>, 1981–2007. Note: No landings occurredin 2006. Data for 2003–2007, when fewer than three boats or buyers participated in the fishery, are includedin averages but excluded from highs and lows.Long-termaverage1981–2007Recentaverage2003–2007Percent High year(s) Low year(s)Shrimp trawldifference (amount) (amount)Landings (lbs) 4,597,480 172,034 -96 1992 (17,298,714) 1983 (232,806)Ex-vessel value ($) 3,072,551 78,660 -97 1992 (7,877,070) 1983 (279,299)Boats 41 3 -93 1994 (83) 2002 (12)Buyers 6 1 -83 1994 (14) 2002 (3)Trips 485 8 -98 1992 (1,143) 2002 (56)Price ($/lb) 0.66 0.44 -33 1983 (1.2) 2001 (0.32)9080706050403020100Boats and buyers
long-term average of six buyers. This is due inpart to receiving and processing issues at theport despite reports from fishermen and othersof increases in the resources and improvedmarkets for the product.The number of shrimp trawl trips dropped from853 in 1981 to 64 in 1983. Effort subsequentlyincreased to 912–1,143 trips between 1986 and1992, then declined dramatically to 0–17 tripsduring the period 2003–2007. Annual shrimptrawl effort averaged eight trips in recent years,98% lower than the long-term average of 485trips.Prices for trawl-caught shrimp have rangedwidely, increasing from $0.97 per pound in 1981to a peak of $1.20 per pound in 1983 (whenshrimp were scarce). Since then, prices havegenerally cycled downward, reaching lows of$0.32–$0.49 during the period 2000–2007. Pricesaveraged $0.44 per pound in recent years, 33%lower than the long-term average of $0.66.The shrimp trawl fishery accounted for about11% of boats, 8% of trips, 22% of landings and18% of landed value at <strong>Crescent</strong> <strong>City</strong> over thelong term. The fishery’s contribution to <strong>Crescent</strong><strong>City</strong> activity has declined dramatically in recentyears to 2% of boats, less than 1% of trips, and1% of landings and landed value.The Rockfish and Lingcod Hook-and-LineFisheryCommercial fishing for rockfish and lingcodusing hook-and-line and bottom longline gearhas occurred at <strong>Crescent</strong> <strong>City</strong> for decades.Traditionally, the fishery produced whole fishand filets for retail and food service. Since thelate 1990s the fishery also has served the live fishmarket, which emerged about a decade earlier inthe southern part of the state.Landings increased from 407,000 poundsin 1981 to a peak of 1.1 million pounds in1989–1990 (Figure 12, Table 12). This upwardtrend was interrupted in 1983–1984 by the1982–1983 El Niño and extreme weather in1984 that made fishing particularly difficult(CDFG 1984, 1985). Landings declined to164,000–258,000 pounds during the period1999–2007. The ex-vessel value of landingsfollowed a similar pattern between 1981 and1990, although the increase in value from 1985to 1990 was not as dramatic as the increasein landings. After 1990, however, instead ofdeclining as landings did, ex-vessel valuesvaried from $249,000 to $572,000 withoutapparent trend.Annual landings averaged 194,000 pounds inrecent years, a 55% decline compared to thelong-term average of 429,000 pounds. The exvesselvalue of landings increased by 6%, froma long-term average of $410,000 to $436,000in recent years.The trend in the number of rockfish hookand-linefishery participants at <strong>Crescent</strong> <strong>City</strong>bears some similarity to the trend in landings.Participation averaged 27 boats in recent years,64% lower than the long-term average of 76boats. Prior to 1989, vessel participation variedwidely, ranging between highs of 135–159 in1981, 1982, 1986 and 1987 and a low of 11boats in 1984. According to local fishermen,many displaced salmon fishermen enteredthe fishery in 1985 and 1986 when harvestopportunities in the KMZ were severelyconstrained. Participation reached 147 boats in1989 and declined steadily thereafter to 41–49during the period 1999–2002. From 2003onward, participation declined again to fewerthan 30 boats following the implementationof restricted access in the state’s nearshorefishery.The number of buyers in this fishery averaged8 in recent years, a 43% decline from the longtermaverage of 14. Between 8 and 28 buyerspartipcated during the period 1981–2004, thendeclined to 5–7 thereafter, due to fewer boats<strong>Crescent</strong> <strong>City</strong> Fishing Community <strong>Profile</strong> 29
Pounds and ex-vessel value (millions, 2007$)1.21.00.80.60.40.20.0Severe Weather Hearshore Fishery Management Act 19811982198319841985198619871988198919901991199219931994199519961997199819992000Rockfish/LingcodHook & LineLive fish fishery Pounds landedEx-vessel valueBoatsBuyersNearshore FMP, restricted access, RCAs 2001200220032004200520062007Figure 12. Landings, ex-vessel value (2007$), and number of boats and buyers for the commercial rockfishand lingcod hook-and-line fishery at <strong>Crescent</strong> <strong>City</strong>, 1981–2007.Table 12. Long-term and recent annual average, percent difference, and highs and lows in selected measuresfor commercial rockfish/lingcod hook-and-line fishery at <strong>Crescent</strong> <strong>City</strong>, 1981–2007.Long-termaverage1981–2007Recentaverage2003–2007Rockfish/Lingcodhook-and-linePercentdifferenceHigh year(s)(amount)Low year(s)(amount)Landings (lbs) 428,620 193,984 -55 1989 (1,140,393) 1984 (3,668)Ex-vessel value ($) 410,125 435,883 +6 1990 (777,303) 1984 (4,391)Boats 76 27 -64 1986 (159) 1984 (11)Buyers 14 8 -43 1997 (25) 2006 (5)Trips 1,204 560 -53 1990 (2,705) 1984 (27)Price ($/lb) 1.24 2.25 +82 2003 (2.65) 1982 (0.47)180160140120100806040200Boats and buyersand lower landings. Most of the buyers arenow local fishermen who sell their own and insome cases others’ catch both locally and toSan Francisco Bay area markets.Annual effort averaged 560 trips in recentyears, a 53% decline from the long termaverage of 1,204. The trend in trips is similarto the trend in vessel participation. In 1981 and1982, the number of trips exceeded 1,000, thendropped sharply to a low of 27 in 1984. Effortsubsequently increased to a high of 2,705 tripsin 1990, gradually declining to 480–657 tripsduring the 2003-2007 period.<strong>Crescent</strong> <strong>City</strong> Fishing Community <strong>Profile</strong> 30
Average annual prices ranged from $0.47 to$1.20 per pound between 1981 and 1998,increased to $1.56 in 1999 and peaked at$1.91–$2.65 between 2000 and 2007. Theincrease in prices in the late 1990s coincidedwith the expansion of the live fish fishery.Prices in recent years averaged $2.25 perpound, 82% higher than the long-term averageof $1.24.Whereas this fishery has accounted for anaverage of only 2%–3% of total landings andex-vessel value in <strong>Crescent</strong> <strong>City</strong> (over the longterm and in recent years), it has accounted fora considerable proportion of fishing effort.The proportion of vessels at <strong>Crescent</strong> <strong>City</strong> thatparticipate in this fishery averaged 21% overthe long term, relative to 18% in recent years.Over these same periods, the contribution ofthis fishery to total trips also declined from21% to 18%, while the proportion of buyersparticipating in the fishery declined from 42%to 31%.The Coonstripe Shrimp Trap/Pot Fishery<strong>California</strong>’s commercial trap fishery forcoonstripe shrimp (Pandalus danae) isrelatively new, started in 1992 by a smallgroup of <strong>Crescent</strong> <strong>City</strong> fishermen. The lack oflandings prior to 1992, and the low number ofparticipants between 1992 and 1995 and againin 2007 limit the discussion here (Figure 13,Table 13). 25 Landings rose through the late1990s, peaking at just over 81,000 pounds in2000, then generally declined to a reportablelow of 35,411 pounds in 2006. Annual landingsaveraged 45,343 pounds in recent years,similar to the long-term (1992–2007) averageof 45,999 pounds.Annual ex-vessel value averaged $181,692 inrecent years, a 9% decline from the long- term(1992–2007) average of $199,623. Ex-vesselvalue more than doubled from $181,000 in1996 to a high of $396,598 in 2000, thendeclined to $143,530 by 2006 .Pounds and ex-vessel value (millions, 2007$)450400350300250200150100500Shrimp PotPoundsEx-vessel valueBoatsBuyersNon-reportableFishery begins 198119821983198419851986198719881989199019911992199319941995199619971998199920002001200220032004200520062007Figure 13. Landings, ex-vessel value (2007$), and number of boats and buyers for the commercial coonstripeshrimp pot fishery at <strong>Crescent</strong> <strong>City</strong>, 1981–2007. Note: No landings occurred between 1981 and 1991. Activitycannot be reported for 1992–1995 and 2007, when more than zero but fewer than three boats or buyersparticipated in the fishery.<strong>Crescent</strong> <strong>City</strong> Fishing Community <strong>Profile</strong> 3120181614121086420Boats and buyers
Table 13. Long-term and recent annual average, percent difference, and highs and (nonzero) lows in selectedmeasures for commercial coonstripe shrimp pot fishery at <strong>Crescent</strong> <strong>City</strong>, 1992–2007. Notes: No landingsoccurred between 1981 and 1991. Data for 1992–1995 and 2007, when fewer than three boats or buyersparticipated in the fishery, are included in averages but excluded from highs and lows.Long-termaverage1992–2007Recentaverage2003–2007CoonstripeShrimp potPercentdifferenceHigh year(s)(amount)Low year(s)(amount)Landings (lbs) 45,999 45,343 -1 2000 (81,278) 1996 (43,502)Ex-vessel value ($) 199,623 181,692 -9 2000 (396,598) 2006 (143,530)Boats 8 9 +12 1997, 1998, 2001 (17) 1996 (3)Buyers 4 3 -25 1997 (17) 2006 (3)Trips 96 90 -6 1997 (242) 1996 (45)Price ($/lb) 4.36 4.04 -7 1999 (5.06) 2005 (3.92)The number of boats participating in thefishery has been quite variable, increasing from3 in 1996 to 17 in 1997 (as well as 1998 and2001). In all other reportable years, 8–11 boatsparticipated in the fishery. Annual participationaveraged nine boats in recent years, 12%higher than the long-term average of eightboats.The number of buyers quadrupled from fourin 1996 to 17 in 1997, then declined to threeby 2006. Buyer participation in the fisheryaveraged three in recent years.The number of trips increased from 45 in1996 to a high of 242 in 1997, then varied butgenerally declined to 86 trips by 2006. Theaverage number of trips in recent years was 90,a 6% decline from the long-term average of 96.Coonstripe shrimp is one of the higher priced (andlower volume) fisheries at <strong>Crescent</strong> <strong>City</strong>. Pricesranged from $3.92 to $5.06 per pound between1996 and 2006. The average price in recent yearswas $4.00 per pound, a 7% decline from the longtermaverage of $4.36.The Albacore Troll FisheryAlbacore tuna is a highly migratory specieswhose distribution varies widely. Oceanicconditions such as warm water currents(particularly El Niño events) and availabilityof prey affect their migration. Albacore canrange within 10 to 50 miles of the coast orfurther offshore and from south to well northof <strong>Crescent</strong> <strong>City</strong>. With the closure of the lastlarge <strong>California</strong> cannery in 2001, most fisheryparticipants market their catch through directsales or deliver to one of the few remainingcanneries in Oregon or Washington. As aresult, participation and production at <strong>Crescent</strong><strong>City</strong> can vary widely from year to year.Average annual landings of troll-caughtalbacore in recent years and over the longterm have been about the same, at 237,548and 227,318 pounds respectively. Ex-vesselvalue averaged $205,065 and $237,388over the same periods (Figure 14, Table14). The apparent stability in these averageestimates masks the high degree of interannualvariability in the fishery. Years of peaklandings (1982, 1994, 1996 and 1997) havelargely coincided with El Niño events. In theremaining (reportable) years, landings andvalue ranged widely, from 24,051 to 306,734pounds and from $28,863 to $539,836.The number of boats with albacore trolllandings at <strong>Crescent</strong> <strong>City</strong> averaged 20 in recentyears, down 23% compared to the long-term<strong>Crescent</strong> <strong>City</strong> Fishing Community <strong>Profile</strong> 32
Pounds and ex-vessel value (millions, 2007$)1.00.90.80.70.60.50.40.30.20.10.0CanneryclosuresEl NiñoOne in-statecanneryremaining19811982198319841985198619871988198919901991El NiñoAlbacore trollPoundsEx-vessel valueBoatsBuyersNon-reportable1992199319941995199619971998199920002001200220032004200520062007Figure 14. Landings, ex-vessel value (2007$), and number of boats and buyers for the commercial albacoretroll fishery at <strong>Crescent</strong> <strong>City</strong>, 1981–2007. Note: Activity cannot be reported for 1991, when more than zero butfewer than three boats or buyers participated in the fishery.Table 14. Long-term and recent annual average, percent difference, and highs and lows in selected measuresfor commercial albacore troll fishery at <strong>Crescent</strong> <strong>City</strong>, 1981–2007. Note: Years when fewer than three boats orbuyers participated are included in averages, but excluded from highs and lows.Long-termaverage1981–2007Recentaverage2003–2007Percent High year(s) Low year(s)Albacore trolldifference (amount) (amount)Landings (lbs) 227,318 237,548 +5 1997 (946,945) 1990 (24,051)Ex-vessel value ($) 237,388 205,065 -14 1997 (916,055) 1990 (28,863)Boats 26 20 -23 1994 (121) 1990 (3)Buyers 9 9 +0 1997 (18) 1986, 1990 (3)Trips 58 41 -29 1994 (271) 1990 (3)Price ($/lb) 1.10 0.86 -21 1981 (1.76) 2003 (0.74)140120100806040200Boats and buyersaverage of 26 boats (Table 14). The numberof trips averaged 41 in recent years, a 29%reduction from the long-term average of 58trips. Peak years of boat activity included 1994(121 boats) and 1996–1997 (75–88 boats),with 3–53 boats participating in other years.The number of trips peaked in 1994 (271 trips),1997 (237 trips) and 1996 (142 trips), with3–74 trips occurring in other years (Table 14).An average of nine buyers participated in thealbacore fishery in recent years and over thelong term (Table 14). The number of buyerswas highest (14–18) in 1993, 1994 and from<strong>Crescent</strong> <strong>City</strong> Fishing Community <strong>Profile</strong> 33
1996 through 1998, and included both lowandhigh-landing periods. These numbersincluded an estimated six fishermen who sell atleast some of their catch directly to the publicin late summer and early fall as a strategyfor dealing with the scarcity of canneries andstagnant prices.Annual ex-vessel prices for albacore landedat <strong>Crescent</strong> <strong>City</strong> averaged $0.86 per pound inrecent years, a 21% reduction from the longtermaverage of $1.07 (Table 14). Recent termprices have been generally been lower andmore stable ($0.74–$1.01 per pound) thanprices in previous years ($0.89–$1.76 perpound).On average, 13% of boats delivering to<strong>Crescent</strong> <strong>City</strong> in recent years have beenalbacore boats, an increase from the longtermaverage of 7%. However, in terms ofother measures of fishing activity, albacorehas accounted for an average of only 1%–2%of total trips, landings and ex-vessel value in<strong>Crescent</strong> <strong>City</strong> (both over the long term and inrecent years).The Pacific Whiting (Hake) Trawl FisheryThe whiting trawl fishery is the largestfishery by volume on the U.S. West Coast.However, only a small portion of the annualharvest is taken in <strong>California</strong>, as the stockhas a limited window of availability (due toits northward migration in late spring) andwhiting processors are largely concentratedin Oregon. 26 The fishery has been among<strong>Crescent</strong> <strong>City</strong>’s top two by volume, accountingfor 14% and 26%, of landings in recent yearsand over the long term, respectively. However,whiting has accounted for only 2% and 1%of ex-vessel value over those same periodsand currently involves no resident vessels.Nonetheless, it supports receivers and otherbusinesses during an otherwise slow period atthe port.Because of the small number of participants,data on the fishery can only be reported forseven individual years: 1985, 1990, 1993 and1997 when reportable landings occurred, and1981, 2002 and 2005 when no landings weremade. Landings averaged 6.3 million poundsover the long term and 2.1 million poundsin recent years; ex-vessel value averaged$407,496 and $97,816 over the same periods.Among the four reportable years with positivelandings, landings peaked in 1997 at 13 millionpounds and value peaked in 1990 at $859,000.Except for 1997 when eight boats (3% of allboats that landed at the port) participated, fiveor fewer boats participated in the fishery at<strong>Crescent</strong> <strong>City</strong>. Similarly, three or fewer buyersreceived whiting locally.The number of whiting trips at <strong>Crescent</strong> <strong>City</strong>averaged 59 over the long term, dropping 75% toan average of 15 per year in recent years. Thesetrips account on average for well under 1% oftrips at <strong>Crescent</strong> <strong>City</strong> in most years, althoughthey accounted for 2% of all trips in 1997.Ex-vessel prices for whiting have consistentlybeen the lowest for all fisheries at <strong>Crescent</strong><strong>City</strong>, at $0.15–$0.16 per pound in 1982 and1983 and less than $0.12 per pound in allsubsequent years. Price per pound averaged$0.07 in recent years, a 13% reductioncompared to the long-term average of $0.08.Commercial Fishery CombinationsCommercial fishery participants move amongfisheries, ports and fishing areas in response tochanges in resource availability, regulations,weather and other factors. Reflecting the highlyconstraining nature of regulations in recentyears, one fisherman noted, “You follow theseasons, the regulations, not so much the fish.”Examination of fishery combinations providesinsight into the changing nature of individualoperations as well as the community.<strong>Crescent</strong> <strong>City</strong> Fishing Community <strong>Profile</strong> 34
For purposes of identifying trends in fisheryparticipation, it would be reasonable to focuson boats that are resident (homeported) at<strong>Crescent</strong> <strong>City</strong>. However, although recent dataon resident vessels were collected as part ofthe fieldwork for this project, similar data forearlier years are not readily available. Thus,in lieu of focusing on resident vessels, wefocused on those boats that earned a plurality(i.e., the greatest proportion) of their annualex-vessel revenues from landings at <strong>Crescent</strong><strong>City</strong> (hereafter referred to as ‘<strong>Crescent</strong><strong>City</strong> vessels’). While there may be somecoincidence between port of residence and theport accounting for plurality of revenue, one isnot necessarily a good proxy for the other.We identified 32 one-, two-, three- and fourwayfishery combinations common to these<strong>Crescent</strong> <strong>City</strong> vessels during three periods:1981–1983, 1993–1995 and 2005–2007(Figure 15, Table 15). In Figure 15, thenumbers in each box indicate the averagenumber of vessels per year that participatedexclusively in that fishery in each period.For example, an annual average of 207 boatsparticipated only in the salmon troll fisheryduring the first period (1981–1983), noneparticipated only in this fishery during thesecond period (1993–1995), and an average offewer than three participated during the mostrecent period (2005–2007). The numbers onthe lines connecting two boxes indicate theaverage number of vessels that participatedexclusively in the fisheries denoted by thosetwo boxes. For example, the line connectingFigure 15. Major one- and two-way fishery combinations utilized by <strong>Crescent</strong> <strong>City</strong> boats based on three-yearaverages for 1981–1983, 1993–1995 and 2005–2007. Note: “-” indicates fishery combinations involving onlyone or two boats, and cannot be reported because of confidentiality rules.<strong>Crescent</strong> <strong>City</strong> Fishing Community <strong>Profile</strong> 35
Table 15. Major three- and four-way fishery combinations utilized by <strong>Crescent</strong> <strong>City</strong> boats in each of threeperiods. Note: “-” indicates fishery combinations involving only one or two boats, and cannot be reportedbecause of confidentiality rules.Fishery Combination1981–1983Average1993–1995Average2005–2007AverageSalmon Troll - Crab Pot - Albacore Troll 21 3 9Salmon Troll - Crab Pot - Rockfish Hook-and-Line 30 4 0Groundfish Trawl - Crab Pot - Salmon Troll 6 0 0Groundfish Trawl - Crab Pot- Shrimp Trawl 5 12 -Albacore Troll - Crab Pot - Shrimp Trawl 5 5 0Albacore Troll - Crab Pot - Rockfish Hook-and-Line 3 9 -Albacore Troll - Crab Pot - Groundfish Trawl - 3 0Albacore Troll - Shrimp Trawl - Rockfish Hook-and-line - 3 -Rockfish Hook-and-line - Sablefish Hook-and-Line - Crab Pot 0 4 -Rockfish Hook-and-line - Crab Pot - Shrimp Pot 0 0 3Swordfish Drift Gillnet - Shark Gillnet – Albacore Troll 0 3 0Salmon Troll - Crab Pot - Albacore Troll - Rockfish Hook-and-Line - 3 -the salmon troll and crab pot boxes indicatesthat an annual average of 77 vesselsparticipated in both the salmon and crabfisheries (only) during the period 1981–1983,8 did for the period 1993–1995, and 11 did forthe period 2005–2007.Several fishery combinations pursued in the early1980s no longer occur at all (or sufficiently toreport). Among the most notable changes are thereductions in salmon troll-only, groundfish trawlonly,rockfish/lingcod hook-and-line/pot-only,salmon troll combination, and groundfish trawlcombination vessels. The numbers of operationsthat fish for crab only or in combination with otherfisheries have not necessarily increased in absoluteterms, but have assumed greater prominencefollowing declines in other fisheries. One newcombination is that of crab pot together withrockfish/lingcod hook-and-line and shrimp pot, twosmaller fisheries directed toward the live market.Study participants discussed several of thesefishery combinations, often highlighting oneof three fisheries as their main fishery and twoothers they depend (or depended) on to fill outtheir annual round. They also noted shifts withinand across fisheries such as the following:As the groundfish fishery became moreregulated and trip limits onerous,… thefleet started to shift into other thingssuch as crab… and shrimp came back,too, so you had a diverse mix then. Alsothe larger salmon vessels moved intogroundfish and crab. So there was a lotof effort just ‘sloshing around’ amongfisheries.Some <strong>Crescent</strong> <strong>City</strong> commercial fisheryparticipants also move among ports to followthe fish, avoid dangerous weather and accessfishery support businesses not available locally.For example, groundfish trawl fishermenreported traveling as far south as San Franciscoand as far north as Washington. When targetingshrimp, trawlers also range widely, fromWestport, Washington to Ft. Bragg – seekingharvest opportunities in areas and times thatare not closed by regulation. Those who fishfor albacore start the late summer seasonfishing far offshore of Newport, Oregon,where they deliver their catch, then followthe fish as they move south toward <strong>Crescent</strong><strong>City</strong> in September and San Francisco byOctober or November. Most salmon fishermen<strong>Crescent</strong> <strong>City</strong> Fishing Community <strong>Profile</strong> 36
travel due to the much more limited fisheryopenings locally, working especially off SanFrancisco or Coos Bay, Oregon. During crabseason, most fishermen stay in the area to fish,although some local fishermen participatein the southern crab season opener off SanFrancisco. Coonstripe shrimp and rockfishhook-and-line fishing are focused locally.Because the catch is perishable and the timeand fuel costs associated with transiting by seais considerable, those who travel to fish usuallydeliver to a port near the fishing grounds eitherto a buyer who operates at <strong>Crescent</strong> <strong>City</strong> or toa different buyer.Revenue Per BoatTrends in aggregate revenues do not necessarilycorrelate with how individual vessels may befaring in terms of revenue. To illustrate this point,we estimated average annual revenue per boatfor <strong>Crescent</strong> <strong>City</strong> boats (defined as boats thatearned a plurality of their ex-vessel revenuesfrom landings at <strong>Crescent</strong> <strong>City</strong>). The number of<strong>Crescent</strong> <strong>City</strong> boats was 353–540 (average=475)between 1981 and 1984, declined to 102–301(average=201) between 1985 and 2002, thendeclined further to 88–122 (average=110)thereafter. Over these same periods, revenueper boat increased from $32,100–$41,300(average=$37,600) to $73,100–$121,200(average=$88,500) to $77,400–$216,200(average=$161,400); (Figure 16). The increase inaverage annual revenue per vessel between 1985and 2002 can be traced to the marked reductionin the number of small-revenue salmon trollersin the early 1980s. The more recent revenueincrease (since 2003) is largely due to unusuallyhigh crab landings during that period.To better understand how vessel revenue isaffected by an individual’s participation inparticular fisheries, we assigned each <strong>Crescent</strong><strong>City</strong> boat to its ‘principal fishery’, that is, thefishery from which the boat derived the pluralityof its annual revenue. For vessels associated witheach principal fishery, we then estimated averageannual revenue per boat (based on their landingsin all fisheries at all West Coast ports). Estimatesfor three-year periods over the last three decadesindicate a decline in the number of <strong>Crescent</strong>550225Boats500450400350300250200150100500Number of boatsRevenue per boat198119821983198419851986198719881989199019911992199319941995199619971998199920002001200220032004200520062007Figure 16. Number of boats that earned a plurality of their revenue from landings at <strong>Crescent</strong> <strong>City</strong>, andaverage annual (total West Coast) revenue per boat, 1981–2007.<strong>Crescent</strong> <strong>City</strong> Fishing Community <strong>Profile</strong> 372001751501251007550250Revenue Per Boat (thousands, 2007$)
<strong>City</strong> boats and an increase in revenue per boat(Table 16). This trend is evident in the crab,salmon, rockfish/lingcod, and groundfish trawlfisheries. Revenue per boat varies considerablyamong fisheries, and is higher for crabbers andgroundfish trawlers than for salmon and rockfishboats, which tend to be smaller and have lesscapacity. Whether these patterns are indicative offuture trends is uncertain, given the high degreeof variability experienced in these fisheries and inother fisheries included in the revenue estimates.It is also unclear whether increases in revenue perboat have kept pace with increasing costs. 27Table 16. Average annual number of <strong>Crescent</strong> <strong>City</strong> boats and average annual revenue per boat (2007$), bymajor fishery and overall, 1981–1983, 1993–1995 and 2005–2007. Note: From 2005 through 2007, at leastthree unique boats participated in the groundfish trawl fishery, however fewer than three participated in theshrimp trawl fishery.AverageNumber of BoatsAverage Annual Revenue Per Boat(All Ports, All Fisheries)1981– 1993– 2005–Major Fishery 1983 1995 2007 1981–1983 1993–1995 2005–2007Crab pot 127 127 82 $ 71,258 $ 64,939 $147,229Salmon troll 293 3 3 $ 6,845 $ 46,929 $ 54,193Rockfish/lingcod hook-and-line 36 33 13 $ 4,057 $ 9,140 $ 32,818Shrimp trawl 11 19 - $270,946 $247,187 -Groundfish trawl 16 12 2 $263,364 $285,841 $298,943Albacore troll 7 3 3 $ 94,927 $ 64,242 $ 98,105All Boats 516 216 105 $ 37,799 $ 92,930 $141,067<strong>Crescent</strong> <strong>City</strong> Fishing Community <strong>Profile</strong> 38
Recreational Fishery Activity at <strong>Crescent</strong> <strong>City</strong>HarborHistorically, <strong>Crescent</strong> <strong>City</strong> harbor supportedextensive ocean recreational fisheries, with aparticular focus on salmon. According to studyparticipants, both coho and Chinook salmonfishing were significant from the 1960s intothe early 1990s. According to a 1991 surveyof ocean salmon sport fishermen in the KMZ,86% (337 of 388 respondents) self-reportedas seasonal visitors, 13% as local residents,and 1% as short-term tourists (Waldvogel1992). Approximately 67% of respondentsstayed at local RV parks, 13% stayed atlocal campgrounds, and 4% stayed at localmotels. Most (68%) used the harbor’s berthingfacilities for their boats, while 17% usedlaunch ramps to launch their boats daily. Thesestudy results suggest the presence of an activerecreational fishery at the harbor with a highproportion of nonresident anglers contributingto local economic activity. Although portspecificdata are limited, these use patternsclearly changed following the sharp reductionin recreational salmon fishing opportunitiessoon after the 1991 survey was completed.Groundfish, especially rockfish and lingcod,is the other major species group targetedby marine anglers at <strong>Crescent</strong> <strong>City</strong>. Studyparticipants reported that this fishery issecondary to salmon, but that it still affordsan opportunity to get out on the water andfish. Many local anglers also participate inrecreational fisheries for crab in the winter.Fewer fishermen participate in the recreationalalbacore fishery in the late summer andearly fall, and then only if the resource iswithin about 10 miles of the coast. Althoughspecific estimates of recreational groundfisheffort are not readily available, regulationshave undoubtedly contributed to a declinein groundfish catch and effort over the pastdecade. 28Recreational Fishing EffortRecreational fishery information specificto <strong>Crescent</strong> <strong>City</strong> is limited. Port-specificestimates of effort and harvest estimates areavailable from CPFV logbooks but cannotbe fully reported for <strong>Crescent</strong> <strong>City</strong>, due toconfidentiality requirements. Salmon effortand harvest estimates for the area are availablefrom CDFG’s Ocean Salmon Project (OSP).Effort and harvest estimates (all species) areavailable from CDFG’s <strong>California</strong> RecreationalFisheries Survey (CRFS), but only at the‘district’ level. 29 Information about otheraspects of local recreational fishing activityprovided here is based on fieldwork conductedin 2007 and 2008.According to the CRFS, an annual averageof 143,000 angler trips 30 were made in theRedwood District (which comprises Del Norteand Humboldt counties, excluding ShelterCove) during the period 2005–2007. About31% of these trips were from private boats,34% from manmade structures, 32% frombeaches and banks, and 3% from charter boats.The dominance of private relative to charterboats at the district level is also characteristicof the <strong>Crescent</strong> <strong>City</strong> recreational fishery.According to the OSP, recreational salmoneffort in the <strong>Crescent</strong> <strong>City</strong> area declined from14,000–52,100 angler trips between 1981 and1991 to 3,300–15,400 trips between 1992 and2002. Effort declined further to 1,500–3,200<strong>Crescent</strong> <strong>City</strong> Fishing Community <strong>Profile</strong> 39
trips during the period 2003–2007. Theaverage annual number of salmon trips in therecent term is 86% less in the private boatfishery and 84% less in the CPFV fisherycompared to the long term (Table 17).The dominance of private boat relative tocharter boat activity indicated by the CRFSRedwood District estimates is also apparentfrom OSP. According to OSP, the proportion ofrecreational salmon effort in the <strong>Crescent</strong> <strong>City</strong>area coming from charter boats was 1%–5%during the period 1981–1994 and has declinedto less than 1% most subsequent years.Table 17. Long-term and recent annual average, percent difference, and highs and (nonzero) lows in thenumber of recreational ocean salmon trips at <strong>Crescent</strong> <strong>City</strong>, 1981–2007 (PFMC 1997, 2009).ModeLong-termaverage1981–2007Recentaverage2003–2007PercentdifferenceHigh year(s)(amount)Low year(s)(amount)Private boat 16,000 2,300 -86 1987 (50,600) 2006 (1,500)CPFV 600 100 -84 1985 (1,600)1992, 1995, 2000, 2004(100)All boat 16,400 2,300 -86 1987 (52,100) 2006 (1,500)<strong>Crescent</strong> <strong>City</strong> Fishing Community <strong>Profile</strong> 40
Key Factors Affecting <strong>Crescent</strong> <strong>City</strong> Fisheries<strong>Crescent</strong> <strong>City</strong>’s fisheries and fishingcommunity have experienced considerablesocial and economic change over the past 30years. Regulatory, market and environmentalfactors have influenced individuals andcommunities, sometimes gradually and at othertimes more abruptly, as with the devastating1964 tsunami. These factors do not operate inisolation; rather, they often interact in complexways. As one study participant summarized:When I arrived [in 1964], therewas no boat basin. The biggest boatwas 52 feet. The biggest impact waswith the boats from the East Coast inthe 1970s. With the [Farm] Credit Act,fishing was viewed as farming. I saw itas an opportunity, but it wasn’t. Singleriggers (trawlers) … were replaced bydouble riggers with two nets. They gotmore sophisticated and more educated[and] depleted the resource. You didn’tneed more than a license to get in. Itwas great back then. Then they neededto move toward a permit.Community members highlighted severalfactors that have shaped local fisheries,infrastructure and the community as a whole(Table 18). Some of these factors originatedlocally, while others are regional, national oreven international in nature. Moreover, theseforces do not operate in isolation. Rather, theyinteract in complex and cumulative ways,posing both challenges and opportunities to theviability and resilience of the community. Thediscussion that follows focuses on those factorshighlighted by study participants as havingmost influenced local fisheries, infrastructure,and the community as a whole.A Watershed Event, Expansion andContractionThe 1964 tsunami fundamentally changedthe course of history for <strong>Crescent</strong> <strong>City</strong> andits fishing community. The devastationevoked national sympathy and catalyzed thecommunity, paving the way for it to obtainfederal funding to build a more extensiveharbor. In a relatively short time, <strong>Crescent</strong><strong>City</strong>’s fishery-support infrastructure wassignificantly improved, and provided oneamong many incentives at that time for localfishery expansion. According to one studyparticipant:Before the boat basin, fishing boats hadto anchor out (in the outer harbor),and fishermen rowed out to them everymorning to go fishing or work on theboat. With the new boat basin, their lifebecame a lot more convenient; the fishplants gave them a better place to selltheir catch; and the haul-out facilitymade it easier to repair (or build)their boats. All of this made it easierand more lucrative to be a fishermanin <strong>Crescent</strong> <strong>City</strong>, and contributed toan atmosphere where investing in afishing boat was ‘the thing to do’. Evensome local loggers and real estatebrokers were buying boats in the late1970s. I don’t know of any other porton the West Coast where so muchpublic investment in commercial fishingoccurred in such a short time.The 1970s into the late 1980s were ‘boomyears’ for <strong>Crescent</strong> <strong>City</strong>, as they were formany other fishing communities along theWest Coast. Expanding markets and incentiveprograms such as the Capital ConstructionFund and Fishing Vessel Obligation GuaranteeProgram fueled the expansion not only of<strong>Crescent</strong> <strong>City</strong> Fishing Community <strong>Profile</strong> 41
Table 18. Key factors and their effects as identified by <strong>Crescent</strong> <strong>City</strong> fishing community members andaugmented by other sources.Factor/EventEffect on Fisheries and CommunityEnvironmental1964 Tsunami Massive destruction and loss of 11 livesFishery activity temporarily suspendedCommunity action to obtain funding for rebuildingVastly improved fishing infrastructure1982–1983 El Niño Decreased abundance of shrimpEffort shifts to groundfish and crab2006 Tsunami Substantial damage to aging slips and other infrastructureAcquisition of external funding to rebuildRegulatory1976 MSA and incentive programs Increased fishing and receiving capacityIncreased catch of many speciesExpanded and enhanced harbor infrastructureIncreased social and economic activityEnhanced sense of opportunity and well-beingLimited entry programsSalmon (1982)Groundfish (1994)Shrimp trawl (1994)Whiting trawl (1994)Crab (1995)Nearshore (2002)Salmon management (Commercial:1982–present, Ocean recreational:1991–present)KMZ and statewide limits/closuresCoho limits/prohibitionsReallocation among sectorsGroundfish managementQuotas, cumulative trip limits(1994–present)Groundfish disaster (2000)Federal trawl buyback (2003)Rockfish conservation areas (2002–present)Shrimp trawl managementBycatch reduction devices (2002)Closure of northern state trawlgrounds (2008)Marine Life Protection Act process(late 2009–present)EconomicIncreased costsInsurance/Workman’s CompFuel prices (summer 2008)Market ChallengesMarket shiftsStagnant/declining pricesMacroeconomic conditionsRecent downturnPre-implementation spikes in participationDecreased participation in some fisheries (e.g., salmon)Effort shifts among fisheriesFor those qualifying: transferable asset, increased securityFor those not qualifying: loss of flexibility, real and/or and perceived economiclossEffort shift to other areas and/or fisheriesExit from fisheryDecreased fishing and offloadingReduced use of fishery-support businessesReduced revenue and employmentEconomic and psychological stressLoss of communityChange of identityDecreased fishing and offloadingEffort shifts among species groups, areas and fisheries (esp. crab)Reduced receiving and local processingReduced use of fishery-support businessesReduced revenue and employmentIncreased costs to harbor (abandoned vessels)Change of identityIncreased catch efficiency/reduced wasteEffort shifts among species groups, areas and fisheriesConcern and mistrustIncreased uncertainty about access to resourceReluctance to invest in fishing, receiving and other support businessesReduced use of goods and servicesIncreased uncertaintyDecreased quality of lifeConcerns about viability, futureEffort shiftsIncreased uncertaintyReduced use of goods and servicesReduced revenue and employment<strong>Crescent</strong> <strong>City</strong> Fishing Community <strong>Profile</strong> 42
fishing, receiving and processing capacity,but also the businesses that supportedthem. However, this era of expansion gaveway to contraction as growing concernsover the health of many commercially andrecreationally important species promptedincreasingly stringent regulation in severalfisheries.Changing Fisheries, Changing CommunityThe ocean salmon fishery was the first of manyto be restricted amid growing concern aboutthe health of fish stocks, in this case KlamathRiver fall Chinook. With the implementationof limited entry for the troll fishery, reductionsin season length especially in the KMZ, theincreased harvest allocation to the Tribes(Pierce 1998), and recent statewide closuresof the fishery, commercial salmon fishing at<strong>Crescent</strong> <strong>City</strong> has gone from a central featureof the port to almost nonexistent today.The situation in the recreational fishery issimilar. As of the late 1970s when harborenhancements were completed, recreationalsalmon fishing involved some 500 boats inseasonal slips and as many as 100 more onmoorings in the harbor’s outer basin. Therecreational fleet included out-of-towners aswell as locals. Retirees, school teachers andothers would trailer their salmon boats to theharbor and stay for weeks or the entire summerto fish. Some even bought commercial licensesto be able to land more fish and offset theirexpenses. Many stayed at local RV parks atthe harbor or elsewhere in town. A distinctiveculture associated with this fishery grewover time, as participants returned year afteryear and built strong social networks in thecommunity.After the implementation of limited entryin 1982, which made commercial fishinguntenable for many part time fishermen,activity dropped. Subsequent sharp reductionsin the length of the KMZ commercial salmonseason led to economic and social losses(PFMC 1985). Some fishing communitymembers remarked that for <strong>Crescent</strong> <strong>City</strong> thesalmon disaster occurred not in 2006 or 2008as noted in statewide news, but rather in 1985when the KMZ was first closed for the season.In response to the changes of the early 1980s,those who remained in the fishery shiftedtheir effort south or north of the KMZ, wherethe salmon fishing season remained openconsiderably longer. Others shifted their effortto other fisheries such as groundfish, shrimp orcrab. Many others left fishing altogether. Thisloss of fishing activity led to reduced demandfor goods and services and reduced revenuesfor fishery-support businesses including gearsupply stores, fuel and ice providers, RV parksand motels that housed visiting fishermenand their families, and others. In addition, itsignaled a change in community relationshipsand identity that had been largely shaped bythe bustling summer salmon season.A major change occurred in the recreationalfishery in 1992, when the season in the<strong>California</strong> KMZ was cut from more thanfour months to 14 days. According to studyparticipants, the 14-day season was a disasterfor fishery participants and the community. Atthat time, an estimated 400–600 sport fishingboats participated in the local summer salmonfishery, many of them coming from out oftown and staying for a month or more to fishdaily. According to one participant who thenran a local fishery-support business (whichsoon closed for lack of business), the numberof summer recreational fishery participantsdropped by about 50% in response to theclosure. From 1993 to 2007, the season rangedfrom 1.5 to 4 months, a notable improvementover 1992 but much shorter than the 4- to9-month seasons that prevailed prior to 1992.While <strong>Crescent</strong> <strong>City</strong> is subject to similarregulations as other KMZ ports such as<strong>Crescent</strong> <strong>City</strong> Fishing Community <strong>Profile</strong> 43
Eureka and Trinidad, the decline in its salmonfishery has been disproportionate relative tothe KMZ as a whole. For instance, during theperiod 1981–1983, <strong>Crescent</strong> <strong>City</strong> accountedfor an average of 34% of total salmon effort(angler days) and 30% of salmon landed inthe KMZ commercial fishery; by 2005–2007its contribution to total effort and landingsdropped to 7% and 11% respectively (PFMC1997, 2009). <strong>Crescent</strong> <strong>City</strong>’s contribution toeffort and landings in the KMZ recreationalfishery fell from 20% and 19% respectivelyduring the period 1981–1983 to 7% and 5%,respectively, by the period 2005–2007.As the fishing community was acclimating tonew rules in the ocean salmon fishery, otherevents induced further change in the system.The 1982–1983 El Niño had a dramaticeffect on many <strong>California</strong> fisheries includingsalmon, groundfish and shrimp (CDFG1984, 1985). Many <strong>Crescent</strong> <strong>City</strong> fisheryparticipants observed major ecosystem shiftssuch as changes in the distribution of certainrockfishes, decreases in the size of salmon, andthe scarcity of pink shrimp after several strongyears (Pearcy and Schoener 1987, Woodbury1999). In response to these ecological changes,fishermen shifted their effort to other morereadily available species. Many shrimpfishermen modified their trawlers and began totarget groundfish and/or shifted to crabbing. Asone participant noted:Virtually the entire West Coast shrimpfleet shifted in to the groundfish trawlfishery. Before 1982–83, there was ashrimp fleet and a groundfish fleet…when shrimp nearly disappeared dueto the El Niño, the two fleets becameindistinguishable.Contractions in commercial fishing activity,particularly with respect to the high-volumegroundfish and shrimp fisheries, have impactedlocal receiving and processing infrastructureas well as the harvesting sector. For example,Castle Rock <strong>Sea</strong>food, a local processor sincethe mid 1970s that was bought out by afishermen’s cooperative beginning in 1995,ceased operations in 1997. ConsolidatedFactors/<strong>Sea</strong> Products closed in 2000, and in2001 one of the largest processors on the WestCoast, Eureka Fisheries, ceased operations. 31Although these business closures cannot bedirectly linked to reductions in fishing activity,it stands to reason that reduced poundagegoing across the docks and into thesefacilities (paying for machinery, receiving andprocessing labor, wastewater treatment, andproduct distribution) had a substantial negativeimpact on the viability of those businesses.Economic Factors and ImpactsFor commercial and charter fishing operations,costs include fixed items such as vessels,gear and equipment (for navigation, safetyand maintaining the quality of the catch),slip fees, permit fees, insurance and generalvessel maintenance. They also include variable(operating) costs such as fuel, ice and otherprovisions, as well as crew. For recreationalfishery participants, fixed costs includemost of these items (except, for example,crew), although they tend to be considerablylower. Fish buyers and processors, supportbusinesses and the harbor likewise havefixed and variable costs including facilities,equipment, labor (and associated costs such asworkers’ compensation insurance), supplies,and maintenance, repair and services neededto keep their operations functioning safely andeffectively.Commercial FisheriesCommercial fishery participants and supportbusiness operators cited rising operating costs,especially those for gear, vessel maintenance,insurance and fuel, as among the biggestchallenges they are facing. One trawl fisheryparticipant reported (in May 2008), “We’re onreally tight margins, especially fuel. It used to<strong>Crescent</strong> <strong>City</strong> Fishing Community <strong>Profile</strong> 44
e about 7% of gross, now it’s 26%...but thefish price is just the same.” Another participantcommented, “Fuel has gone from $0.85 agallon to $4.05 a gallon, and the price of fishis not keeping up. The high fuel cost meansyou really can’t scratch [go looking for fish].The cost used to be time; now you go into thered. You don’t take the risks.” According to thePacific States Marine Fisheries Commission’s(PSMFC) annual West Coast Marine Fuel PriceSurvey, average pretax fuel prices at Northern<strong>California</strong> ports increased more than threefoldfrom $1.00 per gallon in December 1999to $3.19 in December 2007, and about 21%between January and December 2007 (PSMFC2000, 2008).At the same time, many commercial fishermencommented on stagnant or declining pricesin several fisheries. Our analysis comparingaverage annual prices for the recent term andthe long term suggests this is indeed the casefor the shrimp trawl (-33%), albacore (-21%),whiting (-13%), crab (-11%) and shrimp pot(-7%) fisheries. In the shrimp and whitingtrawl fisheries, market competition was citedas a cause of the decline. Study participantscited, for example, competition with Canadianshrimp beginning in the early 1990s. Thedrop in crab prices may be attributed to thesubstantial growth in crab production with themajority of landings still being purchased forthe lower price cooked (rather than live) crabmarket.At the same time, prices have increased forsome fisheries, including rockfish hook-andline(+82%), salmon (+13%), and groundfishtrawl (+5%). 32 The price increase for rockfishis likely due to the growth in markets anddistribution channels for live product in theSan Francisco Bay area. Salmon troll priceshave increased in years following a longperiod of decline, which has been attributed tothe growing supply and popularity of farmedsalmon in both domestic and internationalmarkets (Sylvia et al. 1998). Recent priceincreases may be attributed to the developmentof localized niche markets for wild (versusfarmed) salmon.Fish buyers and processors raised similarconcerns about rising costs, including thosefor utilities (power and sewer) and laborrelatedcosts (such as workers’ compensationinsurance), especially compared to nearbyOregon ports where state and local laws differ.Several discussed the problems posed by theharbor’s wastewater treatment plant, notingthe ongoing issues with its operation and highcosts, and its effects on harbor operationsand opportunities for seafood processing at<strong>Crescent</strong> <strong>City</strong>.Increasing costs and less favorable economicconditions also have affected fishery-supportbusinesses, both directly and indirectly. Thereduction in fishing opportunities and activityhas resulted in reduced demand for goods andservices that these businesses provide. A keyfishery-support business, Englund Marine, hasexperienced reduced demand for salmon andgroundfish gear and increased demand for crabgear, as well as a general shift toward morerecreational (salt and freshwater) business:We used to sell primarily commercialsalmon troll gear. We used to havea big bait freezer, but no longer. Inthe early 1990s, we started sellingmore sport gear….In earlier days itwas probably 60/40 commercial torecreational (inventory). Now it’s morelike 70% recreational inventory. We’vecompletely restructured the store in thelast year to adapt to the changes.As local fisheries expanded in the 1980s, ashaved ice plant was built on Citizens Dockto supplement local block ice production tomeet the growing demand from shrimp andgroundfish trawlers. Both plants operated<strong>Crescent</strong> <strong>City</strong> Fishing Community <strong>Profile</strong> 45
from 1987 until 1994, when the block iceplant closed. Since then, only the CitizensDock plant, operated by Pacific Choice<strong>Sea</strong>food since 2003, has provided ice for saleto the public. However, the groundfish trawlbuyback has affected the ice plant, which hasreduced its staff and operations following asharp reduction in demand: “The ice housewas a two-person job. I’d work 10 pm tosunrise, and the other guy would take over.Now it’s open 8 to 6 and there are hardly anycustomers.…We’re lucky to sell 50 tons ina month.” The remaining trawlers and otherfishery participants need ice for their fishingoperations, and are concerned about the plant’slong-term viability.Shifting demand and markets for seafoodalso have influenced <strong>Crescent</strong> <strong>City</strong> fisheries,especially those for pink shrimp, live fish,coonstripe shrimp, and crab. Technologicalchanges in the 1960s and 1970s affordedeconomies of scale in the pink shrimp fishery,increased production and expanded access tomarkets. After recovering from the 1982–1983El Niño, the fishery grew again until the early1990s when prices dropped due to competitionfrom Canadian shrimp. In response, <strong>Crescent</strong><strong>City</strong> fishermen report that they shifted effort tothe groundfish and crab fisheries. According toone participant:Dragging picked up in the late 1990sbecause the shrimp market went down.In years where shrimp were abundantand the price was good, draggerswould shrimp. When the shrimpmarket went down, they switched overto dragging. You could lease a trawlpermit if you didn’t have one.Even as the price for pink shrimp declined,demand for live seafood – including rockfishand other groundfish species, coonstripeshrimp and crab – grew. Some studyparticipants suggested that the arrival ofVietnamese refugees in the late 1970s and1980s, followed by more general growth inthe San Francisco Bay area Asian population,was a driving force behind the emergence ofthe live rockfish fishery. The live fish fishery,which had begun in Southern <strong>California</strong> inthe late 1980s, had spread north and into the<strong>Crescent</strong> <strong>City</strong> area by 1999. Hook-and-linefishermen who had been supplying the localand regional filet fish market found theycould earn several times more per pound forlive rockfish. In the early years of the livefish fishery at <strong>Crescent</strong> <strong>City</strong>, Bay area buyerswould travel to <strong>Crescent</strong> <strong>City</strong> to buy thefish off the boats. A small group of <strong>Crescent</strong><strong>City</strong> fishermen worked together through acooperative to market their catch, althoughthe group disbanded after about a year. Atpresent, two resident buyers handle some ofthe catch, and a few local fishermen transporttheir catch to Bay area wholesalers, restaurantsand markets. Although the coonstripe shrimpfishery involves a different group of localfishermen, that group similarly took advantageof the growing Bay area demand for liveseafood.The market for live crab has grown as well.Historically, the fishery was directed primarilytoward the production of whole and sectionedcooked crab for institutional food service andother similar high volume uses. In the early2000s, however, the demand for fresh, livecrab increased. Although the majority of crablanded at <strong>Crescent</strong> <strong>City</strong> still is processed,study participants report that the live markethas put some upward pressure on ex-vesselprices and accommodated production after thefirst month of the season, when 80% of thenorthern <strong>California</strong> catch is typically landed(Leet et al. 2001). (The ex-vessel price for livecrab is about twice that for processed crab;although demand is smaller, it lasts well intothe season.)<strong>Crescent</strong> <strong>City</strong> Fishing Community <strong>Profile</strong> 46
Finally, the local demand for seafood at<strong>Crescent</strong> <strong>City</strong> has influenced and been affectedby local fisheries. Some locally caught seafoodhas been sold via off-the-boat and other directsales by fishermen, a local vendor (Lucy’s<strong>Sea</strong>food) during crab season and, through the1990s until it closed, by Eureka Fisheries atthe harbor. However, local demand for freshcommercially caught seafood has been limitedbecause of <strong>Crescent</strong> <strong>City</strong>’s small population,isolation from larger urban centers (and“limited foot traffic,” as one participant noted),and the tendency of many residents to catchtheir own seafood.Recreational FisheriesRecreational fishery participants highlightedthe general economic downturn for itsdampening effect on <strong>Crescent</strong> <strong>City</strong>’srecreational fisheries over the past severalyears. They also cited rapidly rising fuelprices at the time of the study, noting thatthey and other recreational fishermen were“carpooling,” with two or more anglers fishingfrom one boat to share fuel costs. In addition,<strong>Crescent</strong> <strong>City</strong> Harbor increasingly competeswith the port of Brookings, Oregon, wherefewer restrictions, lower fuel prices and theabsence of sales tax reportedly have attractedsome anglers who used to fish out of <strong>Crescent</strong><strong>City</strong>.Among fishery-support businesses orientedtoward recreational fisheries, several havefaced challenges as fishing opportunities havechanged. One former business owner discussedthe impacts of the Klamath-driven recreationalsalmon fishery cutbacks of the early 1990s. Inthe late 1980s, the recreational ocean fisherywas very active. Local recreational fisherysupport businesses were thriving, with recordgear sales and other activity: “The launchramp between Fashion Blacksmith and theharbor was backed up. Folks came fromRedding, Anderson, Cotton, Fresno...They’dspend the winter in Yuma and the summer in<strong>Crescent</strong> <strong>City</strong>.” When the fishery was sharplycurtailed in 1991, however, “Recreationalfishermen left in droves. The harbor had aplan to build 500 more slips…It was a blowto the entire community.” Over the nextfew years, as recreational fishing activity atthe harbor continued to decline, many localfishery-support businesses closed or shiftedtheir focus to be less dependent on recreationalfishing activity. However, in recent yearssome businesses have begun to carry morerecreational gear to make up for a decline incommercial activity.The recent economic downturn coupled withdeclining local fishing opportunities is evidentas well. For example, one of the local RV parkshas experienced a shift from primarily seasonal(summer) recreational fishing enthusiasts toyear-round nonfishing residents. According tothe owner:Fishing was great up until the late1980s. We were full with recreationalfishing folks. It’s really the last threeto four years that we began taking inother users. The regulars [who camefor the fishing season] would fight overspaces….The fishermen are runninglate this year [2008, with the statewidesalmon closure]. Usually, they’rehere by mid May. I’ve received 30reservations for the summer; not manyof them are fishermen.<strong>Crescent</strong> <strong>City</strong> Fishing Community <strong>Profile</strong> 47
The Harbor DistrictAs fishing activity has declined over the last30 years, so has the harbor’s revenue base.Revenue sources include income from sliprentals and related services, fees for offloadingcommercially-caught fish and ice and fuelsales, and rent from other concessions (RRMDesign Group 2006). In addition, the harbordistrict receives County property taxes(although these have been appropriated in partby the state in recent years) and various loansand grants from federal and state governmentagencies. At the same time, operating costshave become significant, particularly withrespect to dredging the harbor channelsand removing tailings, and maintaining andoperating the wastewater treatment plant,which is required for fish processing. Inaddition, according to Harbormaster RichardYoung, historically the harbor district madelittle or no provision for basic maintenanceand repair of the docks or their replacement.As a result, these costs have grown. Harborfacilities also need to be brought up to code tomeet Americans with Disabilities Act and otherrequirements, which add to their cost (RRMDesign Group 2006, Madar 2009a).DredgingAs with most <strong>California</strong> harbors, access intoand out of <strong>Crescent</strong> <strong>City</strong> Harbor depends onmaintenance dredging of its navigable channelsand boat basins. The biggest obstacle to dredgingthe harbor has been adequate funding, for boththe removal of dredged materials (spoils ortailings) and their disposal. The estimated costto dredge the federal channel and the inner boatbasin is $2–$3 million. Like most other harborsin <strong>California</strong>, <strong>Crescent</strong> <strong>City</strong> Harbor depends onCongressional appropriations to allocate funds tothe Army Corps of Engineers for the work.Over the past decade, the harbor has beendredged irregularly, once in 2000 and again in2009 after conditions became critical. Portionsof the federal navigation channel had depths asshallow as two feet, where they are supposedto be at least 15 feet deep (Madar 2009b). As aresult, most vessels had to wait for high tide toenter or leave the harbor, creating safety issues aswell as economic costs.A second obstacle has been securing a site forthe disposal of dredged materials. For manyyears, <strong>Crescent</strong> <strong>City</strong> Harbor had access to anoffshore disposal site. Following the closureof that site, the tailings were dried at its 5.3-acre dewatering site, then transported to theDel Norte County landfill. With the dewateringponds full and the landfill closed to newmaterials, finding a cost-effective disposal sitehas posed a significant challenge. Recently,however, about three acres of Del Norte SolidWaste Management Authority excavationareas have been suggested as a possible dredgematerials disposal site (Madar 2009c).The November 2006 tsunami exacerbatedshoaling and damaged the inner boat basin,especially G- and H-docks, where 35 slipswere lost (Ma 2008). Although the initialassessment estimated repair costs at about$5 million, subsequent investigations haveestimated that as much as $25.4 million may beneeded to repair the tsunami damage and bringthe inner boat basin up to code (Ma 2008).State and federal funds may be available for upto 75% of the cost, with local (harbor, city and/or county) funds required for the remainder.In June 2009, the harbor received a $5 millionCommunity Development Block <strong>Grant</strong> for thematch (Madar 2009a). 33Wastewater Treatment PlantIn 1992, <strong>Crescent</strong> <strong>City</strong> was awarded a federalgrant to build a wastewater treatment plant,with the goal of accommodating up to fiveprocessing plants or 800,000 gallons of waterper day. When the plant went online in 1993,three fish processing plants used it to pretreatwaste from their operations, especially thosefor shrimp and groundfish. Due to a design<strong>Crescent</strong> <strong>City</strong> Fishing Community <strong>Profile</strong> 48
flaw, the plant produced strong odors thatresulted in complaints from nearby businessowners and residents. Eventually the problemwas fixed. However, the cost of operating theplant became so great that in 1997, the <strong>City</strong>Council threatened to shut it down until afinancial solution could be found. In 1998, theharbor district took possession of the plant,and resumed operations. By 2001, however,all three processors had gone out of business,due in part to high operating costs, includingthose associated with the wastewater treatmentplant. Currently the one resident processor usesthe wastewater treatment plant only during theheight of the crab season (two to three monthsin the winter) and whiting season (two weeksin late spring). Operating costs continue to beextremely high, totaling an estimated $110,000per year (RRM Design Group 2006, Durkee2008). These high costs and other issuesassociated with the plant have limited seafoodprocessing and, according to some studyparticipants, deterred other processors fromestablishing operations in the area.Taken together, these factors have put asubstantial financial strain on the harbor,particularly since its revenue has declinedin recent years. The harbor district operatedunder a deficit beginning in fiscal year (FY)1995–1996 (RRM Design Group 2006). Thedistrict relied on property taxes to cover thisdeficit, however these funds were insufficient,and the harbor district had significant debtuntil FY 2006–2007, when it showed a netprofit of about $230,000 (<strong>Crescent</strong> <strong>City</strong> HarborDistrict 2008). In 2008, the harbor districtimposed additional fees on fish processors,raised mooring rates, and increased servicecharges and rents to reflect actual costs andmatch market rates (Young 2008). For FY2008–2009, harbor staff projected a deficit of$60,000, and expected cash reserves to coverthe shortfall (<strong>Crescent</strong> <strong>City</strong> Harbor District2008).<strong>Crescent</strong> <strong>City</strong> Fishing Community <strong>Profile</strong> 49
Current Situation and Outlook<strong>Crescent</strong> <strong>City</strong> Harbor’s fishing community facescritical challenges as it continues to adjust toregulatory, economic and environmental change.Once highly engaged in a diversity of commercialand recreational fisheries, the fishing communityhas become particularly dependent on thecommercial crab fishery, which is vulnerable tofluctuations in resource availability and, to a lesserextent, markets. Salmon troll and groundfish andshrimp trawl activity at the port have been sharplycurtailed. Recreational fisheries, once highlydependent on salmon, now engage perhaps a tenththe number of anglers they did in the 1980s. Othersport fisheries for crab and groundfish continue, buthave not filled the void left by salmon.The reduction in fishing opportunities and activityhave, in turn, reduced shoreside activity andassociated revenues, which have been felt byfishery support businesses and the harbor itself.Moreover, because activity at the port is nowhighly concentrated during the winter crab seasonrather than spread throughout the year, manybusinesses, from fish buyers and processors tomarine supply stores, have had trouble maintaininga consistent labor force and income flow. Thesesame circumstances make it difficult for fishingoperations to retain crew and maintain their vessels.Several businesses have closed or reduced servicesand/or inventory, while others have adaptedby diversifying their operations. With limitedalternative sources of revenue, harbor infrastructureincluding docks and other shoreside facilities, onceconsidered state-of-the-art, have deteriorated.Current issues for the fishing community includethe implementation of marine protected areas(MPAs) through the state’s ongoing MLPA process(in which several community members are activelyengaged), and an individual quota program (IQ) forthe federal groundfish trawl fishery. Both of thesehave the potential to fundamentally change localfisheries and the community. Study participantsexpressed concerns about the MLPA process andits potential outcomes, especially reduced access tomarine resources and increased safety risks. Theynoted that expectations about future MPAs havealready created substantial unease in the community,and have affected choices related to investment innew boats, shoreside facilities and equipment. Inaddition, considerable uncertainty exists regardingthe trawl IQ program, which is “intended to increaseeconomic efficiency within the fishery and reducethe incidental catch of overfished groundfishspecies” (PFMC and NMFS 2010). However,some fishery participants are concerned that limitedinitial quota allocations for nontarget species willsubstantially reduce their fishing activity, withnegative economic impacts on their operations andthe community.Taken together, these circumstances may underminethe viability and well-being of the <strong>Crescent</strong><strong>City</strong> fishing community and the harbor. Thesituation is exacerbated by its isolation from largerpopulation centers, and limited alternatives for localemployment and community livelihood.At the same time, the <strong>Crescent</strong> <strong>City</strong> communityhas a well-established history of adapting tochange that may enable it to meet challenges ina constructive way. Community members havelong worked together to support the harbor and itsfisheries, as occurred with the building of CitizensDock and its reconstruction following the 1964tsunami. Recently, funds have been secured tobegin much-needed dredging of the harbor’smain navigation channel, and additional funds tosupport reconstruction of the inner basin and otherimprovements are pending. These efforts togetherwith the port’s location near rich fishing grounds,its safe and easy access, and the availability of keyservices (e.g., fuel, ice, haul-out, refuge) create thepotential for <strong>Crescent</strong> <strong>City</strong> to regain its resilienceand vitality as a fishing port.<strong>Crescent</strong> <strong>City</strong> Fishing Community <strong>Profile</strong> 50
ReferencesAnon. 1976. <strong>Crescent</strong> Harbor, Key Factor to Del Norte, Would cost $50 if Built Today. Del NorteTriplicate. <strong>Crescent</strong> <strong>City</strong>, CA:1.Bertão, D. E. 2006. The Portuguese Shore Whalers of <strong>California</strong>: 1854-1904. San Jose, CA:Portuguese Heritage Publications of <strong>California</strong>, Inc.CDFG. 1984. Review of some <strong>California</strong> fisheries for 1983. CalCOFI Reports 25:7-15.CDFG. 1985. Review of some <strong>California</strong> fisheries for 1984. CalCOFI Reports 26:9-16.CDFG. 2007. Information Concerning the Pink Shrimp Trawl Fishery off Northern <strong>California</strong>.<strong>California</strong> Department of Fish and Game.<strong>California</strong> Dungeness Crab Task Force. 2010. Report #2: Recommendations from the <strong>California</strong>Dungeness Crab Task Force regarding management of the fishery in accordance with SB1690. <strong>California</strong> Ocean Protection Council: Oakland, CA, 17 p.<strong>Crescent</strong> <strong>City</strong> Harbor District. 2008. Minutes of the Regular Session of the Board of HarborCommissioners of the <strong>Crescent</strong> <strong>City</strong> Harbor. <strong>Crescent</strong> <strong>City</strong> Harbor District: <strong>Crescent</strong> <strong>City</strong>,CA.Dewees, C. M. 1976. The farm credit system: A new source of fishery loans. Davis, CA:<strong>California</strong> <strong>Sea</strong> <strong>Grant</strong> Extension Program. 2 p.Durkee, M. C. 2008. Alber, gallery may stay in harbor. The Daily Triplicate. <strong>Crescent</strong> <strong>City</strong>, CA,September 5.Eureka Fisheries. 1992. Eureka Fisheries, Inc: Reaping a Harvest from the <strong>Sea</strong>.Federal Register. 2003. Magnuson-Stevens Act Provisions; Fishing Capacity Reduction Program;Pacific Coast Groundfish Fishery; <strong>California</strong>, Washington, and Oregon Fisheries for CoastalDungeness Crab and Pink Shrimp. Department of Commerce. 62435-62440, http://edocket.access.gpo.gov/2003/pdf/03-27712.pdf.Feinberg, L. and T. Morgan. 1980. <strong>California</strong>’s Salmon Resource, Its Biology, Use andManagement. La Jolla, CA: <strong>California</strong> <strong>Sea</strong> <strong>Grant</strong> College Program.Frimodig, A., M. Horeczko, M. Prall, T. Mason, B. Owens and S. Wertz. 2009. Review of the<strong>California</strong> Trawl Fishery for Pacific Ocean Shrimp, Pandalus jordani, from 1992 to 2007.Marine Fisheries Review 71 (2): 1-14.Hankin, D., R. Warner, W. Leet, C. Dewees, R. Klingbeil and E. Larson. 2001. Dungeness crab.pp. 107-111 in <strong>California</strong>’s Living Marine Resources: A Status Report. W. Leet, C. Dewees,R. Klingbeil and E. Larson, Eds. Sacramento, CA: <strong>California</strong> Department of Fish and Game.Helser, T. E., I. J. Stewart and O. S. Hamel. 2008. Stock Assessment of Pacific Hake (Whiting) inU.S. and Canadian Waters in 2008. Pacific Fishery Management Council, Stock Assessmentand Fishery Evaluation (SAFE). Agenda Item F.3.a. PFMC: Portland, OR, 128 p.Leet, W. S., C. M. Dewees, R. Klingbeil and E. J. Larson, Eds. 2001. <strong>California</strong>’s Living MarineResources: A Status Report. Sacramento, CA. CDFG.<strong>Crescent</strong> <strong>City</strong> Fishing Community <strong>Profile</strong> 51
Leidersdorf, C. 1975. Development of <strong>Crescent</strong> <strong>City</strong> Harbor, <strong>California</strong> University of <strong>California</strong>,Berkeley, Berkeley, 42 p.Ma, M. 2008. House bill includes dredging money The Daily Triplicate. <strong>Crescent</strong> <strong>City</strong>, CA, June28:A1.Madar, K. 2009a. Fishermen, firms help harbor: Effort to obtain $5 million grant gets a big boost.The Daily Triplicate. <strong>Crescent</strong> <strong>City</strong>, CA, March 21:2.Madar, K. 2009b. Harbor channel to get deeper. The Daily Triplicate. <strong>Crescent</strong> <strong>City</strong>, CA, April22.Madar, K. 2009c. Local site possible for dredged silt. The Daily Triplicate. <strong>Crescent</strong> <strong>City</strong>, CA,April 10.McEvoy, A. M. 1986. The Fisherman’s Problem: Ecology and Law in the <strong>California</strong> Fisheries,1850-1980. Cambridge, England: Cambridge University Press.McKee-Lewis, K. K. 1996. Rapid changes and growth of <strong>California</strong>’s live finfish fishery.Marketing and shipping live aquatic products: Proceedings from Marketing and ShippingLive Aquatic Products. <strong>Sea</strong>ttle, WA.National Park Service. 2009a. Battery Point (<strong>Crescent</strong> <strong>City</strong>) Light. Inventory of Historic LightStations http://www.nps.gov/history/maritime/light/battery.htm, September 21National Park Service. 2009b. St. George Reef Light. Inventory of Historic Light Stations http://www.nps.gov/maritime/light/stgeo.htm, September 21.NOAA. 1999. Federal Fisheries Investment Task Force Report to Congress. National Oceanicand Atmospheric Administration.Norman, K., J. Sepez, H. Lazrus, N. Milne, C. Package, S. Russell, K. <strong>Grant</strong>, R. P. Lewis, J.Primo, E. Springer, M. Styles, B. Tilt and I. Vaccaro. 2007. Community <strong>Profile</strong>s for WestCoast and North Pacific Fisheries: Washington, Oregon, <strong>California</strong>, and Other U.S. States.NMFS Northwest Fisheries Science Center <strong>Sea</strong>ttle, WA, 602 p., http://www.nwfsc.noaa.gov/assets/25/6718_01082008_153910_Community<strong>Profile</strong>sTM85WebFinalSA.pdf.Pearcy, W. G. and A. Schoener. 1987. Changes in the marine biota coincident with the 1982-1983El Niño in the northeastern Subarctic Pacific Ocean. Journal of Geophysical Research 92:14417-14428.PFMC. 1985. 1985 Ocean Salmon Fisheries Stock Status Projections, Management Goals andRegulation Impact Analysis. Pacific Fishery Management Council, Salmon Plan TechnicalTeam: Portland, OR.PFMC. 1994. Review of 1993 Ocean Salmon Fisheries. PFMC: Portland, OR, 294 p.PFMC. 1997. Review of 1996 Ocean Salmon Fisheries. PFMC: Portland, OR.PFMC. 1992. Oregon Coastal Natural coho review team report. PFMC: Portland, OR, 25 p.PFMC. 2005. Review of 2004 Ocean Salmon Fisheries: Appendix C: Historical Record of OceanSalmon Fishery Regulations and a Chronology of 2004 Events. PFMC: Portland, OR, http://www.pcouncil.org/wp-content/uploads/apdxc_04.pdf.<strong>Crescent</strong> <strong>City</strong> Fishing Community <strong>Profile</strong> 52
PFMC. 2008. Pacific Coast Groundfish Fishery Management for the <strong>California</strong>, Oregon,Washington Groundfish Fishery, as Amended Through Amendment 19, IncludingAmendment 15. PFMC: Portland, OR.PFMC. 2009. Review of 2008 Ocean Salmon Fisheries: Appendix C: Ocean Salmon FisheryRegulations and Chronology of Events. PFMC: Portland, OR.PFMC and NMFS. 2010. Rationalization of the Pacific Coast groundfish limited entry trawlfishery, Amendment 20, Implementation, WA, OR and CA. Final Environmental ImpactStatement. EIS No. 2010027. NOAA: Portland, OR, 703 p., http://www.pcouncil.org/groundfish/fishery-management-plan/fmp-amendment-20/.Pierce, R. M. 1998. Klamath Salmon: Understanding Allocation. Klamath River Basin FisheriesTask Force, U.S. Fish and Wildlife Service Yreka, CA, 34 p.Powers, D. M. 2005. The Raging <strong>Sea</strong>: The Powerful Account of the Worst Tsunami in U.S.History. New York: Citadel Press.PSMFC. 2000. 1999 Marine Fuel Price Summary. Fisheries Economics Data Program, EFIN,PSMFC: Portland, OR, http://www.psmfc.org/efin/docs/1999FuelPriceReport.pdf.PSMFC. 2008. West Coast and Alaska Marine Fuel Prices 2005-2007 Economic FisheriesInformation Network (EFIN), PSMFC: Portland, OR, http://www.psmfc.org/efin/docs/2007FuelPriceReport.pdf.Ralston, S. 2002. West Coast groundfish harvest policy. North American Journal of FisheriesManagement 22(1): 249-50.RRM Design Group. 2006. <strong>Crescent</strong> <strong>City</strong> Harbor Master Plan. <strong>Crescent</strong> <strong>City</strong> Harbor District:101 Citizens Dock Road, <strong>Crescent</strong> <strong>City</strong>, CA 95531, 118 p.Scofield, W. L. 1954. <strong>California</strong> Fishing Ports. Fish Bulletin 96. http://content.cdlib.org/view?docId=kt667nb1cg&brand=calisphere&doc.view=entire_text.Starks, E. C. 1923. A History of <strong>California</strong> Shore Whaling. <strong>California</strong> Fish And GameCommission Fish Bulletin 6. http://content.cdlib.org/xtf/view?docId=kt7t1nb2f7&brand=calisphere&doc.view=entire_text.Starr, R. M., J. M. Cope, and L. A. Kerr. 2002. Trends in Fisheries and Fishery ResourcesAssociated with the Monterey Bay National Marine Sanctuary From 1981-2000. PublicationNo. T-046, <strong>California</strong> <strong>Sea</strong> <strong>Grant</strong> College Program, La Jolla, <strong>California</strong>.Sylvia, G., M. T. Morrissey, T. Graham and S. Garcia. 1998. Changing trends in seafood markets:The case of farmed and wild salmon. Journal of Food Products Marketing 3(2):49-63.Trice, A. H. 1960. <strong>Crescent</strong> <strong>City</strong> Harbor District, <strong>Crescent</strong> <strong>City</strong>, CA: Feasibility of ProposedAdditions to Citizens Dock. Economic and Marketing Research Consulting Services:Sacramento, CA, 50 p.Waldvogel, J. 1992. Klamath Management Zone Ocean Salmon Sport Fishermen Survey.UCSGEP 92-3. <strong>California</strong> <strong>Sea</strong> <strong>Grant</strong> Extension Program: 19 p.<strong>Crescent</strong> <strong>City</strong> Fishing Community <strong>Profile</strong> 53
Woodbury, D. 1999. Reduction of growth in otoliths of widow and yellowtail rockfish (Sebastesentomelas and S. flavidus) during the 1983 El Niño. Fishery Bulletin 97: 680-89.Young, R. 2008. Letters: Harbor District is taking fair and necessary action. The Daily Triplicate.<strong>Crescent</strong> <strong>City</strong>, CA, October 30.<strong>Crescent</strong> <strong>City</strong> Fishing Community <strong>Profile</strong> 54
Endnotes1http://www.crescentcity.org, accessed 6/1/09.2Shore-based ocean, inland and river fisheries, clam digging and other collecting activities - bothtribal and nontribal - are also integral to the community and the region, but are beyond thescope of this report.3See Appendix C for methodological detail.4Data sources include the Pacific Fisheries Information Network (PacFIN) database, the<strong>California</strong> Recreational Fisheries Survey (CRFS) and Commercial Passenger FishingVessel (CPFV) logbooks.5The Battery Point Lighthouse was deactivated in 1965 and re-activated in 1982; the St. GeorgeReef Lighthouse was deactivated in 1975, and reactivated in 2002 (National Park Service2009a, b).6According to Trice (1960), the fish companies at that time included <strong>California</strong> ShellfishCompany, Paladini Fish Company, Tom Lazio Fish Company, and West Coast CrabCompany. Hallmark Fisheries and Meredith <strong>Sea</strong>food also operated at <strong>Crescent</strong> <strong>City</strong> aroundthat time.7See Appendix B for a glossary with definitions of this and other key terms used throughout thisreport.8http://www.dbw.ca.gov/PDF/Legis_Districts/Senate/SenDist04.pdf, accessed 6/11/10.9There was a fine line between the recreational and commercial fleets at this time, as manysummer salmon anglers would purchase a commercial license to enable them to catch morefish and/or sell some of their catch to offset expenses.10The tribal allocation was upheld in Parravano v. Babbitt, 70 F.3d 539 (9th Cir. 1995), cert.denied, 518 US. 1016 (1996).11The ‘spawner escapement floor’ is the minimum number of fish that are required to arrive at anatal stream or river to spawn, as identified in a management process.12See Ralston (2002) for a discussion of the biology of West Coast groundfish and how growingunderstanding of that biology affected PFMC management.13Pacific ocean perch, bocaccio and lingcod were declared overfished in 1999, canary rockfishand cowcod in 2000, darkblotched and widow rockfish in 2001, and yelloweye rockfish in2002. Lingcod was declared rebuilt in 2005.14Vessel monitoring systems are electronic transmitters placed on fishing vessels that transmitinformation about a vessel’s position to enforcement agencies via satellite to determine, forexample, whether a vessel is in a closed area (http://www.pcouncil.org/groundfish/gfvms.html, accessed 12/7/09).15http://www.dfg.ca.gov/licensing/pdffiles/cf_items_10yr.pdf, 4/30/10, accessed 6/4/10; http://www.dfg.ca.gov/licensing/commfishbus/nearshoreprovisions.html, accessed 6/4/10.<strong>Crescent</strong> <strong>City</strong> Fishing Community <strong>Profile</strong> 55
16Although the trawl fishery for whiting is managed under the Groundfish FMP, it is a distinctfishery in many respects, and is discussed separately.17See Leet et al. 2001 and Starr et al. 2002 for descriptions of these fisheries and gear types.18A second charter, Golden Bear Fishing Charters, also operates out of <strong>Crescent</strong> <strong>City</strong>; however,information was not available during fieldwork for this project.19The 1981 start date for this analysis is based on the availability the Pacific States MarineFisheries Commission’s (PSMFC) PacFIN database, which integrates Washington, Oregonand <strong>California</strong> commercial fishery landings data to provide a consistent coast-wideelectronic record of landings from 1981 forward. The PacFIN data for <strong>California</strong> are basedon the C-MASTER data provided by CDFG to the PSMFC.20Throughout we abbreviate the names of these fisheries as follows: albacore for albacoretroll, coonstripe shrimp for coonstripe shrimp pot, crab for crab pot, groundfish trawl fornonwhiting groundfish trawl, rockfish for rockfish/lingcod hook-and-line/pot, sablefish forsablefish hook-and-line/pot, salmon for salmon troll, and whiting for whiting trawl.21Because multiple species may be caught during a fishing trip, trips are measured by assigningeach delivery to the fishery accounting for the greatest (i.e., plurality of) ex-vessel valueassociated with that delivery. In some cases, fishing for particular combinations of speciesand/or using multiple gear types on a single trip is prohibited.22Note that crab season straddles the calendar year (December through July), and most landingsoccur within the first one to two months of the season (Hankin et al. 2001). As a result,activity reported for a given year may not correspond to that of a season, per se. Weanalyzed the data by calendar year for consistency with analyses for other fisheries, mostof which have seasons that lie within the calendar year.23In 2005, to prevent a recurrence of this situation, the state of Oregon prohibited fishermenfrom delivering fish caught off the Oregon coast to buyers in <strong>California</strong> without an Oregonreceiver’s license.24Because groundfish are taken as bycatch in the fishery, the shrimp trawl fishery is subject tofederal groundfish regulations as well (Frimodig et al. 2009).25Because the fishery did not begin until 1992, the averages reported are only for the 17-yearperiod (1992-2007).26The U.S. whiting fishery mostly occurs off Oregon and Washington and is conducted byfishermen in the shore-based, mothership, tribal, and catcher-processor sectors (Helser etal. 2008).27This is an area for further economic research. Many fishery participants alluded to muchhigher operating costs; however, we were unable to collect detailed expenditure data todemonstrate this.28Port-specific catch and effort estimates for the albacore and crab fisheries are not available.29Initiated by the state in 2004, the CRFS provides comprehensive estimates of effort and catchfor all recreational fishing modes and species. (Modes are the locations/facilities anglersfish from, and include: “manmade” structures, beaches and banks, CPFVs or charter boats,and private boats.)<strong>Crescent</strong> <strong>City</strong> Fishing Community <strong>Profile</strong> 56
30An ‘angler trip’ is defined as one angler spending part or all of one or more days fishing beforereturning to the location where the trip began. An ‘angler day’ is defined as one person’sfishing on a given day. For example, two anglers each fishing for three days counts as sixangler days.31Pacific Choice <strong>Sea</strong>food, based in Portland Oregon, currently leases the former EurekaFisheries facilities in <strong>Crescent</strong> <strong>City</strong>.32Differential prices among groundfish (including rockfish) species can mask changes in themake-up and profitability of the fishery.33As part of the grant application process, in early 2009, the harbor collected information fromcommercial fishermen and support businesses to demonstrate that at least 144 jobs aredependent on the inner boat basin (Madar 2009a).<strong>Crescent</strong> <strong>City</strong> Fishing Community <strong>Profile</strong> 57