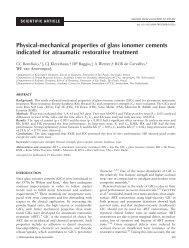
Physical-mechanical properties of glass ionomer cements indicated ...
Physical-mechanical properties of glass ionomer cements indicated ...
Physical-mechanical properties of glass ionomer cements indicated ...

You also want an ePaper? Increase the reach of your titles
YUMPU automatically turns print PDFs into web optimized ePapers that Google loves.
hole was filled with a small excess <strong>of</strong> cement and after<br />
10 minutes the specimens were stored in paraffin for<br />
24 hours at 37°C. 17 Prior to testing, the specimens were<br />
polished with 1200 grit paper (Buehler) until the excess<br />
was removed. Five indentations were taken in two<br />
specimens (n = 10).<br />
Two-way ANOVA and Tukey post hoc tests (p =<br />
0.05) were used to test differences in wear <strong>of</strong> the GICs<br />
and the effect <strong>of</strong> time. The flexural strength, compressive<br />
strength and Knoop microhardness were analysed<br />
with one-way ANOVA. Regression analysis was used in<br />
order to find the explanatory power (r 2 ) <strong>of</strong> each tested<br />
<strong>properties</strong> over another. The s<strong>of</strong>tware used was Sigma<br />
Stat 3.1 (SPSS Inc., Chicago, USA).<br />
RESULTS<br />
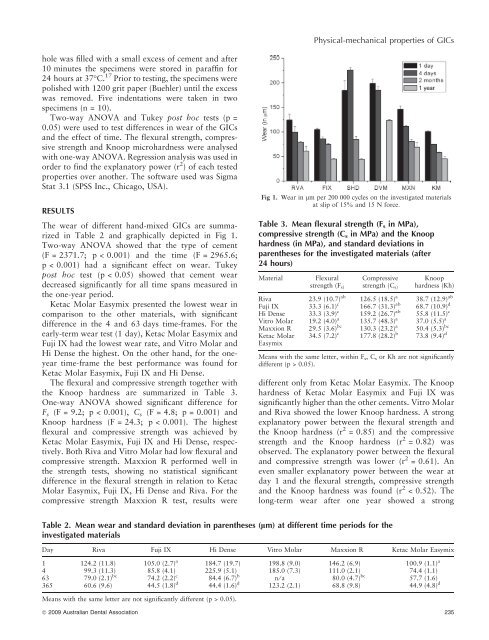
The wear <strong>of</strong> different hand-mixed GICs are summarized<br />
in Table 2 and graphically depicted in Fig 1.<br />
Two-way ANOVA showed that the type <strong>of</strong> cement<br />
(F = 2371.7; p < 0.001) and the time (F = 2965.6;<br />
p < 0.001) had a significant effect on wear. Tukey<br />
post hoc test (p < 0.05) showed that cement wear<br />
decreased significantly for all time spans measured in<br />
the one-year period.<br />
Ketac Molar Easymix presented the lowest wear in<br />
comparison to the other materials, with significant<br />
difference in the 4 and 63 days time-frames. For the<br />
early-term wear test (1 day), Ketac Molar Easymix and<br />
Fuji IX had the lowest wear rate, and Vitro Molar and<br />
Hi Dense the highest. On the other hand, for the oneyear<br />
time-frame the best performance was found for<br />
Ketac Molar Easymix, Fuji IX and Hi Dense.<br />
The flexural and compressive strength together with<br />
the Knoop hardness are summarized in Table 3.<br />
One-way ANOVA showed significant difference for<br />
Fs (F = 9.2; p < 0.001), Cs (F = 4.8; p = 0.001) and<br />
Knoop hardness (F = 24.3; p < 0.001). The highest<br />
flexural and compressive strength was achieved by<br />
Ketac Molar Easymix, Fuji IX and Hi Dense, respectively.<br />
Both Riva and Vitro Molar had low flexural and<br />
compressive strength. Maxxion R performed well in<br />
the strength tests, showing no statistical significant<br />
difference in the flexural strength in relation to Ketac<br />
Molar Easymix, Fuji IX, Hi Dense and Riva. For the<br />
compressive strength Maxxion R test, results were<br />
different only from Ketac Molar Easymix. The Knoop<br />
hardness <strong>of</strong> Ketac Molar Easymix and Fuji IX was<br />
significantly higher than the other <strong>cements</strong>. Vitro Molar<br />
and Riva showed the lower Knoop hardness. A strong<br />
explanatory power between the flexural strength and<br />
the Knoop hardness (r 2 = 0.85) and the compressive<br />
strength and the Knoop hardness (r 2 = 0.82) was<br />
observed. The explanatory power between the flexural<br />
and compressive strength was lower (r 2 = 0.61). An<br />
even smaller explanatory power between the wear at<br />
day 1 and the flexural strength, compressive strength<br />
and the Knoop hardness was found (r 2 < 0.52). The<br />
long-term wear after one year showed a strong<br />
Table 2. Mean wear and standard deviation in parentheses (lm) at different time periods for the<br />
investigated materials<br />
Day Riva Fuji IX Hi Dense Vitro Molar Maxxion R Ketac Molar Easymix<br />
1 124.2 (11.8) 105.0 (2.7) a<br />
184.7 (19.7) 198.8 (9.0) 146.2 (6.9) 100.9 (1.1) a<br />
4 99.3 (11.3) 85.8 (4.1) 225.9 (5.1) 185.0 (7.3) 111.0 (2.1) 74.4 (1.1)<br />
63 79.0 (2.1) bc<br />
74.2 (2.2) c<br />
84.4 (6.7) b<br />
n ⁄ a 80.0 (4.7) bc<br />
57.7 (1.6)<br />
365 60.6 (9.6) 44.5 (1.8) d<br />
44.4 (1.6) d<br />
123.2 (2.1) 68.8 (9.8) 44.9 (4.8) d<br />
Means with the same letter are not significantly different (p > 0.05).<br />
Fig 1. Wear in lm per 200 000 cycles on the investigated materials<br />
at slip <strong>of</strong> 15% and 15 N force.<br />
Table 3. Mean flexural strength (F s in MPa),<br />
compressive strength (C s in MPa) and the Knoop<br />
hardness (in MPa), and standard deviations in<br />
parentheses for the investigated materials (after<br />
24 hours)<br />
Material Flexural<br />
strength (Fs)<br />
Riva 23.9 (10.7) ab<br />
Fuji IX 33.3 (6.1) c<br />
Hi Dense 33.3 (3.9) c<br />
Vitro Molar 19.2 (4.0) a<br />
Maxxion R 29.5 (3.6) bc<br />
Ketac Molar 34.5 (7.2) c<br />
Easymix<br />
<strong>Physical</strong>-<strong>mechanical</strong> <strong>properties</strong> <strong>of</strong> GICs<br />
Compressive<br />
strength (Cs)<br />
126.5 (18.5) a<br />
166.7 (31.3) ab<br />
159.2 (26.7) ab<br />
135.7 (48.3) a<br />
130.3 (23.2) a<br />
177.8 (28.2) b<br />
Knoop<br />
hardness (Kh)<br />
38.7 (12.9) ab<br />
68.7 (10.9) d<br />
55.8 (11.5) c<br />
37.0 (5.5) a<br />
50.4 (5.3) bc<br />
73.8 (9.4) d<br />
Means with the same letter, within Fs, Cs or Kh are not significantly<br />
different (p > 0.05).<br />
ª 2009 Australian Dental Association 235