Blending Geospatial Technology and Traditional Ecological ... - crest
Blending Geospatial Technology and Traditional Ecological ... - crest
Blending Geospatial Technology and Traditional Ecological ... - crest
- No tags were found...

You also want an ePaper? Increase the reach of your titles
YUMPU automatically turns print PDFs into web optimized ePapers that Google loves.
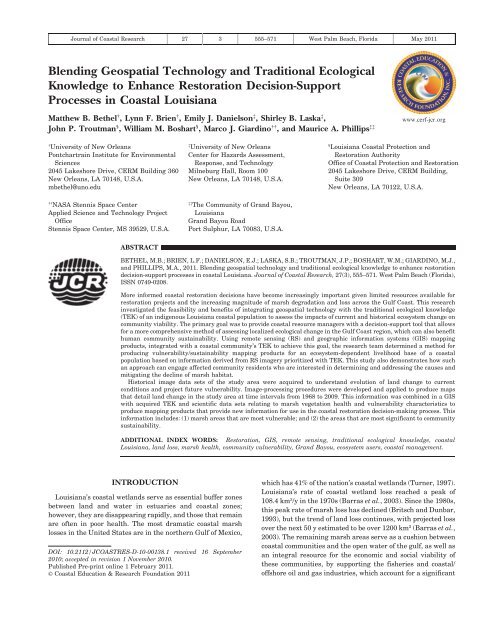
Journal of Coastal Research 27 3 555–571 West Palm Beach, Florida May 2011<strong>Blending</strong> <strong>Geospatial</strong> <strong>Technology</strong> <strong>and</strong> <strong>Traditional</strong> <strong>Ecological</strong>Knowledge to Enhance Restoration Decision-SupportProcesses in Coastal LouisianaMatthew B. Bethel { , Lynn F. Brien { , Emily J. Danielson { , Shirley B. Laska { ,John P. Troutman 1 , William M. Boshart 1 , Marco J. Giardino {{ , <strong>and</strong> Maurice A. Phillips {{www.cerf-jcr.org{University of New OrleansPontchartrain Institute for EnvironmentalSciences2045 Lakeshore Drive, CERM Building 360New Orleans, LA 70148, U.S.A.mbethel@uno.edu{{NASA Stennis Space CenterApplied Science <strong>and</strong> <strong>Technology</strong> ProjectOfficeStennis Space Center, MS 39529, U.S.A.{University of New OrleansCenter for Hazards Assessment,Response, <strong>and</strong> <strong>Technology</strong>Milneburg Hall, Room 100New Orleans, LA 70148, U.S.A.{{The Community of Gr<strong>and</strong> Bayou,LouisianaGr<strong>and</strong> Bayou RoadPort Sulphur, LA 70083, U.S.A.1Louisiana Coastal Protection <strong>and</strong>Restoration AuthorityOffice of Coastal Protection <strong>and</strong> Restoration2045 Lakeshore Drive, CERM Building,Suite 309New Orleans, LA 70122, U.S.A.ABSTRACTBETHEL, M.B.; BRIEN, L.F.; DANIELSON, E.J.; LASKA, S.B.; TROUTMAN, J.P.; BOSHART, W.M.; GIARDINO, M.J.,<strong>and</strong> PHILLIPS, M.A., 2011. <strong>Blending</strong> geospatial technology <strong>and</strong> traditional ecological knowledge to enhance restorationdecision-support processes in coastal Louisiana. Journal of Coastal Research, 27(3), 555–571. West Palm Beach (Florida),ISSN 0749-0208.More informed coastal restoration decisions have become increasingly important given limited resources available forrestoration projects <strong>and</strong> the increasing magnitude of marsh degradation <strong>and</strong> loss across the Gulf Coast. This researchinvestigated the feasibility <strong>and</strong> benefits of integrating geospatial technology with the traditional ecological knowledge(TEK) of an indigenous Louisiana coastal population to assess the impacts of current <strong>and</strong> historical ecosystem change oncommunity viability. The primary goal was to provide coastal resource managers with a decision-support tool that allowsfor a more comprehensive method of assessing localized ecological change in the Gulf Coast region, which can also benefithuman community sustainability. Using remote sensing (RS) <strong>and</strong> geographic information systems (GIS) mappingproducts, integrated with a coastal community’s TEK to achieve this goal, the research team determined a method forproducing vulnerability/sustainability mapping products for an ecosystem-dependent livelihood base of a coastalpopulation based on information derived from RS imagery prioritized with TEK. This study also demonstrates how suchan approach can engage affected community residents who are interested in determining <strong>and</strong> addressing the causes <strong>and</strong>mitigating the decline of marsh habitat.Historical image data sets of the study area were acquired to underst<strong>and</strong> evolution of l<strong>and</strong> change to currentconditions <strong>and</strong> project future vulnerability. Image-processing procedures were developed <strong>and</strong> applied to produce mapsthat detail l<strong>and</strong> change in the study area at time intervals from 1968 to 2009. This information was combined in a GISwith acquired TEK <strong>and</strong> scientific data sets relating to marsh vegetation health <strong>and</strong> vulnerability characteristics toproduce mapping products that provide new information for use in the coastal restoration decision-making process. Thisinformation includes: (1) marsh areas that are most vulnerable; <strong>and</strong> (2) the areas that are most significant to communitysustainability.ADDITIONAL INDEX WORDS: Restoration, GIS, remote sensing, traditional ecological knowledge, coastalLouisiana, l<strong>and</strong> loss, marsh health, community vulnerability, Gr<strong>and</strong> Bayou, ecosystem users, coastal management.INTRODUCTIONLouisiana’s coastal wetl<strong>and</strong>s serve as essential buffer zonesbetween l<strong>and</strong> <strong>and</strong> water in estuaries <strong>and</strong> coastal zones;however, they are disappearing rapidly, <strong>and</strong> those that remainare often in poor health. The most dramatic coastal marshlosses in the United States are in the northern Gulf of Mexico,DOI: 10.2112/JCOASTRES-D-10-00138.1 received 16 September2010; accepted in revision 1 November 2010.Published Pre-print online 1 February 2011.’ Coastal Education & Research Foundation 2011which has 41% of the nation’s coastal wetl<strong>and</strong>s (Turner, 1997).Louisiana’s rate of coastal wetl<strong>and</strong> loss reached a peak of108.4 km 2 /y in the 1970s (Barras et al., 2003). Since the 1980s,this peak rate of marsh loss has declined (Britsch <strong>and</strong> Dunbar,1993), but the trend of l<strong>and</strong> loss continues, with projected lossover the next 50 y estimated to be over 1200 km 2 (Barras et al.,2003). The remaining marsh areas serve as a cushion betweencoastal communities <strong>and</strong> the open water of the gulf, as well asan integral resource for the economic <strong>and</strong> social viability ofthese communities, by supporting the fisheries <strong>and</strong> coastal/offshore oil <strong>and</strong> gas industries, which account for a significant
556 Bethel et al.portion of the coastal population’s employment (Gramling <strong>and</strong>Hagelman, 2005). These coastal marshes are also criticalphysical buffers against the full fury of storm events thatimpact the more densely populated areas in the gulf region,such as the Greater New Orleans Metropolitan Area (Freudenburget al., 2009). Therefore, coastal community leaders,government officials, <strong>and</strong> resource managers must be able toaccurately assess <strong>and</strong> predict a given coastal community’ssustainability <strong>and</strong>/or vulnerability as this coastal habitatcontinues to undergo rapid <strong>and</strong> dramatic changes associatedwith natural processes <strong>and</strong> anthropogenic activities, as well ascoastal restoration efforts.The dependency of coastal communities <strong>and</strong> more populatedareas inl<strong>and</strong> on the marshes was clearly illustrated during the2005 hurricane season as the Louisiana Gulf Coast bore thebrunt of Hurricanes Katrina <strong>and</strong> Rita. The destructive impactof these storms to coastal communities <strong>and</strong> populated centersinl<strong>and</strong> was more pronounced after decades of loss of criticalmarsh habitat. It is hypothesized that a storm surge approachingNew Orleans from the south through existing coastalmarshes could have been reduced by 3.7 m if it had crossed80 km of marsh before reaching the city (Mitsch <strong>and</strong> Gosselink,2007).Current Coastal Restoration ManagementSince the 1980s, the state of Louisiana, in partnership withvarious federal agencies, has been implementing wetl<strong>and</strong>restoration projects to slow the rate of wetl<strong>and</strong> loss. The maintypes of projects include freshwater diversions (i.e., riverreintroductions), hydrologic restoration (marsh management),marsh creation with dredged materials, <strong>and</strong> barrier isl<strong>and</strong>restoration. Under the Coastal Wetl<strong>and</strong>s Planning Protection<strong>and</strong> Restoration Act (CWPPRA), project ideas are evaluated,<strong>and</strong> several projects are selected for funding each year. Selectedprojects go through extensive planning, design, construction,<strong>and</strong> then operations, maintenance, <strong>and</strong> monitoring. Constructedprojects are periodically evaluated, <strong>and</strong> the project effectivenessresults are fed back into the planning process.Coastal restoration planning tools have tended to focus onbiophysical characteristics of the area of interest. For example,the Wetl<strong>and</strong> Value Assessment (WVA) is a heavily usedcomponent of the current coastal restoration decision-makingprocess. It provides an estimate of the number of acresbenefited, enhanced, or restored by a proposed project(CWPPRA, 2006). Variables considered to be important incharacterizing fish <strong>and</strong> wildlife habitat are entered into theWVA model, <strong>and</strong> a Habitat Suitability Index (HSI) is produced.The HSI ranges from 0.1 to 1.0 <strong>and</strong> is a numerical representationof the overall habitat quality of the particular wetl<strong>and</strong>being evaluated. Other physical data used in the planning <strong>and</strong>evaluation phases include remotely sensed imagery (Folse etal., 2008; Steyer et al., 2000). Specifically, these image data setsare used to calculate l<strong>and</strong> loss, among other physical propertiesof marsh condition. The l<strong>and</strong>-loss maps typically produced forthe Louisiana Coastal Protection <strong>and</strong> Restoration Authority(CPRA) use L<strong>and</strong>sat 30-m-resolution images for assessing lossfrom the regional scale down to projects a few thous<strong>and</strong> acres insize. These data sets are suitable for regional assessment ofl<strong>and</strong> <strong>and</strong> water trends; however, they may not be appropriatefor small project assessments.More recently, CPRA’s Office of Coastal Protection <strong>and</strong>Restoration (OCPR) has been developing a Project PrioritizationModel (PPM) to support decision making regarding theselection of proposed restoration projects. This model usesmathematical calculations to prioritize proposed projects basedon the State Master Plan objectives: (1) reduce economic lossesfrom storm-based flooding; (2) promote a sustainable coastalecosystem; (3) provide habitats for commercial <strong>and</strong> recreationalactivities; <strong>and</strong> (4) sustain the unique heritage of coastalLouisiana (CPRA, 2009). The PPM is designed to be anadaptable tool that allows for the inclusion of new informationas it becomes available. As the data driving the modelimproves, the model’s results will help OCPR decide how tobetter prioritize future restoration <strong>and</strong> protection projects(CPRA, 2009). In fact, OCPR encourages ideas from the publicas to how this model <strong>and</strong> other restoration tools can beimproved.The Role of Local Knowledge in Coastal RestorationWhereas the WVA has proven useful in assessing potentialimpact to the habitats of fish <strong>and</strong> wildlife during the coastalrestoration planning process, little effort has been made tounderst<strong>and</strong> the social <strong>and</strong> cultural interpretations of restorationwithin which the biophysical resources are embedded. Thisis because scientific models, such as those used for restorationplanning <strong>and</strong> assessment, are typically built to utilize onlyscientific knowledge, which is derived from systematic observations<strong>and</strong> experiments that target selective environmentalfactors. However, use of only scientific knowledge to informrestoration management <strong>and</strong> planning inhibits the ability ofthe decision maker to effectively deal with differences in localconservation priorities, or to collectively consider the social,cultural, <strong>and</strong> political impacts of restoration (Balram, Dragicevic,<strong>and</strong> Meredith, 2004).<strong>Traditional</strong> ecological knowledge (TEK) is defined as acumulative body of knowledge, practice, <strong>and</strong> belief that evolvesby adaptive processes, is h<strong>and</strong>ed down through generations bycultural transmission, <strong>and</strong> centers on the relationships ofhumans with one another <strong>and</strong> with their environment (Berkes,Colding, <strong>and</strong> Folke, 2000). Examples of TEK include: impacts ofhistorical l<strong>and</strong> loss on affected communities; changes in flora<strong>and</strong> fauna; natural resource use, <strong>and</strong> degradation of thoseresources over time; a history of man-made structures <strong>and</strong>impacts to the ecosystem <strong>and</strong> community; <strong>and</strong> the identificationof priority areas of community significance or concern. Asubstantial body of TEK exists in Louisiana’s coastal communities,particularly in the indigenous groups that havehistorically lived in the marshes <strong>and</strong> make their living directlyfrom the ecosystem services offered by those marshes. Thatsource of information is virtually unused in the restorationplanning process. One reason for the underutilization of TEK islikely because qualitative TEK data are not readily compatiblefor input into mathematical models, such as the habitatvariables of the WVA. Nonetheless, there is evidence thatrestoration managers <strong>and</strong> scientists are beginning to recognizethe value of incorporating TEK into the current decision-Journal of Coastal Research, Vol. 27, No. 3, 2011
<strong>Technology</strong> <strong>and</strong> <strong>Traditional</strong> Knowledge in Coastal Restoration Decisions 557support system. For example, the Louisiana Coastal AreaScience <strong>and</strong> <strong>Technology</strong> Program (LCA S&T), which informsthe use of coastal restoration strategies in Louisiana, recommendedsupport of ‘‘research that focuses on local ecologicalknowledge’’ noting that, ‘‘such knowledge can inform scientificdiscourse <strong>and</strong> lead to improved project planning’’ (LCA S&T,2010, p. 4).Rationale for Data Integration to SupportDecision MakingStudies such as those conducted by Petch, Oauknerova, <strong>and</strong>Heywood (1995) <strong>and</strong> Balram, Dragicevic, <strong>and</strong> Meredith (2004)have shown that there are many benefits to integrating TEK<strong>and</strong> scientific knowledge in a geographic information systems(GIS) spatial framework; these include: incorporating inputs<strong>and</strong> policies at various levels of spatial aggregation; promotingspatial <strong>and</strong> temporal thinking about issues <strong>and</strong> concerns; <strong>and</strong>creating opportunities for learning <strong>and</strong> sharing of responsibilities.However, there are no examples of applied spatialknowledge integration research from scientific <strong>and</strong> localknowledge sources to inform coastal restoration decisionmaking. In order to demonstrate the way in which thisknowledge fusion may be used to enhance the currentrestoration decision-making process, this study presents acollaborative GIS method for integrating TEK <strong>and</strong> scientificknowledge with spatial environmental data in an interactiveparticipatory process for establishing restoration priorities,<strong>and</strong> it demonstrates how this knowledge fusion may be used toenhance current restoration decision-making processes. Theintegrated data set allows the local <strong>and</strong> technical knowledgeexperts to share, explore, manage, analyze, <strong>and</strong> interpret themultidimensional data in a st<strong>and</strong>ard spatial context in order todevelop more informed restoration decisions.The goal of this research was to develop a wetl<strong>and</strong>restoration planning decision-support tool that incorporatesscientific data sets <strong>and</strong> TEK to provide a more comprehensivemethod of assessing ecological change that can benefit bothecosystem <strong>and</strong> human community sustainability. The objectiveswere to: (1) produce historical l<strong>and</strong>-cover change <strong>and</strong>marsh condition maps of a degraded wetl<strong>and</strong> using remotesensing (RS), GIS, <strong>and</strong> in-situ marsh biophysical data; (2)record, document, <strong>and</strong> analyze the TEK of local indigenousresidents whose livelihoods are dependent on the surroundingecosystem; <strong>and</strong> (3) integrate both sources of information(scientific <strong>and</strong> traditional) into a GIS. This research representsan unprecedented effort to merge diverse spatial, biophysical,<strong>and</strong> traditional knowledge regarding marsh condition into aformat suitable for informing current coastal restorationdecision-support processes at a resolution suitable for localizeddecision making. It also engages users directly in the process ofanalyzing the marsh changes <strong>and</strong> effects in anticipation ofrestoration efforts.STUDY AREAThe focus of this study is the approximately 71 km 2 (27.4 mi 2 )area encompassing the ecological livelihood base of the coastalcommunity of Gr<strong>and</strong> Bayou in lower Plaquemines Parish,Figure 1. Map of SE Louisiana showing location of the Gr<strong>and</strong> Bayoustudy area <strong>and</strong> parish boundaries.Louisiana (Figure 1). Geographically, Gr<strong>and</strong> Bayou is locatedwithin or near several ongoing <strong>and</strong> planned CWPPRA marshrestoration projects that either have affected or will impact thecommunity <strong>and</strong> its ecological livelihood base. This area hasexperienced some of the highest rates of l<strong>and</strong> loss in theLouisiana coastal zone. For the area near Gr<strong>and</strong> Bayou (ascalculated for the Pointe a la Hache Digital OrthophotoQuarter Quadrangle by Dunbar, Britsch, <strong>and</strong> Kemp, 1992),the average rate of marsh l<strong>and</strong> loss was 0.73 km 2 /y between1932 <strong>and</strong> 1958, 1.94 km 2 /y between 1958 <strong>and</strong> 1974, 1.84 km 2 /ybetween 1974 <strong>and</strong> 1983, <strong>and</strong> 1.94 km 2 /y between 1983 <strong>and</strong>1990.A project specifically related to this research is BA-04—WestPointe a la Hache Outfall Management. The status of thisCWPPRA restoration project is detailed on the LouisianaCoastal Wetl<strong>and</strong>s Conservation <strong>and</strong> Restoration Task ForceWeb site (LaCoast, 2008), which contains information <strong>and</strong> linksrelating to restoration projects in coastal Louisiana. The WestPointe a la Hache freshwater diversion siphons have beenoperational since early 1993 <strong>and</strong> divert sediment <strong>and</strong> freshwaterfrom the Mississippi River into the surroundingmarshes.The residents of Gr<strong>and</strong> Bayou, who are self-identified aspredominantly Native Americans of the Atakapa tribe, with amix of various other cultures to a lesser degree, trace theirancestry within this region back 200 to 300 y. Communitymembers have historically sustained themselves by utilizingnatural resources, particularly the marine resources, availableto them in their coastal environment, a tradition that persistsin the Atakapa culture today. Like generations before them,the residents are fishers, hunters, <strong>and</strong> trappers who dependupon the natural resources of the surrounding ecosystem tosustain their way of life. They utilize the local ecosystem in theseasonal harvest of all commercial species including shrimp,oysters, crab, softshell crab, nutria, alligator, <strong>and</strong> fish. Gr<strong>and</strong>Bayou residents are intricately tied to the surroundingecosystem <strong>and</strong> have a long history of adaptation to thechallenges associated with persistent change within theecosystem due to both natural <strong>and</strong> anthropogenic factors.Because of their dependency upon the environment, theJournal of Coastal Research, Vol. 27, No. 3, 2011
558 Bethel et al.residents are actively engaged in issues such as habitatrestoration, water quality, <strong>and</strong> economic development topromote conservation <strong>and</strong> underst<strong>and</strong>ing of this complex <strong>and</strong>vulnerable ecosystem. Oral history dominates their culture,<strong>and</strong> as a result, their knowledge of the ecosystem derives bothfrom extensive personal experience <strong>and</strong> from TEK, thecumulative body of knowledge h<strong>and</strong>ed down through generations.This knowledge makes them valuable partners inrestoration planning.Since Hurricane Katrina (which had the most devastatingimpact to Gr<strong>and</strong> Bayou of any storm in living memory asreported by the residents), efforts at resource utilization havebecome increasingly difficult due to displacement of manycommunity members <strong>and</strong> the significant obstacles the communityfaced in the rebuilding process. The residents of Gr<strong>and</strong>Bayou recognize the importance of rapid <strong>and</strong> effective marshrestoration so that community members can return <strong>and</strong>continue to live where they are able to successfully sustaintheir traditional livelihood of natural resource harvest activities<strong>and</strong> retain their endemic underst<strong>and</strong>ing of this constantlychanging area.DATA AND METHODSUsing RS, GIS, <strong>and</strong> other geospatial technologies complementedby a coastal community’s TEK, we created a detailedassessment of historical l<strong>and</strong> loss in the study area <strong>and</strong>evolution of the l<strong>and</strong>scape to its current condition, a methodfor producing a marsh surface condition map that presentsoverall marsh health <strong>and</strong> potential for deterioration, as well asa method for mapping TEK-based information. These data setswere combined in a format that can provide a more comprehensiveassessment of ecological change than is currentlyutilized in restoration decision making that includes effects onlocal resource utility value <strong>and</strong> areas of cultural significance.Studies of the location <strong>and</strong> historical rates of l<strong>and</strong> loss incoastal Louisiana are often limited to change in spatial extent;however, prioritization of future restoration efforts requiresadditional information regarding marsh condition. There aremany natural <strong>and</strong> anthropogenic factors that contribute tomarsh degradation <strong>and</strong> loss. The initial TEK data collectionindicated that there were two main driving factors related tol<strong>and</strong> loss in the study area: (1) marsh vegetation health, <strong>and</strong> (2)marsh fragmentation. As a result of this information, theparameters investigated for evaluating potential l<strong>and</strong> loss inthis area were related to biophysical characteristics <strong>and</strong>spatially dependent relationships within the l<strong>and</strong>scape. Marshbiophysical characteristics include the distribution of chlorophyllcontent, leaf area index, vegetation fraction, <strong>and</strong> biomass.These biophysical characteristics are indicators of the physiologicalstatus of marsh vegetation. Monitoring of thesecharacteristics through remotely sensed imagery can aid inthe inference of the overall health of these areas so that moreinformed restoration management strategies may be implemented.Spatially dependent relationships refer to the patternsof change related to the configuration <strong>and</strong> connectivity of l<strong>and</strong>covertypes within a l<strong>and</strong>scape. Prediction of future change canbe aided through better underst<strong>and</strong>ing of the spatial relationshipsof l<strong>and</strong>-cover types for a given area.It is well documented that most physiological stress in plantswill reduce the concentration of photosynthetic pigments, <strong>and</strong>as a result stressed plants are known to have different spectralreflectance characteristics compared to healthy ones (Nilsson,1995). Various vegetation indicies can serve as indicators ofplant health <strong>and</strong> chlorophyll pigment loss. For instance, Vigier,Pattey, <strong>and</strong> Strachan (2004) reported that plant damage wasassociated with the chlorophyll absorption in reflectance <strong>and</strong>normalized vegetation indicies, showing a loss of chlorophyllpigment compared to healthy plants. Carter <strong>and</strong> Spiering(2002) determined specific wavelengths that are most sensitiveto chlorophyll concentration in an effort to better underst<strong>and</strong>the relationship between leaf optical properties <strong>and</strong> chlorophyllcontent. Therefore, relative chlorophyll content was used as abiophysical parameter to assess marsh health variability forthis study.Leaf area index (LAI) is the ratio of total upper leaf surface ofvegetation divided by a given surface area of the l<strong>and</strong> on whichthe vegetation grows. Because LAI most directly quantifies theplant canopy structure, it is highly related to a variety ofcanopy processes, such as water interception, evapotranspiration,photosynthesis, respiration, <strong>and</strong> leaf litterfall. LAI ‘‘is acritical variable for underst<strong>and</strong>ing the biological <strong>and</strong> physicalprocesses associated with vegetated l<strong>and</strong> surfaces’’ (Wang etal., 2004, p. 114). Given that LAI has been shown to beimportant in underst<strong>and</strong>ing many aspects of plant canopydevelopment, growth, <strong>and</strong> management, it was the secondbiophysical parameter, along with chlorophyll content, used inthis study.The quantification of l<strong>and</strong>scape pattern allows us to identifyinteractions among spatial patterns <strong>and</strong> ecological processes.Because l<strong>and</strong>-cover maps derived from remotely sensedimagery only indicate the location <strong>and</strong> type of l<strong>and</strong> cover,further processing is needed to quantify <strong>and</strong> map l<strong>and</strong>-coverfragmentation (Gustafson, 1998; Turner <strong>and</strong> Gardner, 1991).Practical applications of l<strong>and</strong>scape pattern quantificationinclude: describing how a l<strong>and</strong>scape has changed throughtime; making future predictions regarding l<strong>and</strong>scape change;<strong>and</strong> evaluating alternative l<strong>and</strong> management strategies interms of the l<strong>and</strong>scape patterns that may result. Thecalculation of l<strong>and</strong>scape pattern metrics is necessary torigorously describe l<strong>and</strong>scape patterns (Gergel <strong>and</strong> Turner,2003). The purpose of a l<strong>and</strong>scape fragmentation analysis is tomap the types of fragmentation present in a l<strong>and</strong>-cover type(i.e., marsh). Turner et al. (2003 p. 3) define fragmentation asthe ‘‘breaking up of a habitat or cover type into smaller,disconnected parcels.’’ Fragmented l<strong>and</strong> cover is typicallyclassified into four main categories: patch, edge, perforated,<strong>and</strong> core. These fragmentation types are defined by ESRI(2010) as:NNNNperforated—pixels along the edge of an interior gap in al<strong>and</strong> cover that are degraded by edge effects;edge—pixels along the exterior perimeter of a l<strong>and</strong> coverthat are degraded by an edge effect;patch—small isolated fragments of a l<strong>and</strong> cover that arecompletely degraded by edge effects; <strong>and</strong>core—l<strong>and</strong>-cover pixels that are not degraded by edgeeffects.Journal of Coastal Research, Vol. 27, No. 3, 2011
<strong>Technology</strong> <strong>and</strong> <strong>Traditional</strong> Knowledge in Coastal Restoration Decisions 559Table 1.Imagery used in l<strong>and</strong>-change analysis.Image Date Image Type Image Source Image Resolution11/25/1968 .BW scanned aerial photography U.S. Army Corps of Engineers, New Orleans .1:30,000 (600 dpi)03/26/1979 .CIR scanned aerial photography NASA/UL Lafayette Regional Application Center .1:65,000 (1,500 dpi)11/05/1991 .Digital orthophoto quarter quadrangles (DOQQ) USGS Earth Resources <strong>and</strong> Observation Science .1 m(EROS) Center01/24/1995 .CIR scanned aerial photography NASA/UL Lafayette Regional Application Center .1:65,000 (1,500 dpi)01/24/1998 .DOQQ EROS .1 m01/21/2004 .DOQQ EROS .1 m10/27/2005 .DOQQ EROS .1 m10/30/2008 .DOQQ EROS .1 m10/30/2009 .Satellite imagery DigitalGlobe Quickbird .2.39 m11/12/2009 .Satellite imagery DigitalGlobe Quickbird .2.39 mFragmentation type is determined by proximity to fragmentingfeatures (such as water in this case). Originally, fragmentationanalysis was developed for use on forest l<strong>and</strong> covers butcan be applied to any l<strong>and</strong> cover of interest (ESRI, 2010).Mapping Historical L<strong>and</strong> ChangePreclassification Image-Processing ProceduresHistorical l<strong>and</strong>-loss assessment of the study area utilizedhigh-resolution (,2.39 m), multitemporal aerial <strong>and</strong> satelliteimage data sets spanning a period of approximately 40 y, from1968 to 2009 (Table 1). The image data sets selected for thestudy were all acquired between fall <strong>and</strong> early spring, thusminimizing confusion in l<strong>and</strong>-water discrimination caused bythe presence of floating aquatic vegetation more commonduring summer months (Barras et al., 2003). Image processing<strong>and</strong> analysis were accomplished using ERDAS Imagine 9.3software. The images were georectified <strong>and</strong> then resampled asnecessary to a common spatial resolution of 2.39 m using thenearest neighbor method. To ensure uniform georegistration,image data sets were projected to the Universal TransverseMercator (UTM) Zone 15 North American Datum (NAD) 83coordinate system. Image frames of scanned aerial photos weremosaicked using an image overlay function, <strong>and</strong> all image datasets were subset to the study area boundaries. Radiometricenhancement in the form of adaptive filtering noise reductionwas applied to the 1968, 1979, <strong>and</strong> 1995 aerial photos prior toclassification. This technique preserved the subtle details inthe scanned images while removing noise resulting from thedigitization process, as manifested by a grainy appearance.Image-quality issues in the 1968, 1979, 1991, <strong>and</strong> 2004 datasets resulted in difficulties with classification of l<strong>and</strong> <strong>and</strong> waterin some areas. As a result, subsets were used during or prior toclassification to isolate these problematic areas for furtherprocessing. Subsets were necessary to isolate areas of sun glint,to address image vignetting, <strong>and</strong> to deal with the effects ofbrightness differences along mosaic seam lines (typicallyaffecting ,20% of the total image area). Cloud maskingnecessary in the October 30, 2009 image was accomplished bycreating a thematic layer in which the pixel values unique tothe clouds in that image were grouped into a ‘‘cloud’’ class,which was subsequently recoded to zero to exclude cloud areasthat corresponded to 6% of the total image area.Image ClassificationPreprocessed image data sets were classified using ast<strong>and</strong>ardized methodology based on a hybrid approach of levelslicing, <strong>and</strong> supervised <strong>and</strong> unsupervised classification techniques.These techniques were combined with recoding ofresulting thematic images to derive l<strong>and</strong>-water binary maps foreach data set, as well as a vegetation–non-vegetation binarymap for the October 30, 2009, data set.In the supervised classification technique, areas of interest(AOIs) were developed for use as training clusters in thecreation of unique spectral signatures for each of the classes.For this process, the eight neighborhood mode was used todetermine the pixels that would be considered contiguous (i.e.,similar in value) to the selected pixel. The spectral Euclidi<strong>and</strong>istance (the spectral distance from the mean of the seed, orselected pixel) was kept as low as possible, with the goal ofobtaining representative training clusters with st<strong>and</strong>arddeviations of 3 or less <strong>and</strong> consisting of a minimum of 25pixels. This convention was maintained whenever possible,although it was at times necessary to accept slightly higherst<strong>and</strong>ard deviation values, depending upon image quality.While a minimum number of 10 training signatures wasobtained for each class, in some images 50 or more trainingsites were selected to adequately represent the variationswithin a class. The probabilities of the spectral signatures werenormalized prior to the supervised classification, which wasbased upon a maximum likelihood classifier. A distance file wascreated in the process <strong>and</strong> used, along with the resultingsupervised classified image, to create a threshold image basedon a confidence level of 0.050 <strong>and</strong> x 2 of 9.490. The thresholdimage resulted from iteratively identifying class thresholdvalues with an image raster attribute table using the originalimage data set as reference. Once these class threshold valueswere determined, all values were recoded as l<strong>and</strong>, water, or nodata for each image <strong>and</strong> for vegetation, nonvegetation, <strong>and</strong> nodata for the October 30, 2009, image. For this analysis, thesingle-b<strong>and</strong> aerial image files were represented as red-bluegreen(RGB) in Imagine 9.3, with the same pixel valuerepresenting each b<strong>and</strong> in the RGB signature (correspondingto image brightness).Unsupervised classification employed the iterative selforganizingdata analysis technique (ISODATA), a clusteringmethod that uses a minimum spectral distance formula to formJournal of Coastal Research, Vol. 27, No. 3, 2011
560 Bethel et al.clusters or classes of similar spectra for an image data set. Theclusters were initialized from statistics, <strong>and</strong> the number ofclasses specified varied between 25 <strong>and</strong> 75, with fewer classesnecessary in images exhibiting clear delineation between l<strong>and</strong><strong>and</strong> water classes. Maximum iterations were set at 100, withthe convergence threshold set at 0.950.When necessary, an unsupervised classification image wasused to classify remaining unclassified or undetermined pixelsin a threshold image. This was accomplished by overlaying thethreshold image on the original image <strong>and</strong> linking it geographicallyto an unsupervised classification image. In this way, trial<strong>and</strong> error <strong>and</strong> careful examination of the images were used tomake the best estimates of appropriate classification ofremaining undetermined pixels, <strong>and</strong> thus enhance classificationaccuracy. In addition, supervised classification wasperformed on areas of mixed cluster issues resulting fromunsupervised classification to better identify l<strong>and</strong> <strong>and</strong> waterpixels for those problem areas. Also, clusters that were noteasily labeled were separated from the rest of the image, <strong>and</strong>then the classification algorithm was applied again to obtainadditional clusters (Jensen et al., 1987). Each final classifiedimage was recoded for three values: unclassified, l<strong>and</strong>, <strong>and</strong>water.Postclassification modifications designed to reduce classificationerror related to noise inherent in the data included aneighborhood analysis, a GIS Analysis Clump procedure,applied to the recoded classified images using four connectedneighbors to identify contiguous areas of class values. A GISAnalysis Eliminate procedure was then applied to eliminate‘‘clumps’’, i.e., small isl<strong>and</strong> classes (or noise) within largerclasses, using four contiguous pixels or less as the threshold fordefining a clump to be eliminated.Change AnalysisA multidate postclassification comparison was performed asa means of detecting changes in l<strong>and</strong>-water distribution withinthe study area during the period between 1968 <strong>and</strong> 2009. Pairsof l<strong>and</strong>-water classified images were compared pixel by pixel,<strong>and</strong> each comparison resulted in a change detection matrix ofl<strong>and</strong>-water transformations (or lack of transformation) <strong>and</strong> theproduction of a categorical map depicting <strong>and</strong> quantifying l<strong>and</strong>,water, l<strong>and</strong> loss, <strong>and</strong> l<strong>and</strong> gain.Critical visual examination of sequential change mapsrevealed areas where l<strong>and</strong>-cover transformations appearedimpermanent, reversible, <strong>and</strong> possibly cyclical. Pixel by pixelcomparisons of successive l<strong>and</strong>-cover change maps allowed thedelineation of these areas, which were then characterized astransitional zones. Transitional zones were separated fromareas that consistently exhibited l<strong>and</strong> loss or gain throughoutall time periods analyzed. These transitory l<strong>and</strong> changes wereseparated from the actual l<strong>and</strong>-loss class so that only l<strong>and</strong> thatwas permanently lost from a particular date to present wascategorized as ’’actual l<strong>and</strong> loss.’’ The concept of combiningseveral years of observations as a means of discriminatingpermanent l<strong>and</strong> loss or gain from transitory loss or gainresulting from episodic events such as hurricanes wassuggested in methods used by Barras, Bernier, <strong>and</strong> Morton(2008), <strong>and</strong> is the basis of this analysis.Following the identification of the transitional areas, fieldinvestigation was conducted to determine possible causes ofthese features. The 2005–08 transitional change map was loadedinto a h<strong>and</strong>held computer equipped with global positioningsystem (GPS) to navigate to several transitional zone locations.These areas tended to be shallow submerged bare l<strong>and</strong> or marshvegetation, likely emergent during low tidal conditions, <strong>and</strong> thushighly influenced by meteorological (i.e., wind setup/setdowneffects) <strong>and</strong> tidal conditions at the time of image acquisition.Accuracy Assessment of L<strong>and</strong>-Cover ClassificationsQuantitative accuracy assessment of l<strong>and</strong>-cover classificationreflects how well the l<strong>and</strong>-cover classes were identifiedfrom the source imagery. Consistent with guidelines suggestedby Congalton <strong>and</strong> Green (2009), each l<strong>and</strong>-cover classificationmap created for this study was assessed for accuracy based onthe selection of 150 stratified r<strong>and</strong>om points, with a minimum50 points representing each map class. The error matrixgenerated for each classified image provides the basis for theoverall accuracy statistics <strong>and</strong> the Kappa coefficient of eachclassification. An overall accuracy level of 85% was consideredthe minimum value for acceptable results (Anderson et al.,1976). All final l<strong>and</strong>-water classifications exceeded thisaccuracy level threshold.Mapping Community Restoration Priorities <strong>and</strong>Observed Change Using TEKAcquisition <strong>and</strong> analysis of TEK for this study were based oncollaborative field work methods in which TEK is used inscientific studies to locate study sites, obtain specimens <strong>and</strong>data, <strong>and</strong> interpret field observations <strong>and</strong> results. Thesemethods have been shown to provide an excellent means ofinteracting with a community for an extended period (Huntington,2000). In contrast to other social science methodologiesthat utilize a preplanned survey of questions, collaborativefield work generally records subjects’ observations as they aremade in the field, a technique which allows for a moredescriptive <strong>and</strong> complete account of individual <strong>and</strong> groupmemory of environmental change (Manning, 2005). Additionally,information gained over long-term relationships <strong>and</strong>multiple site visits is more detailed than that collected duringa single interview. As a result, TEK collection for this study wasa dynamic process responsive to changing environmentalconditions <strong>and</strong> accomplished via site visits, frequent phonecalls, <strong>and</strong> social interactions. For the purposes of this study, thecollaborative field work effort included introducing the communityto the geospatial technology used for the project so thatthe ecosystem users (participating Gr<strong>and</strong> Bayou residents) <strong>and</strong>the physical scientists associated with this project becamefamiliar with the reciprocal knowledge of each group. Theecosystem users learned about the mapping techniques <strong>and</strong>scientific field data collection from the scientists <strong>and</strong> wereguided by them in underst<strong>and</strong>ing it, <strong>and</strong> the physical scientistslearned of the TEK data <strong>and</strong> were guided by the ecosystemusers in underst<strong>and</strong>ing it. Also, the two groups learned oneanother’s vocabulary in describing study area features for thesake of successful dialogues.Journal of Coastal Research, Vol. 27, No. 3, 2011
<strong>Technology</strong> <strong>and</strong> <strong>Traditional</strong> Knowledge in Coastal Restoration Decisions 561Maps of the study area were used for visual aids toknowledge transfer; specifically, map biographies of the localresidents were determined to be useful (Calamia, 1999;Ferguson <strong>and</strong> Messier, 1997) within the ongoing collaboration,especially when choosing sites. For these map biographies,printed maps of the Gr<strong>and</strong> Bayou study area were producedfrom acquired satellite <strong>and</strong> aerial imagery <strong>and</strong> used to establisha relative time line of observed ecosystem changes <strong>and</strong> todocument those changes by plotting them directly onto themap. The printed map was also used to record traditionalcommunity names for features <strong>and</strong> to identify ‘‘sensitive areas’’or areas of particular concern to the local peoples, such ascultural sites (i.e., burial grounds) <strong>and</strong> marine or mammal ‘‘ecozones’’’(i.e., fish or animal breeding/spawning areas ofparticular importance to the community, traditional trapping/fishingareas, etc.).TEK SampleFive Gr<strong>and</strong> Bayou resident fishers/trappers participated inthe study. Following community-assisted identification of aprimary informant with expertise <strong>and</strong> in-depth underst<strong>and</strong>ingof the study area, the remaining informants were chosen usinga snowball sampling method wherein the primary informantrecommended additional informants with comparable projectrelatedknowledge (Patton, 1990). All informants identifiedthemselves as Native American, specifically of the Atakapatribe, <strong>and</strong> had been raised in the village.TEK Data Collection, Transcription, <strong>and</strong> CodingProper entrée procedure was followed (West et al., 2008),which included a series of social visits with many communitymembers <strong>and</strong> composition of a ‘‘declaration of principles,’’which outlined expectations <strong>and</strong> commitments for all involvedfor the duration of the project. Verbal permission was obtainedto record conversations using a digital voice recorder prior tobeginning each session of field sampling, TEK collection, orTEK verification activities. The recorder remained on for thefull duration of each data-collection session. A social scientistpresent at each session transcribed all audible conversation assoon as possible following collection, changing the names ofinformants to protect their anonymity, <strong>and</strong> inserting field notesregarding setting, activities, <strong>and</strong> people present. Transcripts ofa total of 53 h of recorded TEK data were uploaded to Atlas.tiqualitative data analysis software (http://www.atlasti.com/)<strong>and</strong> coded using inductive coding (Crabtree <strong>and</strong> Miller, 1992).Coding of the data was accomplished through a line-by-linereview of the transcripts, resulting in the creation of themesdesigned to identify underlying concepts within the data.Direct quotations from the transcribed data sets were used tosupport <strong>and</strong> illustrate the themes. Relationships between codeswere identified given the interconnected nature of cultural <strong>and</strong>environmental factors. Segments of the transcripts were alsolinked to in-field photos <strong>and</strong> maps used in the field to providethe coder with a visual reference relating to the context of thelinked conversation. Linkages were subsequently used toidentify emerging themes within the TEK relative to the locall<strong>and</strong>scape.Theme <strong>and</strong> Codebook DevelopmentProcedures for developing TEK themes <strong>and</strong> a formalcodebook were based on methods outlined by Kurasaki (2000)<strong>and</strong> included annotating the transcribed text, sorting theannotation list, labeling thematic categories, <strong>and</strong> refining thetheme list. Annotations consisted of brief notes summarizingthe main points expressed throughout the transcribed data set.These annotations were used to identify themes that emergedduring this process. Using the Atlas.ti software, excerpts of theraw data were linked to these annotation themes to serve asexamples of each annotation in the list.The codebook was developed by listing all of the codes thatemerged from the TEK data <strong>and</strong> noting brief definitions foreach. For the purposes of synthesis with mapping practices, thecodes were organized into two groups, geographic codes <strong>and</strong>social science codes. Geographic codes represented mappablelocations (specific geographic areas that can be depicted on amap). Social science codes represent informants’ observationsregarding marsh conditions (i.e., descriptor variables used tocharacterize attributes associated with mappable locations),specific events that represent factors contributing to marshdecline <strong>and</strong> that inform the project as background information,<strong>and</strong> sensitive areas of the ecosystem relative to work, quality oflife, <strong>and</strong> cultural significance. Throughout codebook development,preliminary results were verified by contributinginformants in a format that could be easily assessed foraccuracy (i.e., maps <strong>and</strong> verbal summaries, as opposed to thecomplete coded transcriptions).Intercoder Reliability AssessmentIntercoder reliability assessment was undertaken to ensureminimization of coder bias or r<strong>and</strong>om error arising fromjudgments made about categories <strong>and</strong> themes emerging fromthe complex qualitative data sets. Intercoder reliability is aquantitative measure of agreement between multiple coderswith regard to the ways in which codes are applied to TEK data(Kurasaki, 2000). The procedures used to determine intercoderreliability for this study are based upon recommendations byHruschka et al. (2004) <strong>and</strong> Kurasaki (2000). First, steps weretaken to familiarize a second social scientist with the project<strong>and</strong> associated TEK data. Due to the volume of TEK data <strong>and</strong>time constraints, the second coder was presented withapproximately 10 pages of r<strong>and</strong>omly selected textual ‘‘ideaunits’’ from the TEK data, instead of the entire TEK data set assuggested by Hruschka et al. (2004). After the second coderapplied the same systematic coding process using the codebookas a guide, results from the two independent coders werecompared, <strong>and</strong> the agreement between the coders wascalculated.Calculation of intercoder reliability agreement involved ther<strong>and</strong>om selection of 20 lines per coded page. The results of thetwo coders were checked for agreement using the r<strong>and</strong>omlyselected line plus five lines above <strong>and</strong> below the selected line.The inclusion of the additional lines is designed to accommodatethe expected variation between coders with respect totheir identification of TEK relating to specific codes (Kurasaki,2000). Because of the conversational nature of the interviews, itJournal of Coastal Research, Vol. 27, No. 3, 2011
562 Bethel et al.was common to find peripheral text surrounding moresubstantive, codable text. An agreement matrix was developed,<strong>and</strong> the agreement between the coders was calculated as theratio of agreements to total r<strong>and</strong>om excerpts for each codebooktheme. An overall agreement across all the codes wascalculated by averaging the agreements obtained for each code(Kurasaki, 2000). The comparison results were then used torevise the codebook as necessary until an acceptable overallagreement value was achieved.Applying Numeric CodesOnce acceptable intercoder reliability was established <strong>and</strong>the codebook finalized, Atlas.ti was used to investigate thepassages related to the ‘‘Marsh Condition’’ codes in thetranscribed documents in reference to the ‘‘Mappable Locations.’’Based on the TEK information associated with each ofthese Marsh Condition codes, an attribute value of +1, 21, or 0was assigned to each mappable location.With regard to community assessment of restorationpriority, a value of +1 is indicative of an area that is importantor urgent to restore, while a value of 21 indicates an areaconsidered relatively unimportant or not urgent to restore. Avalue of 0 indicates that the location or feature was mentionedin the TEK, but a determination of its importance isinconclusive. It is important to note that a 21 value does notindicate that an area should not be restored, but rather that, incomparison to other areas, it is a lower priority for thecommunity.With regard to assessment of observed change, a value of +1is indicative of a location or feature characterized by a positiveor stable condition over time with regard to natural resourcesused by the community at that location. In contrast, a value of21 is associated with a location or feature that has undergonenegative change or degradation in natural resources over time.A value of 0 indicates that the TEK information is inconclusivefor a particular mappable location/feature.Calculation of the Restoration Priority Index (RP) <strong>and</strong> theIndex of Observed Change (OC) is based on the following:i ~ (a{b)xwhere i 5 index, a 5 number of codes with value of +1, b 5number of codes with value of 21, <strong>and</strong> x 5 total number ofcodes.The RP <strong>and</strong> OC indices were used to produce TEK-basedmaps showing the locations of features identified in the TEK, aswell as a community prioritization for the restoration of thosefeatures (Figure 2). The maps were presented to the TEKinformants for verification <strong>and</strong> validation of the results, <strong>and</strong>any discrepancies were corrected prior to final map production.Mapping Marsh Areas Vulnerable to Loss UsingScientific Data SetsField Data CollectionSampling site selection for the scientific marsh biophysicalcondition data sets was based on accessibility, extent of l<strong>and</strong>loss observed, importance to the community, <strong>and</strong> availability ofð1ÞFigure 2. TEK-based indices maps depicting locations of featuresidentified with TEK collected for this study: (A) TEK-based index ofobserved change map reflecting relative condition over time of theselocations as it relates to the natural resources used by the community; <strong>and</strong>(B) TEK-based index of restoration priority map showing communityprioritization for the restoration of these features.historical data (both TEK <strong>and</strong> scientific data). Sites were alsoevaluated with regard to their representation of various marshconditions observed within the study area. Areas of broken <strong>and</strong>degraded marsh were chosen to contrast with other selectedareas of relatively contiguous, ‘‘firm’’ marsh. Several trial fielddata-collection campaigns were conducted to test <strong>and</strong> refinefield data-collection methods <strong>and</strong> to determine logistics relativeto site accessibility, data <strong>and</strong> hardware needs, time required ateach site, <strong>and</strong> personnel requirements for subsequent fieldsampling. Based on these trials <strong>and</strong> the field data-collectionresources available for this effort, it was possible to sample 20sites within the 71 km 2 area during an approximate 6 h windowof opportunity when the sun angle was most appropriate forspectral reflectance measurements. Subsequent to data collection,two sampling sites were determined to be statisticaloutliers when examining the data distribution <strong>and</strong> semiovariogram/covariancecloud for the field data collected. These twosites were considered to be in error <strong>and</strong> removed from the dataset for further analyses. The remaining field data werenormally distributed <strong>and</strong> included observations at 18 sites forchlorophyll content <strong>and</strong> LAI. Instruments used in the scientificfield data sampling included: Ocean Optics USB4000 FieldSpectroradiometer to measure in-situ spectral reflectance; LI-Journal of Coastal Research, Vol. 27, No. 3, 2011
<strong>Technology</strong> <strong>and</strong> <strong>Traditional</strong> Knowledge in Coastal Restoration Decisions 563COR LAI-2000 Plant Canopy Analyzer to measure relativemarsh biomass; <strong>and</strong> the FieldScout CM1000 Chlorophyll Meterto measure relative chlorophyll content.The Ocean Optics USB4000 spectroradiometer systemconsisted of two connected spectroradiometers. One measuresincoming sunlight <strong>and</strong> the other measures upwelling light froma target (,350–1045 nm, at ,0.2 nm resolution). A whitereference panel (made to reflect 99% of incoming radiation) wasalso used to calibrate reflectance measurements. The spectrometerswere operated using a ruggedized laptop <strong>and</strong> dataacquisitionsoftware. The simultaneous collection of upwelling<strong>and</strong> incoming radiation compensates for changes in lightingconditions between calibration <strong>and</strong> data collection.Top of canopy (TOC) reflectance measurements with theOcean Optics USB4000 system were made by mounting thefiber optic of the spectroradiometer on a pole to allow for thecollection of spectral reflectance data at an offset from theoperator. This minimizes any shadows or interference in datacollection by the user <strong>and</strong> allows data to be collected from thetop of the vegetation canopy. This configuration results in anapproximate 27 inch instantaneous field of view (IFOV). Threereflectance measurements were made within a target datacollectionarea (DCA) of 10 m 2 <strong>and</strong> then averaged for eachsampling site. One calibration measurement with the whitereference panel was also made at each sampling location.The LAI-2000 Plant Canopy Analyzer measures the probabilityof seeing the sky looking up through a vegetative canopyin different directions. Using these measurements, the LAI-2000 calculates foliage amount (LAI) <strong>and</strong> foliage orientation(mean foliage tilt angle) by measuring the rate at whichradiation is attenuated as it passes through the canopy. TheLAI calculations require measurements above canopy periodicallyto calculate total transmittance at the time that belowcanopymeasurements are made. In this manner, the LAIreadings are calibrated for atmospheric conditions. If skyconditions are stable, one above-canopy measurement willsuffice for several subsequent below-canopy measurements(LAI-2000, 1992). For this study, one above-canopy measurementwas made for every four below-canopy measurements. Ateach sampling site, three separate above/below-canopy samplingsequences were made <strong>and</strong> averaged within a 10 3 10 marea.The FieldScout CM1000 Chlorophyll Meter senses light atwavelengths of 700 nm <strong>and</strong> 840 nm to estimate chlorophyllcontent in leaves (Spectrum Technologies, 2008). Chlorophyll aabsorbs 700 nm light, <strong>and</strong>, as a result, the reflection of thatwavelength from a leaf is reduced compared to the reflected840 nm light. Light having a wavelength of 840 nm isunaffected by leaf chlorophyll content <strong>and</strong> serves as anindication of the amount of light that is reflected due to leafphysical characteristics. As each measurement is taken, theresult is displayed as an index with a range of 0 to 999. Thisindex is based on the ratio of 700 nm light to 840 nm lightreflected from the target, multiplied by a constant. A st<strong>and</strong>ardmethod was used to obtain measurements with the CM1000that included taking readings with the sun always at the user’sback <strong>and</strong> at an angle of approximately 45u between the user <strong>and</strong>the target. Five CM1000 measurements were taken within a 103 10 m area <strong>and</strong> averaged at each sampling location.Image CalibrationThe field data collected with the Ocean Optics USB4000 atthe predefined sampling sites throughout the study areaoccurred on November 2, 2009, <strong>and</strong> were the basis foratmospheric correction of the October 30, 2009, image dataset acquired for this project. The DCA of the field data collectedat each sampling site approximates an area that includes fourcontiguous pixel values extracted <strong>and</strong> averaged from the imagedata set. Image calibration was performed using an empiricalline calibration (ELC) between the reflectance values for thefield spectroradiometer at each sampling site <strong>and</strong> the values forthe same sites retrieved from the imagery. The ELC method ofcalibration matches the spectral reflectance of remotely sensedimages to in-situ spectral reflectance measurements obtainedat approximately the same time as the remote-sensingoverflight (Jensen, 2004). The in-situ <strong>and</strong> remote-sensing–derived spectra were regressed, <strong>and</strong> the values were thenapplied to the remote-sensor data on a b<strong>and</strong>-by-b<strong>and</strong> basis,removing atmospheric attenuation (Jensen, 2004). Regressionanalysis was performed between the averaged Ocean Opticsspectroradiometer reflectance values <strong>and</strong> the averaged rawdigital number (DN) values at each 10 3 10 m sampling site foreach Quickbird b<strong>and</strong>. The results are as follows (values are R 2<strong>and</strong> st<strong>and</strong>ard error, respectively): B<strong>and</strong> 1—0.99/0.74; B<strong>and</strong> 2—0.99/0.91; B<strong>and</strong> 3—0.99/1.5; <strong>and</strong> B<strong>and</strong> 4—0.98/5.29.Estimated CM1000 <strong>and</strong> LAI MapsClouds were masked in the October 30, 2009, image asdescribed in the Preclassification Image-Processing Procedures.This ‘‘cloud mask’’ file was intersected with the original extent ofthe calibrated October 30, 2009, image to mask out the areasobscured by clouds for later analyses. Subsequently, a supervisedclassification <strong>and</strong> threshold process was performed on thecloud-masked image using the methods described previously.The resulting classes were recoded as either vegetation ornonvegetation. The nonvegetation areas were then masked outusing the same procedure as was used to mask out clouds. Thefinal calibrated, masked October 30, 2009, image data set wasused in developing the estimated LAI <strong>and</strong> chlorophyll maps.Several vegetation indices <strong>and</strong> b<strong>and</strong> combinations werederived based upon the averaged reflectance values extractedfrom the November 2, 2009 reflectance field data that matchedthe calibrated image data set for each b<strong>and</strong> at each samplingsite. The literature identifies several vegetation indices foundto be promising in mapping wetl<strong>and</strong> vegetative vigor as itrelates to chlorophyll content <strong>and</strong> LAI (Gitelson, 2004;McCarthy et al., 1993; Ozesmi <strong>and</strong> Bauer, 2002; Qi et al.,1994; Zhang et al., 1997). Therefore, the vegetation indicestested in this study included: the Normalized DifferenceVegetation Index; Ratio Vegetation Index; Green NormalizedDifference Vegetation Index; Atmospheric Resistant VegetationIndex; Modified Soil Adjusted Vegetation Index; ModifiedTriangular Vegetation Index; <strong>and</strong> Wide Dynamic RangeVegetation Index. These vegetation indices were statisticallyassessed for correlation with the ground information acquired.Each vegetation index was produced from the averaged fieldreflectance data that corresponded to each b<strong>and</strong> in the OctoberJournal of Coastal Research, Vol. 27, No. 3, 2011
564 Bethel et al.30, 2009, image. Also, each vegetation index was computed forthe calibrated, masked October 30, 2009, image data set. Thiswas done for the reflectance values at each sampling location.Each field data set (chlorophyll meter <strong>and</strong> LAI) was dividedinto a test <strong>and</strong> validation data set, so that the resultingestimated maps produced with the test data sets could beassessed for accuracy. Ten sampling sites were r<strong>and</strong>omlychosen as the test data set, <strong>and</strong> the remaining eight sites servedas the validation data set for each parameter estimated.Stepwise multiple regression <strong>and</strong> multiple correlationanalyses were performed on each test data set using SASsoftware (SAS Institute, 2002) to determine the best b<strong>and</strong>combination/vegetation index to use for each dependentvariable tested (chlorophyll meter <strong>and</strong> LAI values), <strong>and</strong> to testfor the presence of multicollinearity among the variables in theregression model (Cody <strong>and</strong> Smith, 1991). A statisticalregression analysis was performed to ensure that a relationshipexisted with the imagery, <strong>and</strong> given that relationship, theimage-processing technique determined to have the strongestrelationship with the field data collected was used to create theestimated chlorophyll meter <strong>and</strong> LAI maps. The parameterestimates for the regression equations chosen as the bestestimate for each dependent variable were applied to thecorresponding October 30, 2009, index image.The resulting vegetation index ranges for the estimatedchlorophyll content <strong>and</strong> LAI images were used to recode theimage into relative categories of vegetative health <strong>and</strong> producea classed ‘‘relative’’ marsh health map. The class thresholdvalues were determined based on statistical analyses of thevegetation index values across the study area <strong>and</strong> consultationwith OCPR project collaborators. As a result, a three-classNatural Breaks (Jenks) classification of the continuous datavalues for each estimated map was used for display <strong>and</strong> recodedas high, medium, <strong>and</strong> low relative marsh health classes.Fragmentation Map ProductionThe final l<strong>and</strong>-water image for each historical image datewas used to produce fragmentation maps. This was accomplishedwith the L<strong>and</strong>scape Fragmentation tool in ArcGIS 9.3,which testing has shown to be equivalent to procedures used byVogt et al. (2007). For the purposes of this study, l<strong>and</strong>scapefragmentation classes based upon research by Vogt et al. (2007)were used for mapping spatial patterns <strong>and</strong> further refined byconsultation with the collaborating OCPR scientists with theaim of creating a mapping product that could be easilyintegrated into their existing decision-support system. As aresult, the l<strong>and</strong> class in each image was further classified intosix categories: perforated, edge, patch, small core (,250 acres),medium core (between 250 <strong>and</strong> 500 acres), <strong>and</strong> large core (.500acres). An edge width parameter was specified as 15 m. Theliterature indicates that the edge width varies according to theissue of interest (Riiters et al., 2000; Vogt et al., 2009). This edgeeffect distance was chosen after testing several different valuesfor this parameter, <strong>and</strong> based on visual examinations of theresulting fragmentation maps <strong>and</strong> input data sets, it wasdecided that 15 m represented the optimum distance for edgeeffectinfluence for this data set.The fragmentation maps were then combined in ArcGIS 9.3with the corresponding historical l<strong>and</strong>-change image. Forinstance, the 2009 fragmentation map was combined with the2005–09 l<strong>and</strong>-change image. The resulting combined imagesshow areas where the l<strong>and</strong>-loss class intersects the fragmentationclasses. These areas of intersection were then reclassedin the combined images as: patch to l<strong>and</strong> loss; edge to l<strong>and</strong> loss;perforated to l<strong>and</strong> loss; core 1 to l<strong>and</strong> loss; core 2 to l<strong>and</strong> loss;<strong>and</strong> core 3 to l<strong>and</strong> loss. Area was calculated for each of theseclasses in the combined image, <strong>and</strong> then the proportion of thetotal area that went to l<strong>and</strong> loss was calculated for eachfragmentation class for each historical image date.The proportions of each fragmentation class that went tol<strong>and</strong> loss for each date were statistically analyzed in SAS with aGeneral Linear Model (GLM) to determine any significantdifference that existing among the l<strong>and</strong>-loss proportions of thefragmentation classes. A Duncan’s multiple comparison testwas performed to further investigate any differences existingbetween the fragmentation classes (Cody <strong>and</strong> Smith, 1991).Historical ChangeRESULTSSix final change maps were produced depicting the transitionalarea class, as well as actual l<strong>and</strong>-loss <strong>and</strong> actual l<strong>and</strong>-gainclasses. For each of these maps, the total area in hectares (<strong>and</strong>acres) was calculated for each class. Net l<strong>and</strong> loss <strong>and</strong> theaverage l<strong>and</strong> loss per year were then calculated for each timeperiod represented. The results for each composite map areshown in Table 2, <strong>and</strong> Figure 3 shows a composite map thatrepresents actual l<strong>and</strong> loss for each of six change maps produced.The l<strong>and</strong>-to-water ratio was calculated for each l<strong>and</strong>-waterclassification date. The results show that the proportion of l<strong>and</strong>to water in the study area consistently decreased from 1968 to2009. The proportion of total l<strong>and</strong> to total water in the studyarea can be summarized as follows: 2.62 in 1968; 1.57 in 1979;0.79 in 1991; 0.71 in 1998; 0.65 in 2004; 0.61 in 2005; <strong>and</strong> 0.48 in2009. The proportion of total l<strong>and</strong> to water area for eachhistorical image date is shown in Figure 4.TEK-Based Mapping ResultsThe intercoder reliability assessment for the coded transcriptsresulted in a 98% overall agreement between the twocoders in assigning codes to 20 r<strong>and</strong>omly selected text segmentsfrom the transcribed TEK data sets. This finding strengthensthe validity of the coding results, as well as the conclusionsbased on the coded text data, <strong>and</strong> demonstrates that subjectivityin the coding process was minimized.Identification of specific areas of concern was difficult forsome informants because they emphasized that the entirestudy area was vital <strong>and</strong> contributed to their safety <strong>and</strong>lifestyle sustainability. Specifically, they rely on the health ofthe entire marsh for protection during hurricanes <strong>and</strong> tropicalstorms <strong>and</strong> as their primary means of sustaining themselvesthrough shrimping, oystering, <strong>and</strong> fishing. It was emphasizedthat every area is important to restore because the wholeecosystem works together. Therefore, the reader should notassume that a low-priority area should not be addressed. Theentire area represented on the RP map <strong>and</strong> beyond has beenJournal of Coastal Research, Vol. 27, No. 3, 2011
<strong>Technology</strong> <strong>and</strong> <strong>Traditional</strong> Knowledge in Coastal Restoration Decisions 565Table 2.L<strong>and</strong> loss by time periods <strong>and</strong> hurricanes that passed within 65 miles of study area.Time PeriodActual L<strong>and</strong> Loss inHectares (acres)Actual L<strong>and</strong> Gain inHectares (acres)Hurricane EventNet L<strong>and</strong> Loss inHectares (acres)Average L<strong>and</strong> Loss PerYear in Hectares (acres)11/25/1968–03/26/1979(,10 y, 4 mo) 711 (1758) 148 (367) .Camille 563 (1391) 69 (170)03/26/1979–11/05/1991(,12 y, 7 mo) 1042 (2574) 148 (367) .Bob, Florence 894 (2208) 83 (205)11/05/1991–01/24/1998(,6 y, 3 mo) 392 (969) 243 (600) .Danny 149 (369) 63 (155)01/24/1998–01/21/2004(,6 y) 288 (711) 167 (413) .Georges 121 (298) 48 (119)01/24/2004–10/27/2005(,1 y, 9 mo) 343 (848) 199 (491) .Ivan, Cindy, Katrina 144 (357) 196 (484)10/27/2005–11/12/2009(, 4 y) 397 (980) 62 (154) .Gustav 335 (826) 99 (245)identified by the community as in need of restoration. However,within that guideline, researchers ranked locations (for boththe Restoration Priority <strong>and</strong> Observed Change indices) giventhe context of informants’ responses using the numeric codingprocess described previously <strong>and</strong> assuming limited resourcesavailable for restoration. It was then concluded that the areasthe community could not live without—their village <strong>and</strong> theirsacred burial site, would represent the upper limit. Theresulting TEK-based maps were presented to the informantsto ensure that the TEK information was represented properly.In this manner, the maps were validated as accuraterepresentations of the TEK.The construction of the canals (primarily for oil extraction) inthe study area from the 1950s to the 1970s emerged as the mostfrequently mentioned cause of the l<strong>and</strong> loss observed whenanalyzing the TEK. The informants accept that some l<strong>and</strong> lossis due to natural processes, such as wave <strong>and</strong> tidal action, <strong>and</strong>that it also results from episodic storm events. However, theyhave observed that the average rate of l<strong>and</strong> loss due to thesenatural erosion processes was greatly accelerated by theconstruction of the canals.Throughout the discussions with the Gr<strong>and</strong> Bayou residents,they frequently offered local restoration <strong>and</strong> mediation proposalsthat they believe could reverse the l<strong>and</strong>-loss trends inthe area. The residents’ accounts show that they do believe thatthe rate of l<strong>and</strong> loss can be slowed, <strong>and</strong> they have hope ofreversing some of the damage done to the local ecosystem uponwhich they depend; however, they expressed little faith in thecurrent restoration policies <strong>and</strong> programs of authorities. Theirskepticism is based on their experience that scientists <strong>and</strong>restoration managers currently fail to consider their suggestions<strong>and</strong> knowledge when planning <strong>and</strong> implementing localrestoration projects.Estimated Chlorophyll <strong>and</strong> LAI Map Production ResultsThe results of the statistical analysis indicate that the bestmodel for estimating chlorophyll meter values is a GVI (greenvegetation index) with the following parameter estimates:intercept 5 127.94741, <strong>and</strong> slope 5 217.98764. The R 2 for thismodel is 0.47 <strong>and</strong> is significant, with a P-value of 0.0278. Anoise-reduction filter was applied to the resulting estimatedFigure 3. Actual l<strong>and</strong> loss from November 15, 1968, to November 12,2009, by time periods calculated for this study using historical aerial <strong>and</strong>satellite imagery.Figure 4. Graph of proportion of total l<strong>and</strong> to water area within theGr<strong>and</strong> Bayou study area for each date of historical image data used.Journal of Coastal Research, Vol. 27, No. 3, 2011
566 Bethel et al.chlorophyll meter map. The st<strong>and</strong>ard error resulting from theregression of predicted versus actual values was 31.64.The best model for producing the estimated LAI map is anMTV12 (modified triangular vegetation index) with thefollowing parameter estimates: intercept 5 21.84060, <strong>and</strong>slope 5 6.19449. The R 2 value for this model is 0.59 <strong>and</strong> issignificant, with a P-value of 0.0098. A noise-reduction filterwas also applied to the resulting estimated LAI map. Thest<strong>and</strong>ard error resulting from the regression of predictedversus actual values was 0.68.The parameter estimates for each dependent variable wereapplied to the corresponding October 30, 2009, vegetation indeximage. The resulting index ranges for the estimated chlorophyllcontent <strong>and</strong> LAI images were used to recode the imageinto relative categories <strong>and</strong> produce classed ‘‘relative’’ marshcondition maps. The chlorophyll content <strong>and</strong> LAI classthreshold values were determined based on statistical analysesof the vegetation index values across the study area <strong>and</strong>subsequent consultation with OCPR project collaborators. Asstated previously, the continuous data values for eachestimated map was used for display <strong>and</strong> recoded as high,medium, <strong>and</strong> low relative marsh health classes.Due to delay of field data collection because of persistentadverse weather conditions coinciding with image-acquisitionavailability, it should be noted that the chlorophyll meter <strong>and</strong>LAI measurements were collected at a time when the marshvegetation was nearing fall senescence. The ‘‘browning’’ of themarsh vegetation just prior to fall senescence was visible incertain areas, depending on the dominant marsh vegetationvarieties for a particular location. It is expected that thisvariability in natural senescence occurring at the time of fieldsampling contributed to the variability in vegetative stressmeasured <strong>and</strong> mapped.Fragmentation Map Production ResultsThe results of the GLM statistical analysis showed that themodel was significant, with an F-value of 13.38 (df 5 3), <strong>and</strong>Pr . F 5,0.0001. The Duncan’s multiple range test (alpha 50.05) showed that the Patch class was significantly more likelyto be lost than any other class. While the Edge class wassignificantly more likely to be lost than the Core class, it wasnot significantly different from the Perforated class. The Coreclass was significantly less likely to be lost than were eitherPatch or Edge areas but was not significantly different fromPerforated areas.As a result of this analysis, the 2009 fragmentation map wasrecoded as follows: Patch class 5 high risk of loss; Edge class 5mediumriskofloss;<strong>and</strong>Perforated<strong>and</strong>Coreareaswerecombinedto make up low-risk areas of loss. This recoded three-class fragmentationmapwasthencombinedwiththeestimatedchlorophyllcontent <strong>and</strong> estimated LAI maps with the same classificationscheme to produce the final marsh vulnerability map.Merging the Scientific <strong>and</strong> TEK Data Sets to EnhanceCoastal Restoration Decision MakingTo combine the derived data sets to map relative risk of loss,the values of the derived data sets representing estimatedchlorophyll content, estimated LAI, <strong>and</strong> fragmentation classwere all reclassified to a common measurement scale (high,medium, <strong>and</strong> low risk of loss). Values representing water wererestricted from this analysis so that only marsh areas would beincluded. A weighted overlay was performed in ArcGIS 9.3,where the input data sets were assigned percentages ofinfluence. The higher the percentage, the more influence aparticular data set has in the resulting map. Because the initialTEK data collection indicated that the two main driving factorsrelated to l<strong>and</strong> loss in the study area were marsh vegetationhealth <strong>and</strong> marsh fragmentation, with no clear indication thatone factor was more dominant than the other, the estimatedchlorophyll content <strong>and</strong> LAI input data sets were eachweighted at 25%, <strong>and</strong> the fragmentation map was weightedat the remaining 50%. The input data sets were weighted inthis way so that the total weighting would be divided equallybetween the biophysical (chlorophyll content <strong>and</strong> LAI) <strong>and</strong>spatial relationship (fragmentation class) measurements.Pattern analysis was performed on the vulnerability mapproduced from the weighted overlay of the estimated chlorophyll<strong>and</strong> LAI maps with the 2009 fragmentation map todetermine significantly clustered areas of high l<strong>and</strong>-loss risk.This analysis was performed to determine the probability thatspatial clustering was not due to r<strong>and</strong>om chance. Cluster <strong>and</strong>outlier analysis was deemed necessary in order to providerestoration managers with information regarding high-riskareas that result, not from r<strong>and</strong>om environmental conditions orfrom error, but that are instead the result of drivingenvironmental variables. This data can be overlaid on otherdata sets to determine if a relationship exists between theidentified ‘‘hot spots’’ of high risk <strong>and</strong> areas of l<strong>and</strong> loss. Assuch, this information can be used to aid restoration decisionmaking <strong>and</strong> to further investigate causes of marsh degradationexperienced in this study area.The cluster <strong>and</strong> outlier analysis involved identifying clustersof features with similar values (in this case the three classvalues, low, medium, <strong>and</strong> high risk), as well as spatial outliers,using ArcGIS 9.3 to calculate a local Moran’s I value, a Z score,a p-value, <strong>and</strong> a code representing the cluster type for eachfeature. The output data set was queried for all areascorresponding to the high risk of loss class, <strong>and</strong> subsequentlyonly high-risk areas that were significantly clustered wereselected. The resulting selections were output as a separatefeature layer <strong>and</strong> overlaid on the marsh vulnerability map(Figure 5).Overlay of Marsh Vulnerability Map withTEK-Derived MapsGIS overlay, selection by attribute <strong>and</strong> location, <strong>and</strong>intersection operations were applied to the derived spatialdata sets (clustered high-risk areas for loss, the TEK-basedareas of observed change, <strong>and</strong> the TEK-based areas ofrestoration priority data layers) to generate detailed mapshighlighting areas of high risk that also represent highrestoration priorities for the community. This analysis wasdriven by three criteria: knowledge about risk of l<strong>and</strong> lossderived from scientific data <strong>and</strong> analyses; knowledge ofcommunity-based priorities for continued sustainability; <strong>and</strong>Journal of Coastal Research, Vol. 27, No. 3, 2011
<strong>Technology</strong> <strong>and</strong> <strong>Traditional</strong> Knowledge in Coastal Restoration Decisions 567Figure 6. Map result for a query of the integrated GIS showing clusteredhigh risk for loss marsh areas that are within areas of any TEK-basednegative OC <strong>and</strong> the TEK-based most important RP.identify where there is an urgent need for restoration or otherconservation action, <strong>and</strong> where the greatest restorationbenefits for the community can be achieved for a fixed level ofavailable financial resources.DISCUSSIONFigure 5. (A) Significantly clustered marsh areas of high risk to lossoverlaid on the marsh vulnerability map produced using the results of thebiophysical <strong>and</strong> fragmentation data set analyses. (B) Map showingsignificantly clustered marsh areas of high risk to loss enlarged to thevicinity of Gr<strong>and</strong> Bayou Village.knowledge of observed change at these priority areas as itrelates to the effect on natural resources <strong>and</strong> ecosystem healthon which the community relies. This GIS analysis allowed theresearchers to identify areas of concern, explore differentcriteria for selection of the most suitable areas for restoration,<strong>and</strong> rank areas at risk with regard to community concernwithin a geographical context. The final output consists of a setof digital maps showing optimal areas for strategic coastalrestoration activities based on the criteria selected. As anexample, the specific criteria for the final map shown inFigure 6 were: (1) areas that corresponded to the mostimportant restoration priority (RP) class; (2) areas thatcorresponded to both the extreme negative <strong>and</strong> negativeobserved change (OC) classes; <strong>and</strong> (3) areas that wereidentified as significantly clustered in high risk for loss. Whenthe criteria of the OC input were changed to include only areasof extreme negative observed change, the final map thatresulted was modified to show only the clustered high risk ofloss areas that met the new criteria. This modification of theinput criteria narrowed the output selection areas to theimmediate vicinity of Gr<strong>and</strong> Bayou Village. The selected areaswere exported to a new data layer so that this information canbe used with other maps <strong>and</strong> data sets. These selected areasL<strong>and</strong> loss in the study area was persistent through all timeperiods observed. There are many driving factors contributingto the l<strong>and</strong> loss detailed in this study, including: naturallyoccurring subsidence; implementation of the Mississippi Riverlevee system, which halted the river’s seasonal overbankflooding that naturally deposited sediment to counteractsubsidence; <strong>and</strong> the construction of a network of oilfield canalsinto the project area (Boshart <strong>and</strong> MacInnes, 2000). Also, amajor factor of l<strong>and</strong> loss for this area can be attributed to theperiodic impacts of storms such as those listed in Table 2,which, according to the related TEK collected, uprootedvegetation <strong>and</strong> formed areas of broken marsh. The new inlets<strong>and</strong> exp<strong>and</strong>ed waterways allowed increasing tidal exchange<strong>and</strong> greater salinity fluctuations, which created a stressfulhabitat for historical vegetation that was less tolerant of theseconditions. The degraded vegetation cover further contributedto wetl<strong>and</strong> loss by facilitating erosion (Weller, 1994). Thus,weaker marsh areas eroded more easily with regular tidalaction or occasional tropical storm activity.The majority of the l<strong>and</strong> loss in the study area over the timeperiod studied occurred prior to 1991. The greatest amount ofl<strong>and</strong> loss in this area for the time periods studied was observedfrom 1979 to 1991. Rates of l<strong>and</strong> loss dropped dramatically after1991 <strong>and</strong> remained relatively stable in the time periodsobserved through 2005. The l<strong>and</strong> lost between 2005 <strong>and</strong> 2009indicated a slight increase in the trend of l<strong>and</strong> loss observed forthe previous three time periods beginning in 1991. These l<strong>and</strong>losstrends are reflected in the graph of proportion of total l<strong>and</strong>area to total water area over the time periods studied(Figure 4). Based on the detailed l<strong>and</strong>-change analysis, it wasdetermined that the study area has undergone a complexmorphological evolution that includes large core areas of once-Journal of Coastal Research, Vol. 27, No. 3, 2011
568 Bethel et al.unbroken marsh being perforated with small ponds, leading toa significant increase in broken or patchy marsh areas thateventually were lost to open water. This fragmentation <strong>and</strong> losspattern was observed throughout the time period investigated.The l<strong>and</strong>-change assessment methods developed for thisstudy provide the most detailed assessment of l<strong>and</strong>scapeevolution to current conditions for this area as a basis for amulti–data set integrated restoration decision-support system.This model provides restoration managers with a means bywhich to introduce l<strong>and</strong>scape pattern <strong>and</strong> marsh biophysicalparameters associated with plant health into a discussion thatis now typically dominated by statistics on the amount of l<strong>and</strong>lost for a given area. The model used to create the marshvulnerability map can be used to evaluate an area in detail forrestoration potential. This methodology demonstrates howscientific field sampling data can be effectively merged within aGIS with information on l<strong>and</strong>scape pattern <strong>and</strong> trends in orderto make marsh vulnerability projections within a spatialcontext. Furthermore, this methodology is presented as aflexible tool within an image-processing/GIS environment thatallows for biophysical <strong>and</strong> l<strong>and</strong>scape fragmentation variablesto be adapted or replaced according to a particular user’s needs<strong>and</strong> the availability of data sets related to these two variables.Community-based indices that are calculated from numericallycoded TEK themes provide a data set that can be used tocreate a GIS to map locations <strong>and</strong> features <strong>and</strong> to representtheir associated attributes as derived from TEK. This TEKmapping method allows for a straightforward verification bythe informants of the ways in which the TEK was used in thisstudy in a format that facilitates easy assessment. The mapformat is also conducive to inclusion <strong>and</strong> integration of TEKinto the restoration decision-making process. Currently, TEKis not utilized in restoration planning or adaptive managementof current restoration projects. This is due, in part, to a lack ofunderst<strong>and</strong>ing on the part of restoration scientists <strong>and</strong>engineers of ways in which qualitative TEK data sets can beintegrated with quantitative data to support restorationdecision making. The coding methods <strong>and</strong> TEK mappingproducts produced in this study provide a repeatable solutionfor incorporating the wealth of local knowledge with scientificdata sets, including the historical <strong>and</strong> projected l<strong>and</strong>-loss mapsderived with geospatial technologies that are currently used byrestoration managers <strong>and</strong> scientists.To ensure acceptance of the TEK/scientific data integrationmethods produced in this study, the researchers attempted toaddress typical scientific concerns while incorporating TEK.First, this research ensured that the TEK information obtainedfor this study involved repeated observations of field sites byseveral different individual informants to reduce the impact ofany information bias. As a result, the information obtainedfrom any one informant did not dominate the ‘‘coded’’information that was mapped <strong>and</strong> integrated with the scientificdata collected.Second, TEK data verification <strong>and</strong> validation procedureswere included in the data-collection <strong>and</strong> integration methodsdeveloped for this study. These procedures included meetingwith the informants interviewed to review recorded <strong>and</strong>summarized information from which subsequent inferenceswere drawn regarding project questions. This was done toensure that the TEK was recorded <strong>and</strong> interpreted accuratelyduring the interviews. Verification <strong>and</strong> validation exercisesalso served as opportunities for the research team to show thecommunity informants the scientific data <strong>and</strong> TEK collected,thus providing transparency in our efforts.Third, although the methods developed in this study focus onblending the TEK of the Gr<strong>and</strong> Bayou community informantswith scientific data sets, these methods are generally ‘‘repeatable,’’or applicable, to any proposed or ongoing restorationproject that impacts a community where the population has along history of being intricately tied to the surroundingecosystem. This situation is the case with many of Louisiana’scoastal fishing villages, as well as fishing communitiesthroughout the Gulf Coast. Thus, the integration methodology,as proposed, is not specific to Gr<strong>and</strong> Bayou <strong>and</strong> can be appliedto other areas with similar issues.Last, in working with the residents as collaborators on thisproject, they have become more familiar with the capabilities<strong>and</strong> limitations of remotely sensed imagery, <strong>and</strong> thus are ableto make more informed recommendations based on thistechnology. Every time the researchers visited Gr<strong>and</strong> Bayou,maps generated from remotely sensed imagery were left withthe residents, <strong>and</strong> the researchers made an effort to explainhow the maps were produced. The researchers have alsofostered a relationship between community residents <strong>and</strong> thecollaborating OCPR scientists associated with monitoring thestudy area. This relationship was nonexistent prior to thisstudy.Sources of Possible ErrorThere are small areas of l<strong>and</strong> gain in the l<strong>and</strong>-change mapsthroughout the time frame studied. This l<strong>and</strong> gain is mostlikely due to sediment reworking during storm events <strong>and</strong> thedeposition of wrack material, which fills up small ponds <strong>and</strong>previously shallow submerged areas. There could also be someclassification errors due to the presence of aquatic vegetation,such as water hyacinth, as l<strong>and</strong>; however, all images used wereacquired during fall through early spring to minimize thepresence of floating aquatic vegetation that would have causedconfusion in l<strong>and</strong>/water discrimination (Barras et al., 2003).There are also errors with l<strong>and</strong>-water classifications resultingfrom sun glint <strong>and</strong> image data-quality issues, which likelycontribute to some misclassification of l<strong>and</strong> gain.The chlorophyll meter <strong>and</strong> LAI measurements were collectedlate in the growing season (late October to early November) at atime when natural senescence was occurring in the marshvegetation. This time frame was not ideal for data collectionrelated to marsh health, given that vegetative stress measuredcould be due to natural plant phenology in this area. Forreasons beyond the control of the research team, image dataacquisition was delayed until October 30, 2009, necessitatingthe delay of concurrent field vegetation measurements.The main weaknesses of the approach to modeling marshvulnerability suggested in this research include: the difficultyof separating the correlation between marsh vulnerability <strong>and</strong>the parameters tested from causality of loss; the difficulty ofdetermining the direction of causality; <strong>and</strong> the limitationsinherent in integrating only chlorophyll content, LAI, <strong>and</strong>Journal of Coastal Research, Vol. 27, No. 3, 2011
<strong>Technology</strong> <strong>and</strong> <strong>Traditional</strong> Knowledge in Coastal Restoration Decisions 569l<strong>and</strong>scape fragmentation characteristics into a model for marshvulnerability, while ignoring other variables that possibly playkey roles in the l<strong>and</strong>-loss process. This analysis therefore onlyprovides a prediction of vulnerability from three specific inputdata sets related to marsh vegetative health, spatial orientation,<strong>and</strong> proximity to water, an approach which should becomplemented by other relevant data sets before a comprehensiveunderst<strong>and</strong>ing of marsh vulnerability to loss for this areacan be achieved. Other data sets currently collected <strong>and</strong> used inthe restoration decision-making process that could prove usefulfor inclusion into this model include hydrologic informationrelated to salinity, water level, turbidity, etc. However, themodel developed in this analysis allows for the inclusion ofadditional variables representing key influences in l<strong>and</strong>change in future marsh vulnerability analyses.The TEK-based indices were created in order to increaseaccessibility of this TEK data to restoration decision makers.Following input from collaborating OCPR scientists, it wasdetermined that a visual representation of observed l<strong>and</strong>-loss<strong>and</strong> priority restoration areas would be more likely utilized inthe current restoration process than similar information in textformat. The researchers were privileged to witness elaborate,multidimensional storytelling, much of which comprised theTEK collection. We do not propose to represent this traditionalpractice of storytelling or encompass the complete wealth ofTEK collected within these maps, but rather to bridge the gapbetween the restoration decision-making process <strong>and</strong> TEK byrepresenting two important community-based attributes (observedchange <strong>and</strong> restoration priority) about features <strong>and</strong>locations that emerged from the TEK.Suggestions for Future ResearchThe development of the methods <strong>and</strong> GIS tools implementedin this study <strong>and</strong> the improved underst<strong>and</strong>ing of the ways inwhich TEK can be merged with scientific data sets to informrestoration decision making illustrate that numerous unansweredquestions regarding benefit <strong>and</strong> cost aspects ofknowledge integration <strong>and</strong> application for coastal restorationexist. Moreover, in order to fully test <strong>and</strong> further develop themethods <strong>and</strong> mapping products presented in this study, theresults should be applied to other vulnerable coastal ecosystemsthat serve as livelihood bases for coastal communities.The following is a summary of proposed future directions thatmight exp<strong>and</strong> upon the findings of this study:(1) Continuing detailed monitoring of the morphology of theGr<strong>and</strong> Bayou area is needed in order to determineeffectiveness <strong>and</strong> impacts of the current <strong>and</strong> proposedrestoration projects on the ecosystem, to better underst<strong>and</strong>long-term versus short-term (i.e., episodic stormrelated) l<strong>and</strong>-loss trends, <strong>and</strong> to document changes forcomparison to projected vulnerability identified in thisresearch.(2) Possible major causes of l<strong>and</strong> loss identified in this studyshould be monitored, including oil canals, throughsubsequent research focusing on future data collection<strong>and</strong> analyses in an effort to quantify their effects.(3) Incorporation of economic analyses is needed to determinethe cost/benefit ratio associated with incorporatingthis type of integrated data set into the current process asa means of justifying the additional time <strong>and</strong> cost, whichmay preclude it from being utilized more frequently byrestoration scientists. If supportive results can beachieved, there will be a compelling precedent forscientists to view more favorably utilizing such a method.(4) New data sets of the marsh biophysical parameters fromfield data acquired during the peak of the growing seasonshould be integrated, <strong>and</strong> then the marsh biophysicalestimated mapping process should be repeated to includethe new data sets. This will allow for comparison with thebiophysical mapping results of this study <strong>and</strong> mayimprove the assessment of relative marsh health forinclusion into a revised vulnerability assessment.(5) New remotely sensed data products with greater spectralresolution should be integrated into the mapping processesdescribed in this study in an attempt to improvecorrelation with field data. Additional research may befacilitated by better availability <strong>and</strong> reduced cost of finerresolutionremotely sensed satellite data as more remotesensingdata options become available to researchers.CONCLUSIONSA review of the current restoration decision-support processshows that the methodologies <strong>and</strong> GIS tools produced <strong>and</strong> usedin this study are suitable for inclusion into the projectprioritization process utilized by OCPR. In addition, the dataproducts generated can inform the process <strong>and</strong> influence theresults with meaningful, new information that is gearedtoward meeting localized needs rather than regionally basedcriteria. This study demonstrates that once hot spots of l<strong>and</strong>loss are identified on a regional scale <strong>and</strong> further prioritizationis needed for selection of restoration projects on a local level, theinformation made available through the methodologies <strong>and</strong>tools used in this study can be included with other criteria, suchas cost estimates, to make more informed restoration decisions.L<strong>and</strong> loss in the vicinity of Gr<strong>and</strong> Bayou, <strong>and</strong> throughoutcoastal Louisiana, results from a complicated set of environmental<strong>and</strong> anthropogenic causes, which include canal dredging;subsidence; erosion; storms; levees; <strong>and</strong> even climatechange (Bernier, Morton, <strong>and</strong> Barras, 2006; Michot, Wells, <strong>and</strong>Kemmerer, 2004; Penl<strong>and</strong> et al., 1996; Turner, 1997; Walker etal., 1987). Because of its complexity, isolating specific causes<strong>and</strong> trends of l<strong>and</strong> loss in the study area is a daunting taskgiven limited funding <strong>and</strong> resources. However, an advantage ofworking closely with local residents <strong>and</strong> utilizing TEK is thatthe study focus can be effectively narrowed to identify the likelymajor causes of local l<strong>and</strong> loss <strong>and</strong> to shape the investigationaccordingly. In analyzing the TEK obtained for this study, anemphasis was placed by the community informants on theeffects of oil company–constructed canals, which dominate thestudy area today. Secondary ecological effects that resultedfrom the construction of these canals are noted in the TEK asallowing saltwater intrusion <strong>and</strong> natural hydrological flowalteration, which in turn accelerated the l<strong>and</strong> loss observed.Furthermore, the TEK analyses identified a time line forJournal of Coastal Research, Vol. 27, No. 3, 2011
<strong>Technology</strong> <strong>and</strong> <strong>Traditional</strong> Knowledge in Coastal Restoration Decisions 571Dunbar, J.B.; Britsch, L.D., <strong>and</strong> Kemp, E.B., 1992. L<strong>and</strong> Loss Rates,Report 3, Louisiana Coastal Plain. U.S. Army Engineers District,New Orleans, Technical Report GL-90-2, 28p.ESRI (Environmental Systems Research Institute), 2010. ArcGISGeoprocessing Resource Centers, L<strong>and</strong>scape Fragmentation Toolhelp documentation. http://resources.esri.com/geoprocessing/index.cfm?fa5codeGalleryDetails&scriptID516793 (accessed April 1,2010).Ferguson, M.A. <strong>and</strong> Messier, F., 1997. Collection <strong>and</strong> analysis oftraditional ecological knowledge about a population of Arctic tundracaribou. Arctic, 50(1), 17–28.Folse, T.M.; West, J.L.; Hymel, M.K.; Troutman, J.P.; Sharp, L.;Weifenbach, D.; McGinnis, T., <strong>and</strong> Rodrigue, L.B., 2008. A St<strong>and</strong>ardOperating Procedures Manual for the Coast-wide ReferenceMonitoring System—Wetl<strong>and</strong>s: Methods for Site Establishment,Data Collection, <strong>and</strong> Quality Assurance/Quality Control. BatonRouge, Louisiana: Louisiana Coastal Protection <strong>and</strong> RestorationAuthority, Office of Coastal Protection <strong>and</strong> Restoration, 191p.Freudenburg, W.R.; Gramling, R.; Laska, S., <strong>and</strong> Erikson, K.T., 2009.Catastrophe in the Making: The Engineering of Katrina <strong>and</strong> theDisasters of Tomorrow. Washington, DC: Isl<strong>and</strong> Press, 170p.Gergel, S.E. <strong>and</strong> Turner, M.G., 2003. Learning L<strong>and</strong>scapeEcology: A Practical Guide to Concepts <strong>and</strong> Techniques. New York:Springer-Verlag, 316p.Gitelson, A.A., 2004. Wide dynamic range vegetation index for remotequantification of biophysical characteristics of vegetation. Journalof Plant Physiology, 161, 165–173.Gramling, R. <strong>and</strong> Hagelman, R., 2005. A working coast: people in theLouisiana wetl<strong>and</strong>s. Journal of Coastal Research, Special IssueNo. 44, pp. 112–133.Gustafson, E.J., 1998. Quantifying l<strong>and</strong>scape spatial pattern: what isthe state of the art? Ecosystems, 1, 143–156.Hruschka, D.J.; Schwartz, D.; St. John, D.C.; Picone-Decaro, E.;Jenkins, R.A., <strong>and</strong> Carey J.W., 2004. Reliability in coding openendeddata: lessons learned from HIV behavioral research. FieldMethods, 16(3), 307–331.Huntington, H.P., 2000. Using traditional ecological knowledge inscience: methods <strong>and</strong> applications. <strong>Ecological</strong> Applications, 10(5),1270–1274.Jensen, J.R., 2004. Introductory Digital Image Processing, 3 rd edition.Upper Saddle River, New Jersey: Prentice Hall, 526p.Jensen, J.R.; Ramsey, E.W.; Mackey, H.E., Jr.; Christensen, E.J., <strong>and</strong>Sharitz, R.R., 1987. Inl<strong>and</strong> wetl<strong>and</strong> change detection using aircraftMSS data. Photogrammetric Engineering <strong>and</strong> Remote Sensing, 53,521–529.Kurasaki, K.S., 2000. Intercoder reliability for validating conclusionsdrawn from open-ended interview data. Field Methods, 12(3), 179–194.LaCoast, 2008. CWPPRA Restoration Status. http://www.lacoast.gov/reports/rtc/1997/7.htm (accessed April 1, 2010).LAI-2000, 1992. LAI-2000 Plant Canopy Analyzer InstructionManual. Lincoln, Nebraska: LI-COR, Inc., 179p.Louisiana Coastal Area Science <strong>and</strong> <strong>Technology</strong> Program (LCA S&T),2010. Summary Report of the January 13–15, 2010, Meeting. NewOrleans: Louisiana Coastal Area Science <strong>and</strong> <strong>Technology</strong> Program,16p.Manning, S.C., 2005. Riding out the Risks: An Ethnographic Study ofRisk Perceptions in a South Louisiana Bayou Community. BatonRouge, Louisiana: Louisiana State University <strong>and</strong> Agricultural <strong>and</strong>Mechanical College, Department of Environmental Studies, Masterof Science thesis, 125p.McCarthy, T.S.; Franey, N.J.; Ellery, W.N., <strong>and</strong> Ellery, K., 1993. Theuse of SPOT imagery in the study of environmental processes of theOkavango Delta, Botswana. South African Journal of Sciences, 89,432–436.Michot, T.C.; Wells, C.J., <strong>and</strong> Kemmerer, R.S., 2004. Spatial <strong>and</strong>Temporal Distribution of Coastal Marsh Dieback in Louisiana,2000–2003, as Determined from Aerial Surveys. Coastal RestorationDivision, Louisiana Department of Natural Resources TechnicalReport for DNR Contract Number 2512-05-03, 60p.Mitsch, W.J. <strong>and</strong> Gosselink, J.G., 2007. Wetl<strong>and</strong>s, 4 th edition.Hoboken, New Jersey: John Wiley & Sons, Inc., 600p.Nilsson, H.E., 1995. Remote sensing <strong>and</strong> image analysis in plantpathology. Annual Review of Phytopathology, 15, 489–527.Ozesmi, S.L. <strong>and</strong> Bauer, M.E., 2002. Satellite remote sensing ofwetl<strong>and</strong>s. Wetl<strong>and</strong>s Ecology <strong>and</strong> Management, 10, 381–402.Patton, M.Q., 1990. Qualitative Evaluation <strong>and</strong> Research Methods,2nd edition. Newbury Park, California: Sage, 531p.Penl<strong>and</strong>, S.; Mendelssohn, I.; Wayne, L., <strong>and</strong> Britsch, D., 1996.Natural <strong>and</strong> Human Causes of Coastal L<strong>and</strong> Loss in Louisiana.Baton Rouge, Louisiana: Coastal Studies Institute <strong>and</strong> Wetl<strong>and</strong>Biogeochemistry Institute, Louisiana State University, 25p.Petch, J.P.; Pauknerova, E., <strong>and</strong> Heywood, D.I., 1995. A strategy forGIS in nature conservation: the Zdarske Vrchy project. InternationalInstitute for Geo-Information Science <strong>and</strong> Earth Observation(ITC) Journal, 2, 133–142.Qi, J.; Chehbouni, A.; Huete, A.R., <strong>and</strong> Kerr, Y.H., 1994. Modified SoilAdjusted Vegetation Index (MSAVI). Remote Sensing of theEnvironment, 48, 119–126.Riiters, K.; Wickham, J.; O’Neill, R.; Jones, B., <strong>and</strong> Smith, E., 2000.Global-scale patterns of forest fragmentation. Conservation Ecology,4(2), 3.SAS Institute, Inc., 2002. SAS/STAT Users Guide, version 9.2. Cary,North Carolina: SAS Institute Inc.Spectrum Technologies, Inc., 2008. FieldScout CM1000 ChlorophyllMeter. http://www.specmeters.com/Chlorophyll_Meters/CM_1000_Chlorophyll_Meter.html (accessed April 1, 2010).Steyer, G.D.; Raynie, R.C.; Steller, D.L.; Fuller, D., <strong>and</strong> Swenson, E.,2000. Quality Management Plan for Coastal Wetl<strong>and</strong>s Planning,Protection, <strong>and</strong> Restoration Act-Monitoring Program. LouisianaDepartment of Natural Resources, Coastal Restoration DivisionOpen-File Report 95-01, 112p.Turner, M.G. <strong>and</strong> Gardner, R.H., 1991. Quantitative Methods inl<strong>and</strong>scape ecology. New York: Springer-Verlag, 527p.Turner, M.G.; Gardner, R.H., <strong>and</strong> O’Neill, R.V., 2003. L<strong>and</strong>scapeEcology in Theory <strong>and</strong> Practice: Pattern <strong>and</strong> Process. New York:Springer-Verlag, 401p.Turner, R.E., 1997. Wetl<strong>and</strong> loss in the northern Gulf of Mexico:multiple working hypotheses. Estuaries, 20(1), 1–13.Vigier, B.J.; Pattey, E., <strong>and</strong> Strachan, I.B., 2004. Narrowb<strong>and</strong>vegetation indexes <strong>and</strong> detection of disease damage in soybeans.IEEE Geoscience <strong>and</strong> Remote Sensing Letters, 1(4), 255–259.Vogt, P.; Ferrari, J.R.; Lookingbill, T.R.; Gardner, R.H.; Riiters, K.H.,<strong>and</strong> Ostapowicz, K., 2009. Mapping functional connectivity.<strong>Ecological</strong> Indicators, 9, 64–71.Vogt, P.; Riiters, K.; Estrenguil, C.; Kozak, J.; Wade, T., <strong>and</strong>Wickham, J., 2007. Mapping spatial patterns with morphologicalimage processing. L<strong>and</strong>scape Ecology, 22, 171–177.Walker, J.H.; Coleman, J.M.; Roberts, H.H., <strong>and</strong> Tye, R.S., 1987.Wetl<strong>and</strong> loss in Louisiana. Geografiska Annaler, Series A, PhysicalGeography, 69(1), 189–200.Wang, Y.; Woodstock, C.E.; Buermann, W.; Stenberg, P.; Voipio, P.;Smol<strong>and</strong>er, H.; Hame, T.; Tian, Y.; Hu, J.; Knyazikhin, Y., <strong>and</strong>Myneni, R.B., 2004. Evaluation of the MODIS LAI algorithm at aconiferous forest site in Finl<strong>and</strong>. Remote Sensing of the Environment,91, 114–127.Weller, M.W. (ed.), 1994. Freshwater Marshes: Ecology <strong>and</strong> WildlifeManagement, Wildlife Habitats, Volume 1, 3rd edition. Minneapolis,Minnesota: University of Minnesota Press, 151p.West, J.; Peterson, K.; Alcina, M., <strong>and</strong> Laska, S., 2008. Principles ofparticipatory action research (PAR), issues of entrée, <strong>and</strong> internalreview board (IRB) challenges in community/agency/universitycollaborations. Journal for Community Engaged Research <strong>and</strong>Learning Partnerships, 1(1), 13–26.http://www.manifestationjournal.org/ (accessed August 1, 2009).Zhang, M.; Ustin, S.L.; Rejmankova, E., <strong>and</strong> S<strong>and</strong>erson, E.W., 1997.Monitoring Pacific salt marshes using remote sensing. Journal of<strong>Ecological</strong> Applications, 7(3), 1039–1053.Journal of Coastal Research, Vol. 27, No. 3, 2011