An introduction to Micro CT Scanning
An introduction to Micro CT Scanning
An introduction to Micro CT Scanning
- No tags were found...

You also want an ePaper? Increase the reach of your titles
YUMPU automatically turns print PDFs into web optimized ePapers that Google loves.
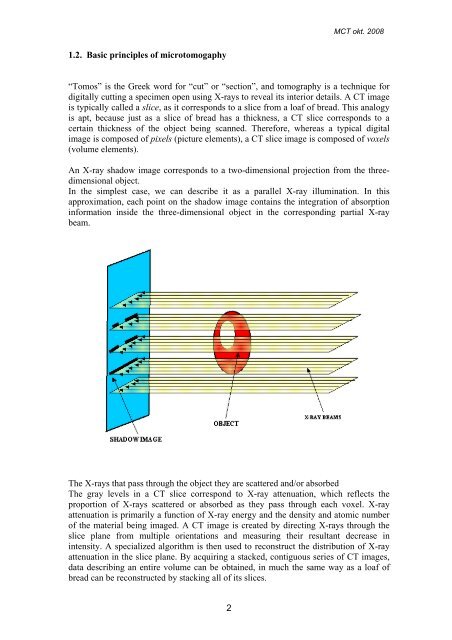
M<strong>CT</strong> okt. 20081.2. Basic principles of micro<strong>to</strong>mogaphy“Tomos” is the Greek word for “cut” or “section”, and <strong>to</strong>mography is a technique fordigitally cutting a specimen open using X-rays <strong>to</strong> reveal its interior details. A <strong>CT</strong> imageis typically called a slice, as it corresponds <strong>to</strong> a slice from a loaf of bread. This analogyis apt, because just as a slice of bread has a thickness, a <strong>CT</strong> slice corresponds <strong>to</strong> acertain thickness of the object being scanned. Therefore, whereas a typical digitalimage is composed of pixels (picture elements), a <strong>CT</strong> slice image is composed of voxels(volume elements).<strong>An</strong> X-ray shadow image corresponds <strong>to</strong> a two-dimensional projection from the threedimensionalobject.In the simplest case, we can describe it as a parallel X-ray illumination. In thisapproximation, each point on the shadow image contains the integration of absorptioninformation inside the three-dimensional object in the corresponding partial X-raybeam.The X-rays that pass through the object they are scattered and/or absorbedThe gray levels in a <strong>CT</strong> slice correspond <strong>to</strong> X-ray attenuation, which reflects theproportion of X-rays scattered or absorbed as they pass through each voxel. X-rayattenuation is primarily a function of X-ray energy and the density and a<strong>to</strong>mic numberof the material being imaged. A <strong>CT</strong> image is created by directing X-rays through theslice plane from multiple orientations and measuring their resultant decrease inintensity. A specialized algorithm is then used <strong>to</strong> reconstruct the distribution of X-rayattenuation in the slice plane. By acquiring a stacked, contiguous series of <strong>CT</strong> images,data describing an entire volume can be obtained, in much the same way as a loaf ofbread can be reconstructed by stacking all of its slices.2