MÄori Housing Trends 2010 - Housing New Zealand
MÄori Housing Trends 2010 - Housing New Zealand
MÄori Housing Trends 2010 - Housing New Zealand

Create successful ePaper yourself
Turn your PDF publications into a flip-book with our unique Google optimized e-Paper software.
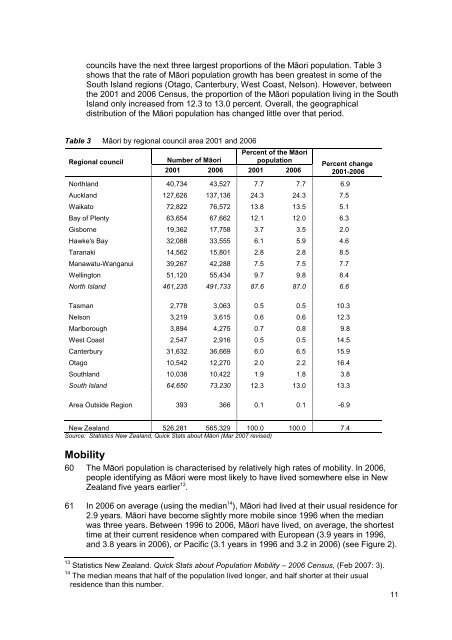
councils have the next three largest proportions of the Māori population. Table 3shows that the rate of Māori population growth has been greatest in some of theSouth Island regions (Otago, Canterbury, West Coast, Nelson). However, betweenthe 2001 and 2006 Census, the proportion of the Māori population living in the SouthIsland only increased from 12.3 to 13.0 percent. Overall, the geographicaldistribution of the Māori population has changed little over that period.Table 3 Māori by regional council area 2001 and 2006Regional councilPercent of the MāoriNumber of Māoripopulation2001 2006 2001 2006Percent change2001-2006Northland 40,734 43,527 7.7 7.7 6.9Auckland 127,626 137,136 24.3 24.3 7.5Waikato 72,822 76,572 13.8 13.5 5.1Bay of Plenty 63,654 67,662 12.1 12.0 6.3Gisborne 19,362 17,758 3.7 3.5 2.0Hawke's Bay 32,088 33,555 6.1 5.9 4.6Taranaki 14,562 15,801 2.8 2.8 8.5Manawatu-Wanganui 39,267 42,288 7.5 7.5 7.7Wellington 51,120 55,434 9.7 9.8 8.4North Island 461,235 491,733 87.6 87.0 6.6Tasman 2,778 3,063 0.5 0.5 10.3Nelson 3,219 3,615 0.6 0.6 12.3Marlborough 3,894 4,275 0.7 0.8 9.8West Coast 2,547 2,916 0.5 0.5 14.5Canterbury 31,632 36,669 6.0 6.5 15.9Otago 10,542 12,270 2.0 2.2 16.4Southland 10,038 10,422 1.9 1.8 3.8South Island 64,650 73,230 12.3 13.0 13.3Area Outside Region 393 366 0.1 0.1 -6.9<strong>New</strong> <strong>Zealand</strong> 526,281 565,329 100.0 100.0 7.4Source: Statistics <strong>New</strong> <strong>Zealand</strong>, Quick Stats about Māori (Mar 2007 revised)Mobility60 The Māori population is characterised by relatively high rates of mobility. In 2006,people identifying as Māori were most likely to have lived somewhere else in <strong>New</strong><strong>Zealand</strong> five years earlier 13 .61 In 2006 on average (using the median 14 ), Māori had lived at their usual residence for2.9 years. Māori have become slightly more mobile since 1996 when the medianwas three years. Between 1996 to 2006, Māori have lived, on average, the shortesttime at their current residence when compared with European (3.9 years in 1996,and 3.8 years in 2006), or Pacific (3.1 years in 1996 and 3.2 in 2006) (see Figure 2).13 Statistics <strong>New</strong> <strong>Zealand</strong>. Quick Stats about Population Mobility – 2006 Census, (Feb 2007: 3).14 The median means that half of the population lived longer, and half shorter at their usualresidence than this number.11