2010 Barley Quality - Montana Wheat & Barley Committee
2010 Barley Quality - Montana Wheat & Barley Committee
2010 Barley Quality - Montana Wheat & Barley Committee

Create successful ePaper yourself
Turn your PDF publications into a flip-book with our unique Google optimized e-Paper software.
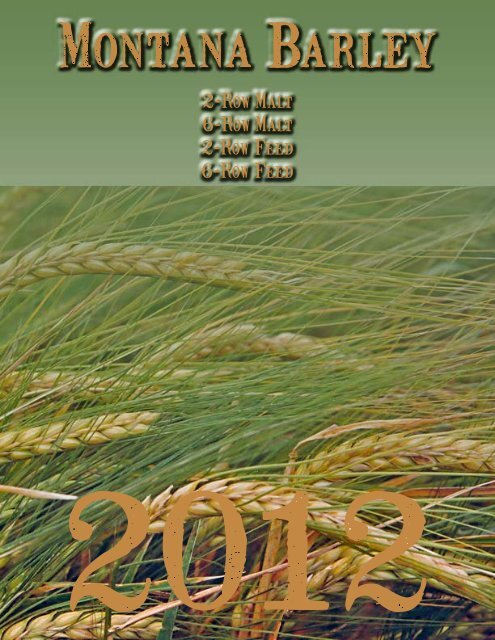
406.761.7732http://wbc.agr.mt.govWelcome to <strong>Montana</strong><strong>Barley</strong> Country!In the following pages you will findinformation on the <strong>Montana</strong> barleyindustry, and a review of the 2011crop. Based on the 2011 <strong>Montana</strong>Malt <strong>Barley</strong> Survey compiled by NorthDakota State University, our 2-rowmalt barley was at 10.6% moisture,11.6% protein, 82.6% plump, and2.6% thins.This year we both increased theamount of analysis we perform forbarley, and fine-tuned our detailedinformation to help our customers findthe quality they desire. While muchof our malt barley is under contractwith large brewing companies, anample supply still enters the openmarket each year. We encourageyou to look at our current andhistorical quality data.Along with this quality book, we havemultiple tools on our website, http://wbc.agr.mt.gov. Please refer to thissite for updated material, andadditional resources.The 2012 <strong>Montana</strong> <strong>Wheat</strong> and <strong>Barley</strong> <strong>Committee</strong>We thank you for your interest in<strong>Montana</strong>’s superior quality malt andfeed barley. If you have anyquestions, please contact our office inGreat Falls, MT.Best wishes now and always,The MWBC Directors and Staff
Welcome to <strong>Montana</strong> <strong>Barley</strong> Country!The Reason for <strong>Montana</strong>’s Superior <strong>Quality</strong>Weather in <strong>Montana</strong> is extreme.Traditionally, the stateexperiences hot and drysummers coupled with long andcold winters with sub-zerotemperatures.This climate generally producesthe highest quality barley.Partnered with applyingappropriate fertilizer levels andgood stewardship, the arid<strong>Montana</strong> summer produces grainwith perfect protein and excellentmalting quality.Producers applied timelyfungicide to address newdiseases caused by tremendousmoisture. A fairly hot and dryJuly, along with proper fertilizerapplication, with protein levels,and gave <strong>Montana</strong> a very soundcrop for 2011.A <strong>Montana</strong> malt barley head grown near theRocky Mountains—August 2009
Crop <strong>Quality</strong>The <strong>Montana</strong> <strong>Wheat</strong> and <strong>Barley</strong><strong>Committee</strong> (MWBC) has createdmore tools for both producersand customers via its website:http://wbc.agr.mt.gov. TheMWBC has been evaluating anddeveloping a new interactivewebsite to better distribute theinformation that comes in itsdoor.A new tool that will be especiallyhelpful for buyers is the Crop<strong>Quality</strong> portion of the website.Weekly updates with photosfrom around the state, as well aswritten commentary, will helpkeep buyers informed of what ishappening with seeding,growing, and harvest.http://wbc.agr.mt.gov/crop_quality.htmlSocial MediaFollow Us!www.facebook.com/<strong>Montana</strong><strong>Wheat</strong>www.twitter.com/<strong>Montana</strong><strong>Wheat</strong>
<strong>Barley</strong>(bushels, acres)<strong>Montana</strong>United StatesPlanted Harvested Yield Production Planted Harvested Yield ProductionYear (1000 acres) (1000 acres) (bu/ac) (1000 bu) (1000 acres) (1000 acres) (bu/ac) (1000 bu)1958 1,680 1,583 34.0 53,822 16,150 14,791 32.3 477,3681959 1,938 1,874 27.5 51,535 16,766 14,869 28.3 420,2031960 1,820 1,721 23.5 40,444 15,527 13,856 31.0 429,0051961 1,801 1,465 18.0 26,370 15,623 12,806 30.6 392,4411962 1,909 1,802 30.5 54,961 14,380 12,214 35.0 427,7261963 1,642 1,514 29.5 44,663 13,452 11,236 35.0 392,8331964 1,626 1,529 32.5 49,692 11,652 10,277 37.6 386,0591965 1,366 1,300 38.5 50,050 10,123 9,166 42.9 393,0551966 1,735 1,651 38.5 63,564 11,184 10,250 38.3 392,1081967 1,319 1,255 29.5 37,022 10,077 9,230 40.5 373,7451968 1,200 1,155 37.0 42,735 10,486 9,732 43.8 426,1511969 1,680 1,617 42.0 67,914 10,291 9,557 44.7 427,0551970 1,800 1,714 38.0 65,132 10,476 9,712 42.8 416,0911971 1,740 1,680 35.0 58,800 11,061 10,104 45.8 462,4231972 1,820 1,707 37.5 64,013 10,567 9,645 43.7 421,7191973 2,100 2,000 30.0 60,000 11,045 10,295 40.5 417,4341974 1,370 1,250 30.0 37,500 8,713 7,930 37.7 298,6691975 1,360 1,300 39.0 50,700 9,373 8,617 44.0 379,1621976 1,220 1,170 44.5 52,065 9,301 8,439 45.4 383,0071977 1,550 1,430 36.5 52,195 10,778 9,728 44.0 427,7841978 1,420 1,300 43.0 55,900 9,989 9,248 49.2 454,7591979 1,100 1,040 39.0 40,560 8,116 7,527 50.9 383,2011980 1,180 1,050 42.0 44,100 8,320 7,260 49.7 361,1351981 1,400 1,320 43.0 56,760 9,618 9,038 52.4 473,5121982 1,650 1,560 49.0 76,440 9,549 9,013 57.2 515,9351983 1,950 1,850 42.0 77,700 10,411 9,721 52.3 508,2691984 2,320 2,110 28.0 59,080 11,934 11,218 53.3 598,0341985 2,350 1,500 20.0 30,000 13,139 11,591 50.9 590,2131986 2,400 2,180 39.0 85,020 13,024 11,974 50.8 608,5321987 2,300 2,100 45.0 94,500 10,929 9,957 52.4 521,4991988 1,800 1,250 24.0 30,000 9,831 7,636 38.0 289,9941989 1,700 1,600 43.0 68,800 9,125 8,313 48.6 404,2031990 1,600 1,380 41.0 56,580 8,221 7,529 56.1 422,1961991 1,800 1,650 52.0 85,800 8,941 8,413 55.2 464,3261992 1,350 1,200 44.0 52,800 7,762 7,285 62.5 455,0901993 1,300 1,100 58.0 63,800 7,786 6,753 58.9 398,0411994 1,300 1,200 44.0 52,800 7,159 6,667 56.2 374,8621995 1,300 1,200 52.0 62,400 6,689 6,279 57.2 359,3761996 1,250 1,150 43.0 49,450 7,094 6,707 58.5 392,4331997 1,250 1,150 53.0 60,950 6,706 6,198 58.1 359,8781998 1,350 1,200 48.0 57,600 6,337 5,864 60.0 352,1251999 1,300 1,150 50.0 57,500 5,194 4,734 59.2 280,2922000 1,250 950 40.0 38,000 5,864 5,213 61.1 318,7282001 1,100 720 41.0 29,520 4,967 4,289 58.2 249,4202002 1,180 930 42.0 39,060 5,008 4,123 55.0 226,9062003 1,150 850 40.0 34,000 5,348 4,727 58.9 278,2832004 1,000 830 59.0 48,970 4,527 4,021 69.6 279,7432005 900 700 56.0 39,200 3,875 3,269 64.8 211,8962006 770 620 50.0 31,000 3,452 2,951 61.0 180,1652007 900 720 44.0 31,680 4,018 3,502 60.0 210,1102008 860 740 51.0 37,740 4,246 3,779 63.6 240,1932009 870 720 57.0 41,040 3,567 3,113 73.0 227,323<strong>2010</strong> 760 620 62.0 38,440 2,872 2,465 73.1 180,2682011 700 620 50.0 31,000 2,559 2,239 69.6 155,7802012 810 3,333Averages ³ 1,460 1,314 40.8 51,507 8,846 8,057 50.7 379,088¹ Preliminary; ² Estimates; ³ Averages include years since 1955 (not shown)6/8/2012Compiled by the <strong>Montana</strong><strong>Wheat</strong> <strong>Barley</strong> <strong>Committee</strong>Source: USDA
<strong>Barley</strong>(metric tons, hectares)<strong>Montana</strong>United StatesPlanted Harvested Yield Production Planted Harvested Yield ProductionYear (1000 hct) (1000 hct) (mt/hct) (1000 mt) (1000 hct) (1000 hct) (mt/hct) (1000 mt)1958 680 641 2.3 1,464 6,536 5,986 2.2 12,9841959 784 758 1.8 1,402 6,785 6,017 1.9 11,4301960 737 696 1.6 1,100 6,284 5,608 2.1 11,6691961 729 593 1.2 717 6,323 5,183 2.1 10,6741962 773 729 2.1 1,495 5,820 4,943 2.4 11,6341963 665 613 2.0 1,215 5,444 4,547 2.4 10,6851964 658 619 2.2 1,352 4,716 4,159 2.5 10,5011965 553 526 2.6 1,361 4,097 3,709 2.9 10,6911966 702 668 2.6 1,729 4,526 4,148 2.6 10,6651967 534 508 2.0 1,007 4,078 3,735 2.7 10,1661968 486 467 2.5 1,162 4,244 3,939 2.9 11,5911969 680 654 2.8 1,847 4,165 3,868 3.0 11,6161970 728 694 2.6 1,772 4,240 3,930 2.9 11,3181971 704 680 2.4 1,599 4,476 4,089 3.1 12,5781972 737 691 2.5 1,741 4,276 3,903 2.9 11,4711973 850 809 2.0 1,632 4,470 4,166 2.7 11,3541974 554 506 2.0 1,020 3,526 3,209 2.5 8,1241975 550 526 2.6 1,379 3,793 3,487 3.0 10,3131976 494 473 3.0 1,416 3,764 3,415 3.1 10,4181977 627 579 2.5 1,420 4,362 3,937 3.0 11,6361978 575 526 2.9 1,520 4,043 3,743 3.3 12,3691979 445 421 2.6 1,103 3,285 3,046 3.4 10,4231980 478 425 2.8 1,200 3,367 2,938 3.3 9,8231981 567 534 2.9 1,544 3,892 3,658 3.5 12,8801982 668 631 3.3 2,079 3,864 3,648 3.8 14,0331983 789 749 2.8 2,113 4,213 3,934 3.5 13,8251984 939 854 1.9 1,607 4,830 4,540 3.6 16,2671985 951 607 1.3 816 5,317 4,691 3.4 16,0541986 971 882 2.6 2,313 5,271 4,846 3.4 16,5521987 931 850 3.0 2,570 4,423 4,030 3.5 14,1851988 728 506 1.6 816 3,979 3,090 2.6 7,8881989 688 648 2.9 1,871 3,693 3,364 3.3 10,9941990 648 558 2.8 1,539 3,327 3,047 3.8 11,4841991 728 668 3.5 2,334 3,618 3,405 3.7 12,6301992 546 486 3.0 1,436 3,141 2,948 4.2 12,3781993 526 445 3.9 1,735 3,151 2,733 4.0 10,8271994 526 486 3.0 1,436 2,897 2,698 3.8 10,1961995 526 486 3.5 1,697 2,707 2,541 3.8 9,7751996 506 465 2.9 1,345 2,871 2,714 3.9 10,6741997 506 465 3.6 1,658 2,714 2,508 3.9 9,7891998 546 486 3.2 1,567 2,565 2,373 4.0 9,5781999 526 465 3.4 1,564 2,102 1,916 4.0 7,6242000 506 384 2.7 1,034 2,373 2,110 4.1 8,6692001 445 291 2.8 803 2,010 1,736 3.9 6,7842002 478 376 2.8 1,062 2,027 1,669 3.7 6,1722003 465 344 2.7 925 2,164 1,913 4.0 7,5692004 405 336 4.0 1,332 1,832 1,627 4.7 7,6092005 364 283 3.8 1,066 1,568 1,323 4.4 5,7642006 312 251 3.4 843 1,397 1,194 4.1 4,9002007 364 291 3.0 862 1,626 1,417 4.0 5,7152008 348 299 3.4 1,027 1,718 1,529 4.3 6,5332009 352 291 3.8 1,116 1,444 1,260 4.9 6,183<strong>2010</strong> 308 251 4.2 1,046 1,162 998 4.9 4,9032011 283 251 3.4 843 1,036 906 4.7 4,2372012 328 0 0.0 0 1,349 0 0.0 0Averages ³ 591 524 3 1,359 3,726 3,331 3 10,173¹ Preliminary; ² Estimates; ³ Averages include years since 1955 (not shown)6/8/2012Compiled by the <strong>Montana</strong><strong>Wheat</strong> <strong>Barley</strong> <strong>Committee</strong>Source: USDA
<strong>Montana</strong> <strong>Barley</strong> <strong>Quality</strong>The Northwest is a new region in <strong>2010</strong> which consists of3 counties. This region grows 2-rowed dryland barley.This region generally contains about 8% of <strong>Montana</strong>'soverall barley crop, and about 13% of the malt crop. In<strong>2010</strong>, the top varieties in this region are: Moravian 37,Conrad, Conlon, Hays, and Merit.2008 2009 <strong>2010</strong> AverageProduction DataBushels produced (1,000 bu) - - -Average Yield bu/ac - - -Malt <strong>Barley</strong> Kernel Data 2-RowedMoisture Content (%) - - 12.80 12.80Test Weight (lb/bu) - - 50.10 50.10Test Weight (kg/hl) - - 64.40 64.401000 Kernel Weight (g) - - 46.30 46.30Protein (%) - - 11.00 11.00Color - - 3.40 3.40Plump % - - 92.10 92.10The West is a new region in <strong>2010</strong> which consists of 3counties. This region grows both 2-rowed dryland andirrigated barley. This region generally contains about 8%of <strong>Montana</strong>'s overall barley crop, and about 13% of themalt crop. In <strong>2010</strong>, the top varieties in this region are:Moravian 37, Conrad, Conlon, Hays, and Merit.2008 2009 <strong>2010</strong> AverageProduction DataBushels produced (1,000 bu) - - -Average Yield bu/ac - - -Malt <strong>Barley</strong> Kernel Data 2-RowedMoisture Content (%) - - 13.30 13.30Test Weight (lb/bu) - - 49.90 49.90Test Weight (kg/hl) - - 64.20 64.<strong>2010</strong>00 Kernel Weight (g) - - 46.30 46.30Protein (%) - - 11.60 11.60Color - - 3.20 3.20Plump % - - 91.50 91.50<strong>2010</strong> <strong>Barley</strong> <strong>Quality</strong>The Central is a new region in <strong>2010</strong> which consists of 2counties. This region grows both 2-rowed dryland andirrigated barley. This region generally contains about 6%of <strong>Montana</strong>'s overall barley crop, and about 5% of themalt crop. In <strong>2010</strong>, the top varieties in this region are:Harrington, Haybet, Baronesse, AC Metcalfe, andTradition.2008 2009 <strong>2010</strong> AverageProduction DataBushels produced (1,000 bu) - - -Average Yield bu/ac - - -Malt <strong>Barley</strong> Kernel Data 2-RowedMoisture Content (%) - - 12.70 12.70Test Weight (lb/bu) - - 49.20 49.20Test Weight (kg/hl) - - 63.40 63.401000 Kernel Weight (g) - - 43.10 43.10Protein (%) - - 10.50 10.50Color - - 3.00 3.00Plump % - - 89.40 89.40For more data and information, contact our office at wbc@mt.gov or 406.761.7732Updated 12/9<strong>2010</strong>
<strong>Montana</strong> <strong>Barley</strong> <strong>Quality</strong>The Northeast is a new region in <strong>2010</strong> which consists of4 counties. This region grows 6-rowed dryland barley.This region generally contains about 50% of <strong>Montana</strong>'soverall barley crop, and about 58% of the malt crop. In<strong>2010</strong>, the top varieties in this region are: AC Metcalfe,Harrington, Conrad, Prowashanupana, and Haybet.2008 2009 <strong>2010</strong> AverageProduction DataBushels produced (1,000 bu) - - -Average Yield bu/ac - - -Malt <strong>Barley</strong> Kernel Data 6-Rowed <strong>Barley</strong>Moisture Content (%) - - 13.20 13.20Test Weight (lb/bu) - - 46.00 46.00Test Weight (kg/hl) - - 59.20 59.<strong>2010</strong>00 Kernel Weight (g) - - 34.60 34.60Protein (%) - - 9.70 9.70Color - - 4.00 4.00Plump % - - 91.00 91.00The East is a new region in <strong>2010</strong> which consists of 2counties. This region grows both 2-rowed irrigatedbarley. This region generally contains about 5% of<strong>Montana</strong>'s overall barley crop, and about 2% of themalt crop. In <strong>2010</strong>, the top varieties in this region are:Haybet, Haxby, Conlon, Stark, and Tradition.2008 2009 <strong>2010</strong> AverageProduction DataBushels produced (1,000 bu) - - -Average Yield bu/ac - - -Malt <strong>Barley</strong> Kernel Data 2-Rowed <strong>Barley</strong>Moisture Content (%) - - 12.60 12.60Test Weight (lb/bu) - - 49.30 49.30Test Weight (kg/hl) - - 63.40 63.401000 Kernel Weight (g) - - 46.80 46.80Protein (%) - - 10.60 10.60Color - - 4.80 4.80Plump % - - 89.10 89.10<strong>2010</strong> <strong>Barley</strong> <strong>Quality</strong>The South is a new region in <strong>2010</strong> which consists of 3counties. This region grows both 2-rowed irrigated anddryland barley. This region generally contains about15% of <strong>Montana</strong>'s overall barley crop, and about 12%of the malt crop. In <strong>2010</strong>, the top varieties in thisregion are: Tradition, Haybet, Haxby, Hays, and Horsford.2008 2009 <strong>2010</strong> AverageProduction DataBushels produced (1,000 bu) - - -Average Yield bu/ac - - -Malt <strong>Barley</strong> Kernel Data 2-Rowed <strong>Barley</strong>Moisture Content (%) - - 11.10 11.10Test Weight (lb/bu) - - 48.40 48.40Test Weight (kg/hl) - - 62.30 62.301000 Kernel Weight (g) - - 42.70 42.70Protein (%) - - 10.00 10.00Color - - 4.40 4.40Plump % - - 84.80 84.80For more data and information, contact our office at wbc@mt.gov or 406.761.7732Updated 12/9/<strong>2010</strong>
2011 <strong>Montana</strong> <strong>Barley</strong> Crop <strong>Quality</strong> ReportIntroductionThis is the second Regional Crop <strong>Quality</strong> Report for maltbarley grown in <strong>Montana</strong>. A total of 97 barley sampleswere collected at farms and elevators during the 2011barley harvest and analyzed for the purpose of thisreport. Sample collection was coordinated by the U.S.Department of Agriculture (USDA), North Dakota and<strong>Montana</strong> Agriculture Statistics Services in Fargo, N.D.and Helena, MT. Grain quality evaluations wereperformed by the Department of Plant Sciences at NorthDakota State University; grades were determined by theNorth Dakota Grain Inspection Service Inc. Fargo, N.D.and the <strong>Montana</strong> <strong>Wheat</strong> and <strong>Barley</strong> <strong>Committee</strong>, GreatFalls, MT provided financial support.Production and Varieties<strong>Montana</strong> barley production totaled 31 million bushels(682 thousand metric tons) from 620 thousand harvestedacres (251 thousand hectares). Although acres remainedFigure 1. <strong>Barley</strong> Production Regions in <strong>Montana</strong>Table 1. <strong>Barley</strong> Production Regions in <strong>Montana</strong>Region Production CountiesNorthwest 2-rowed dryland Glacier, Toole, PonderaWest 2-rowed, dryland and irrigated Teton, Cascade, Lewis and ClarkCentral 2-rowed, dryland and irrigated Judith Basin, FergusNortheast 6-rowed, dryland Valley, Roosevelt, Sheridan, DanielsEast 6-rowed, irrigated Richland, DawsonSouth 2-rowed, dryland and irrigated Yellowstone, Treasure, Big HornPage 1
2011 <strong>Montana</strong> <strong>Barley</strong> Crop <strong>Quality</strong> Reportsteady compared to <strong>2010</strong>, production decreased by 19percent, and by 23 percent from 2009, due to loweryields which were 50 (2.7), 62 (3.3) and 57 (3.1) bu/acre(kg/hl) in 2011, <strong>2010</strong> and 2009, respectively. Two-rowedvarieties, which make up the majority of <strong>Montana</strong> barleyacreage, included AC-Metcalfe (32 percent of acressown), followed by Hockett (8 percent), Conrad (6percent), and Moravian 69, Harrington and Merit 57,each at 4 percent of acres. Tradition accounted for 2percent of the 2011 acreage.Two-rowed samples in the Northwest and West regionswere graded as USDA/FGIS U.S. Grade # 1 Malting<strong>Barley</strong>, U.S. Grade # 2 Malting <strong>Barley</strong> in the CentralRegion, U.S. # 1 in the South and U.S. # 2 in the East.All 6-rowed samples (Northeast and East regions)received U.S. Grade # 2 Malting <strong>Barley</strong>.Materials and MethodsSamples weighing from 1 to 2 pounds each werecollected during harvest from selected counties in<strong>Montana</strong>. Samples were collected from farms andcountry elevators. The objective was to collect arepresentative number of samples from each selectedcounty within the survey region. This number wasdetermined from the projected barley production for eachcounty. Two- and six-rowed samples were differentiatedbased upon varietal identification by the grower or kernelmorphology. The survey region includes a total of sixcrop reporting districts, and a total of 97 samples werecollected.Eighty-one two-rowed barley samples were collectedfrom all six districts. Five six-rowed samples werecollected from two districts. Non-malt varieties wereTable 2. Regional Two-rowed <strong>Barley</strong> Crop <strong>Quality</strong>RegionMoistureContent (%)Test Weight(lb/bu) (kg/hl)1000 KernelWeight (g)ProteinContent (%)ColorKernel Assortment%Plump %ThinNorthwest 9.9 49.6 63.8 42.5 11.2 1.3 84.5 2.1West 11.2 49.7 64.0 42.0 12.0 1.4 82.9 2.9East 14.2 45.3 58.3 39.9 12.6 5.5 83.8 3.3Central 8.2 48.4 62.3 37.9 11.9 1.5 81.7 1.0South 10.9 46.2 59.5 39.3 11.7 3.9 77.4 3.4State Average 10.6 48.7 62.7 41.5 11.6 2.1 82.6 2.6Table 3. Regional Six-rowed <strong>Barley</strong> Crop <strong>Quality</strong>RegionMoistureContent (%)Test Weight(lb/bu) (kg/hl)1000 KernelWeight (g)ProteinContent (%)ColorKernel Assortment%Plump %ThinEast 12.9 44.9 57.8 35.6 12.8 5.7 81.2 3.1Northeast 12.2 43.9 56.5 37.0 13.8 4.5 81.5 4.1State Average 12.6 44.5 57.3 36.1 13.2 5.2 81.3 3.5Page 2
2011 <strong>Montana</strong> <strong>Barley</strong> Crop <strong>Quality</strong> ReportTable 4. Regional <strong>Barley</strong> Crop <strong>Quality</strong>CropReportingDistrict Dockage Grade*Test Weight(lb/bu) (Kg/hl)SuitableMaltingTypes (%)Sound<strong>Barley</strong>**(%)Skinned andBrokenKernels (%)Thin<strong>Barley</strong>(%)Northwest 0.4West 0.4Central 0.2Northeast 0.8East 6 R 0.9U.S. No. 1 Two-RowedMalting <strong>Barley</strong>U.S. No. 1 Two-RowedMalting <strong>Barley</strong>U.S. No. 2 Two-RowedMalting <strong>Barley</strong>U.S. No. 2 Six-RowedMalting <strong>Barley</strong>U.S. No. 2 Six-RowedMalting <strong>Barley</strong>50.0 64.4 100.0 99.9 2.8 1.050.1 64.5 100.0 99.6 3.0 2.049.0 63.1 100.0 100.0 3.5 0.645.2 58.2 100.0 100.0 1.0 3.245.5 58.6 100.0 100.0 2.9 1.8South 0.4 U.S. No. 1 <strong>Barley</strong> 47.2 60.7 100.0 100.0 2.5 1.9East 2 R 0.5 U.S. No. 2 <strong>Barley</strong> 45.7 58.8 100.0 99.5 3.0 1.8*Grade specifications provided in Appendix 1.**Injured-by-frost kernels and injured-by-mold kernels are not considered damaged kernels or considered against sound barley.eliminated from the data analysis although quality testswere run on all samples.Upon receipt, the initial barley moisture content wasrecorded and samples in excess of 13.5 percent wereallowed to air-dry prior to subsequent analyses. A smallportion (50 grams) of each sample was removed andbulked according to district. These district compositesamples were submitted to the North Dakota GrainInspection Service Inc. for determination of grade.Dockage content was determined on each districtcomposite sample. Prior to further analysis, all samplescollected were cleaned on a Carter dockage tester. Testweight, protein, kernel assortment, 1,000 kernel weightand kernel color were determined for each of thedockage-free samples. The values for district, state andregional averages represent the average of all individualsample results within their respective area. Separatedistrict, state and regional averages were calculated fortwo- and six-rowed barley.Crop <strong>Quality</strong>Data from selected counties was grouped according torow type and irrigated or dryland production (Table 1).Detailed data from each region can be found in Tables 2and 3.Northwest RegionTwo-rowed malting barley in the northwest region hadlow color scores (1.3 out of 10), indicating that the crop isbright and clean. Proteins were also lowest (11.2percent) and the number of plump kernels (84.5 percent)was highest for regions tested. Test weights were alsoPage 3
2011 <strong>Montana</strong> <strong>Barley</strong> Crop <strong>Quality</strong> Reportclose to the highest level statewide at 49.6 lb/bu (63.8kg/hl).West RegionThe highest two-rowed test weight values were in thewest at 49.7 lb/bu (64.0 kg/hl). Crop color also was quitegood with an average color score of 1.4.Central RegionTwo-rowed barley in the central region was bright andclean with an average color score of 1.5Northeast RegionThe percent of six-rowed plump kernels (81.5 percent)was very good in the northeast.East RegionSix-rowed samples had lower protein (12.8 percent),higher test weight (44.9 lb/bu, 57.8 kg/hl) and lower colorscore (5.7) than six-rowed samples in the northeast.Plump kernels were also high at 81.2 percent. Tworowedsamples however were highest protein (12.6percent) and lowest test weight (45.3 lb/bu, 58.3 kg/hl) ofall two-rowed samples in the state.South RegionTwo-rowed irrigated production had the lowest averagepercent of plump kernels at 77.4 percent.Page 4
2011 <strong>Montana</strong> <strong>Barley</strong> Crop <strong>Quality</strong> ReportAppendixAppendix Table 1. Grade and Grade Requirements for Two-Rowed Malt-GradeMinimum limits of - Maximum limits of -Test Weight(lb/bu) (kg/hl)Sound<strong>Barley</strong>* (%)Wild Oats(%)ForeignMaterial (%)Skinned andBroken Kernels(%)Thin <strong>Barley</strong>(%)**U.S. No. 1 50.0 64.4 97.0 1.0 0.5 5.0 5.0U.S. No. 2 48.0 61.8 97.0 1.0 1.0 7.0 7.0U.S. No. 3 48.0 61.8 95.0 2.0 2.0 10.0 10.0U.S. No. 4 48.0 61.8 95.0 3.0 3.0 10.0 10.0*Injured-by-frost kernels and injured -by-mold kernels are not considered damaged kernels or considered against sound barley.**Use 5.5/64 x 3/4 slotted-hole sieve.Notes:Malting barley shall not be infested, blighted, ergoty, garlicky, smutty, or contain any special grades. Upon request, malting barley varieties may be inspected and graded in accordancewith standards established for the class <strong>Barley</strong>.Two-rowed Malting barley that does not meet the requirements for U.S. Nos. 1,2,3, or 4 Malting shall be graded under the <strong>Barley</strong> standards.Information from United States of Agriculture Grain Inspection, Packers and Stockyard Administration Federal Grain Inspection Service Grain Inspection Handbook, Book II, <strong>Barley</strong>,August 9, 2004Appendix Table 2. Grade and Grade Requirements for Six-Rowed Malting <strong>Barley</strong>GradeMinimum limits of -Test Weight(lb/bu) (kg/hl)SuitableMaltingType (%)Sound<strong>Barley</strong>*(%)Maximum limits of -DamagedKernels*(%)ForeignMaterial(%)OtherGrains(%)Skinned andBrokenKernels (%)Thin<strong>Barley</strong> (%)U.S. No. 1 47.0 60.5 95.0 97.0 2.0 0.5 2.0 4.0 7.0U.S. No. 2 45.0 57.9 95.0 94.0 3.0 1.0 3.0 6.0 10.0U.S. No. 3 43.0 55.3 95.0 90.0 4.0 2.0 5.0 8.0 15.0U.S. No. 4 43.0 55.3 95.0 87.0 5.0 3.0 5.0 10.0 15.0*Injured-by-frost kernels and injured -by-mold kernels are not considered damaged kernels or considered against sound barley.Information from United States of Agriculture Grain Inspection, Packers and Stockyard Administration Federal Grain Inspection Service Grain Inspection Handbook, Book II,<strong>Barley</strong>, August 9, 2004Page 5
2011 <strong>Montana</strong> <strong>Barley</strong> Crop <strong>Quality</strong> ReportAppendix Table 3. Grade and Grade Requirements for <strong>Barley</strong>Minimum limits of - Maximum limits of -GradeTest Weight(lb/bu) (kg/hl)Sound<strong>Barley</strong>* (%)DamagedKernels*(%)HeatDamagedKernelsForeignMaterial(%)BrokenKernels (%)Thin <strong>Barley</strong>(%)**U.S. No. 1 47.0 60.5 97.0 2.0 0.2 1.0 4.0 10.0U.S. No. 2 45.0 57.9 94.0 3.0 0.3 2.0 8.0 15.0U.S. No. 3 43.0 55.3 90.0 4.0 0.5 3.0 12.0 25.0U.S. No. 4 40.0 51.5 85.0 8.0 1.0 4.0 18.0 35.0U.S. No. 5 36.0 46.3 75.0 10.0 3.0 5.0 28.0 75.0U.S. Sample grade:U.S. Sample grade shall be barley that:a)Does not meet the requirements for the grades U.S. Nos. 1,2,3,4 or 5; orb)Contains 8 or more stones or any number of stones which have a aggregate weight in excess of 0.2 percent of the sample weight, 2 or more pieces of glass, 3 or morecrotalaria seeds (Crotalaria spp.), 2 or more castor beans (Ricinus communis L.), 4 or more particles of unknown foreign substance(s) or a commonly recognized harmful ortoxic substance(s), 8 or more cocklebur (Xanthium spp.) or similar seeds singly or in combination, 10 or more rodent pellets, bird droppings, or equivalent quality or other animalfilth per 1-1/8 to 1-1/4 quarts of barley; orc)Has a musty, sour, or commercially objectionable foreign odor (except smut or garlic odor); ord)Is heating or otherwise of distinctly low quality*Includes heat-damaged kernels. Injured-by-frost kernels and injured-by-mold kernels are not considered damaged kernels.**Use the 5/64 x 3/34 slotted hole sieve.Information from: United States Department of Agriculture, Grain Inspection, Packers and Stockyards Administration, Federal Grain Inspection Service, Grain InspectionHandbook II, August 9, 2004Page 6