Multilevel Graph Clustering with Density-Based Quality Measures
Multilevel Graph Clustering with Density-Based Quality Measures
Multilevel Graph Clustering with Density-Based Quality Measures

Create successful ePaper yourself
Turn your PDF publications into a flip-book with our unique Google optimized e-Paper software.
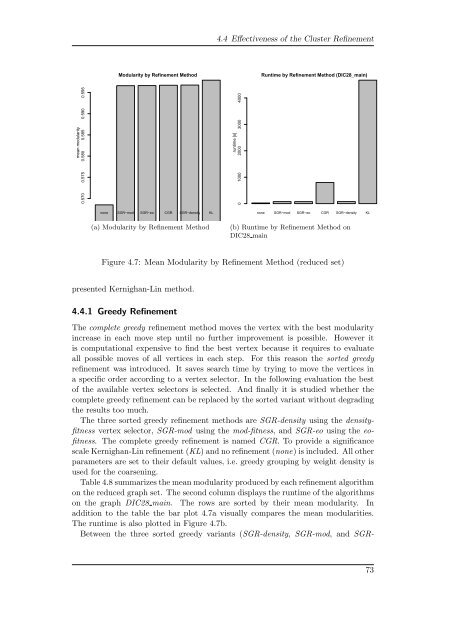
4.4 Effectiveness of the Cluster RefinementModularity by Refinement MethodRuntime by Refinement Method (DIC28_main)mean modularity0.570 0.575 0.580 0.585 0.590 0.595runtime [s]0 1000 2000 3000 4000none SGR−mod SGR−eo CGR SGR−density KL(a) Modularity by Refinement Methodnone SGR−mod SGR−eo CGR SGR−density KL(b) Runtime by Refinement Method onDIC28 mainFigure 4.7: Mean Modularity by Refinement Method (reduced set)presented Kernighan-Lin method.4.4.1 Greedy RefinementThe complete greedy refinement method moves the vertex <strong>with</strong> the best modularityincrease in each move step until no further improvement is possible. However itis computational expensive to find the best vertex because it requires to evaluateall possible moves of all vertices in each step. For this reason the sorted greedyrefinement was introduced. It saves search time by trying to move the vertices ina specific order according to a vertex selector. In the following evaluation the bestof the available vertex selectors is selected. And finally it is studied whether thecomplete greedy refinement can be replaced by the sorted variant <strong>with</strong>out degradingthe results too much.The three sorted greedy refinement methods are SGR-density using the densityfitnessvertex selector, SGR-mod using the mod-fitness, and SGR-eo using the eofitness.The complete greedy refinement is named CGR. To provide a significancescale Kernighan-Lin refinement (KL) and no refinement (none) is included. All otherparameters are set to their default values, i.e. greedy grouping by weight density isused for the coarsening.Table 4.8 summarizes the mean modularity produced by each refinement algorithmon the reduced graph set. The second column displays the runtime of the algorithmson the graph DIC28 main. The rows are sorted by their mean modularity. Inaddition to the table the bar plot 4.7a visually compares the mean modularities.The runtime is also plotted in Figure 4.7b.Between the three sorted greedy variants (SGR-density, SGR-mod, and SGR-73