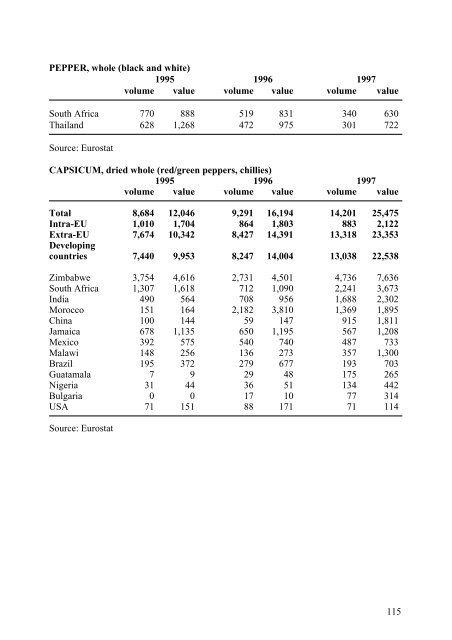
PEPPER, whole (black <strong>and</strong> white) 1995 1996 1997 volume value volume value volume value South Africa 770 888 519 831 340 630 Thail<strong>and</strong> 628 1,268 472 975 301 722 Source: Eurostat CAPSICUM, dried whole (red/green peppers, chillies) 1995 1996 1997 volume value volume value volume value Total 8,684 12,046 9,291 16,194 14,201 25,475 Intra-EU 1,010 1,704 864 1,803 883 2,122 Extra-EU 7,674 10,342 8,427 14,391 13,318 23,353 Developing countries 7,440 9,953 8,247 14,004 13,038 22,538 Zimbabwe 3,754 4,616 2,731 4,501 4,736 7,636 South Africa 1,307 1,618 712 1,090 2,241 3,673 India 490 564 708 956 1,688 2,302 Morocco 151 164 2,182 3,810 1,369 1,895 China 100 144 59 147 915 1,811 Jamaica 678 1,135 650 1,195 567 1,208 Mexico 392 575 540 740 487 733 Malawi 148 256 136 273 357 1,300 Brazil 195 372 279 677 193 703 Guatamala 7 9 29 48 175 265 Nigeria 31 44 36 51 134 442 Bulgaria 0 0 17 10 77 314 USA 71 151 88 171 71 114 Source: Eurostat 115
GINGER 1995 1996 1997 volume value volume value volume value Total 14,659 16,470 17,047 21,465 18,253 27,034 Intra-EU 1,874 3,228 2,725 4,710 2,965 5,285 Extra-EU 12,785 13,242 14,322 16,755 15,288 21,749 Developing countries 12,053 12,301 13,422 15,314 14,844 20,870 Costa Rica 1,306 1,498 2,670 3,035 3,859 5,037 Brazil 2,665 2,889 2,599 2,802 2,636 3,812 Nigeria 972 643 1,039 944 2,494 3,024 Thail<strong>and</strong> 1,746 1,848 2,082 2,472 1,633 2,189 Nicaragua 98 84 247 262 1,072 1,208 India 371 611 551 839 1,044 1,757 China 3,330 2,920 2,355 2,568 809 1,880 South Africa 701 892 825 1,082 559 696 Honduras 102 90 182 146 260 212 Indonesia 386 356 570 689 192 273 USA 88 174 259 505 136 280 Singapore 154 133 374 422 113 149 Source: Eurostat CORIANDER 1995 1996 1997 volume value volume value volume value Total 12,354 5,209 13,628 7,007 15,633 12,837 Intra-EU 1,716 1,323 2,680 2,052 2,993 3,481 Extra-EU 10,638 3,886 10,948 4,955 12,640 9,356 Developing countries 1,649 1,056 2,202 1,646 3,845 3,635 Bulgaria 2,389 713 1,165 398 2,514 1,546 Morocco 691 414 1,209 781 1,764 1,624 India 878 510 849 648 1,732 1,737 Russia 3,549 814 4,670 1,390 1,636 878 Romania 487 160 358 171 1,153 724 Egypt 891 539 957 645 1,054 997 Hungary 205 87 437 219 771 379 Ukraine 378 106 431 141 355 173 Czech Republic 65 16 91 43 226 167 Yugoslavia 0 0 97 48 199 124 Myanmar 0 0 98 29 152 85 Tanzania 4 1 0 0 126 82 Thail<strong>and</strong> 24 80 43 115 122 107 Source: Eurostat 116
- Page 1 and 2:
Spices and Herbs A SURVEY OF THE NE
- Page 3 and 4:
DISCLAIMER The information provided
- Page 5 and 6:
5.1.3 Dutch standards 79 5.1.4 ISO-
- Page 7 and 8:
The only spices which are produced
- Page 9 and 10:
continual pressure to develop more
- Page 11 and 12:
In the case of intra-EU trade, stat
- Page 13 and 14:
2.2 Customs/statistical product cla
- Page 15 and 16:
Pepper dominates the total spice de
- Page 17 and 18:
Industrial sector In 1997 the sales
- Page 19 and 20:
Figure 3.2 Market shares of herbs a
- Page 21 and 22:
Lazy traditional - they are similar
- Page 23 and 24:
with 1ong established and heavily p
- Page 25 and 26:
Demand for ‘natural’ products a
- Page 27 and 28:
Table 3.4 Imports of spices and her
- Page 29 and 30:
Figure 3.3 Imports of spices and he
- Page 31 and 32:
Cinnamon Cinnamon is long establish
- Page 33 and 34:
Figure 3.4 Main non-EU suppliers of
- Page 35 and 36:
3.4 Exports The Netherlands is a si
- Page 37 and 38:
Figure 3.5 Distribution channels fo
- Page 39 and 40:
In the case of pepper, the price ro
- Page 41 and 42:
1. Single spices (packets) 2. Singl
- Page 43 and 44:
3.6.2 Margins The margins charged b
- Page 45 and 46:
4 THE EUROPEAN UNION MARKET 4.1 The
- Page 47 and 48:
Table 4.2 EU imports of spices and
- Page 49 and 50:
The spices used by the average cons
- Page 51 and 52:
The major EU retail markets are Ger
- Page 53 and 54:
Table 4.3 EU imports of spices and
- Page 55 and 56:
In 1997, most spices were supplied
- Page 57 and 58:
Paprika powder is the major export
- Page 59 and 60:
The German population is quite homo
- Page 61 and 62:
Table 4.6 Imports of spices and her
- Page 63 and 64:
and new restaurant trends. This in
- Page 65 and 66: Between 1995 and 1997 UK imports in
- Page 67 and 68: In 1997, the apparent consumption o
- Page 69 and 70: Table 4.8 Imports of spices and her
- Page 71 and 72: Figure 4.9 Market shares of spices
- Page 73 and 74: After processing, which is a major
- Page 75 and 76: Capsicum India, Spain, Germany, Hun
- Page 77 and 78: About two thirds of Belgian spice i
- Page 79 and 80: In most developing countries, low p
- Page 81 and 82: stricter for broken down spices and
- Page 83 and 84: Cinnamon is normally packed in bale
- Page 85 and 86: 5.3.3 Environmental standards Ecola
- Page 87 and 88: 5.4 Tariffs and quotas Since the co
- Page 89 and 90: 88 Common methods of payment includ
- Page 91 and 92: When corresponding by mail, exporte
- Page 93 and 94: product demonstrations, displays, p
- Page 95 and 96: 5.6.2 Trade press Leading national
- Page 97 and 98: 5.7 Checklist This section provides
- Page 99 and 100: APPENDIX 1 PRODUCT EXPLANTION / HS
- Page 101 and 102: Pepper Black and white pepper are t
- Page 103 and 104: Parsley Parsley is one of the best
- Page 105 and 106: 0909 30 19 Other cumin seeds (exclu
- Page 107 and 108: Imports of spices and herbs to The
- Page 109 and 110: Netherlands imports of selected pro
- Page 111 and 112: CORIANDER 1995 1996 1997 volume val
- Page 113 and 114: EUROPEAN UNION EU imports of spices
- Page 115: EU imports of spices and herbs by p
- Page 119 and 120: EXPORT EU exports of spices and her
- Page 121 and 122: Off Odours Shall be free from off o
- Page 123 and 124: PRODUCT ASH AIA H2O V/O (whole form
- Page 125 and 126: 3.2 Standards and norms applicable
- Page 127 and 128: Austria Ostereichisches Normunginst
- Page 129 and 130: APPENDIX 4 IMPORT TARIFFS FOR SPICE
- Page 131 and 132: APPENDIX 6 TRADE ASSOCIATIONS EUROP
- Page 133 and 134: APPENDIX 7 TRADE FAIR ORGANISERS FO
- Page 135 and 136: APPENDIX 8 TRADE PRESS INTERNATIONA
- Page 137 and 138: APPENDIX 9 TRADE PROMOTION ORGANISA
- Page 139 and 140: APPENDIX 10 OTHER USEFUL ADDRESSES
- Page 141 and 142: Ministery of Economic Affairs (EVD
- Page 143 and 144: APPENDIX 12 LIST OF NETHERLANDS IMP
- Page 145 and 146: Holland Produce B.V. (Small importe
- Page 147 and 148: Verstegen Specerijhandel B.V. (Majo
- Page 149: Mailing address: P.O. Box 30009 300