The Nominal Sand Control Screen: A Critical Evaluation ... - OnePetro
The Nominal Sand Control Screen: A Critical Evaluation ... - OnePetro
The Nominal Sand Control Screen: A Critical Evaluation ... - OnePetro

Create successful ePaper yourself
Turn your PDF publications into a flip-book with our unique Google optimized e-Paper software.
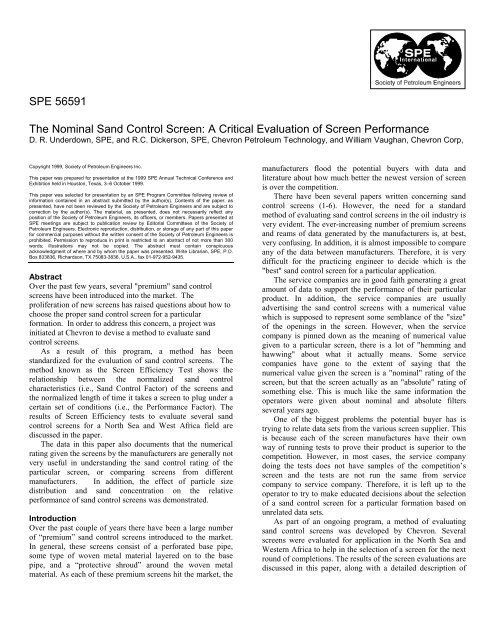
SPE 56591 THE NOMINAL SAND CONTROL SCREEN: A CRITICAL EVALUATION OF SCREEN PERFORMANCE 3group of screens indicates that most have similar sandretention efficiencies, which the exception of one screen.<strong>Screen</strong> #6 appears to retain relatively more sand than the otherscreens in Group II.One of the main justifications for running performancetests on screens is brought forth by the evaluation of thescreens from screen manufacturer D. Manufacturer D initiallysupplied screens with only "small" and "large" openings.However the North Sea Business Unit also wanted a screenwith an opening somewhere in between the "small" and"large" opening screen. It should be noted that there werenumerical values associated with the name of each screenwhich implied the relative size of the openings in each screensample. It was "assumed" from the numbers associated witheach screen sample that the higher the number, the larger theaverage opening in the screen. Inspection of Figures 2 & 3shows that the screen with the "medium" openings plugs muchfaster than the screen with the "smaller" openings and lets lesssolids through than the screen with the "smaller" openings.When confronted with this information, Manufacturer Downed up to the fact that to make the screen with the"medium" openings, and the screen with the "larger" openingswas simple compressed, i.e., made thinner. This techniquemay have made a sample with an average opening "smaller"relative to the screen with the "larger" openings; however, it isspeculated that the process of compressing the screen with the"larger" openings resulted in much less open area, which inturn caused the screen with the "medium" openings to plugfaster than the screen with the "smaller" openings. <strong>The</strong> resultsof this analysis shows how important it is to run aperformance tests on screens rather than take the numericalvalue assigned to the screen by a service company as havingany relationship to the relative solids retention capability ofthe screen.<strong>Screen</strong> Efficiency Plot. In order to better understand therelationship between the pressure profiles and the gravimetricprofiles, a methodology was developed called a SE Plot (<strong>Screen</strong> Efficiency Plot ). <strong>The</strong> SE Plot shows the normalizedrelationship between the Performance Factor and the <strong>Sand</strong><strong>Control</strong> Factor. <strong>The</strong> Performance Factor and the <strong>Sand</strong> <strong>Control</strong>Factor are related to the pressure profile and gravimetricanalysis as follows:Where:Where:Performance Factor = T/ApT = time for the pressure profile to reach 100 psiAp = total area under the curve of the pressure profile<strong>Sand</strong> <strong>Control</strong> Factor = 1/ AgAg = total area under the gravimetric profile<strong>The</strong> SE Plot for the screens tested for the North Sea sandare shown in Figure 4.<strong>The</strong> objective of using the <strong>Screen</strong> Efficiency Plot (SE Plot)is to allow the practicing engineer to select a sand controlscreen based on the relative performance of all the screensunder consideration for a particular application. In practice,the SE Plot shows the relationship between the normalizedsand control characteristics (i.e., <strong>Sand</strong> <strong>Control</strong> Factor) of thescreens and the normalized length of time it takes a screen toplug under a certain set of conditions (i.e., the PerformanceFactor). <strong>The</strong> "perfect" sand control screen would have valuesof 1 & 1 for both the <strong>Sand</strong> <strong>Control</strong> and Performance Factors.Based on this criteria, the best screen is <strong>Screen</strong> #7. However,inspection of Figure 4 shows that both <strong>Screen</strong> #1 and <strong>Screen</strong>#8 give much better relative sand control than <strong>Screen</strong> #7 whilegiving up only a small amount of relative performance.<strong>The</strong>refore, just on the data from the SE Plot, <strong>Screen</strong> #1 and<strong>Screen</strong> #8 are ranked as good second choices.In many cases, there are other factors that also effect thechoice of the screen for an application. <strong>The</strong> obvious are costand availability. In the case for North Sea, there is otherinformation which caused careful consideration to using either<strong>Screen</strong> #1 or <strong>Screen</strong> #8. <strong>Screen</strong> #1 was initially used in theNorth Sea completions. However, the completions started tofail; i.e., started to make sand. Even though the cause is notknown, the recent failures of <strong>Screen</strong> #1 resulted in the choiceof <strong>Screen</strong> #7. <strong>Screen</strong> #8 was not chosen because of theinformation learned concerning the manufacturing processduring the analysis of the SE Plot data.Based on the SE Plot and additional information, Table 3shows the rankings of the screens tested for the North Seasand.
4 DAVID R. UNDERDOWN, WILLIAM VAUGHAN AND R. C. DICKERSON SPE 56591TABLE 3SCREEN EFFICIENCY RATINGSNORTH SEA FORMATION SAND<strong>Screen</strong> Ranking Comments<strong>Screen</strong> #7 1 Reasonably high Performance and<strong>Sand</strong> <strong>Control</strong> Factors<strong>Screen</strong> #1 2 Good <strong>Sand</strong> <strong>Control</strong> Factor withslightly less Performance Factorthan Purolator 125<strong>Screen</strong> #8 2 Good <strong>Sand</strong> <strong>Control</strong> Factor withslightly less Performance Factorthan Purolator 125<strong>Screen</strong> #6 3 Average Performance and <strong>Sand</strong><strong>Control</strong> Factor<strong>Screen</strong> #4 4 Poor Performance and <strong>Sand</strong> <strong>Control</strong>Factors<strong>Screen</strong> #3 5 Poor Performance and <strong>Sand</strong> <strong>Control</strong>Factors<strong>Screen</strong> #2 6 Poor Performance and <strong>Sand</strong> <strong>Control</strong>Factors<strong>Screen</strong> #9 7 Very good Performance and verypoor <strong>Sand</strong> <strong>Control</strong> FactorsIt is important to note that the rankings in Table 3 aresubjective, based on the SE Plot , and cost and availability ofthe screen are not taken into consideration in this ranking.Close inspection of the raw data shown in Figure 5indicates that in some cases, the gravimetric curves do not goall the way to zero percent solids. This implies that the screenis still passing solids even at a 100 psi differential. In supportof this, inspection of the raw data plots used to generate thegravimetric data indicates the screens are indeed passingsolids up to a 100 psi differential. Figure 6 is a copy of a rawdata plot of psi vs. time for a screen tested in the North Seaprogram. <strong>The</strong>se traces show downward "spikes" as thepressure differential reaches higher values. <strong>The</strong>se downwardpressure "spikes" are thought to represent events where bysome mechanism the filter cake on the screen sample breaksdown an allows flow through the screen. During this event, itis very possible that solids are flowing through the screen,which in turn results in the presence of sand in the gravimetricsample during that time period. This type of behavior is causefor concern when considering the sand retention capability ofany screen type. Ideally, the screen will promote the formationof a stable filter cake that will eventually prevent theproduction of all sand through the screen. Not enough testinghas been done to determine if the pressure "spikes" are afunction of the relationship between the opening size of thescreen and the mean particle size distribution of the test sand,or is a function of the way the filter media of the screen ifmanufactured. Some consideration has been given to thepossibility that the pressure "spikes" are a function of theability of the filter media to "flex" at higher pressuredifferentials. If this is the case, filter media which is sinteredor by some other method stabilized enough to prevent the"flexing" is required. Additional testing is needed to addressthis issue.<strong>The</strong>re was some concern about the reproducibility of the<strong>Screen</strong> Efficiency test data from one lab to another. To addressthis issue, Chevron worked with manufacturer D to set up atest stand in the manufacturing center of manufacturer Dsimilar to the <strong>Screen</strong> Efficiency test stand at Chevron. A set oftest parameters was given to manufacturer D and a <strong>Screen</strong>Efficiency Test was run on screen #7. Figure 7 shows acomparison of the data sets generated by DTC andmanufacturer D on the same size screen. As shown, the twodata sets are within experimental error of one another. Thisexercise shows that if screen "plugging" tests are run exactlythe same by two different companies, the test proceduresproduce very similar results.West Africa Test ProgramSelection & Preparation of Test Samples. A similar testprogram was done for the West Africa Business Unit. <strong>The</strong><strong>Screen</strong> Efficiency Test program used a synthetic sand with aparticle size distribution ( PSD ) similar to the PSD shown inFigure 8 from one of the representative wells in the field inWest Africa. <strong>The</strong> sand was cleaned using the service companyprocedure described in the discussion of the North Sea testprogram.<strong>Screen</strong> Selection. <strong>The</strong> screens tested in the West Africaprogram are listed in Table 4TABLE 4SCREENS USED INWEST AFRICIA SCREEN EFFICIENCY TESTSManufacturer <strong>Screen</strong> Description*A 1A 2D 7C 5C 6B 3* from Table IPressure Profiles. <strong>The</strong> results of the individual pressureprofiles are shown in Figure 9. A comparison of the data inFigure 9 indicates that the <strong>Screen</strong> #1 plugs much quickerrelative to the other screens tested. <strong>The</strong> next grouping ofscreens appears to include the <strong>Screen</strong> #7 and <strong>Screen</strong> #3. <strong>The</strong>last grouping includes <strong>Screen</strong> #5, <strong>Screen</strong> #2 and <strong>Screen</strong> #6.As with the screen evaluation for the North Sea, using onlythe pressure profile plot data is potentially very misleadingwhen comparing the relative performance of the screens. It isalways desirable to use a screen which never plugs or takes avery long time to plug. However, another criteria for selectionof a screen depends on the amount of sand the operation canstand to produce. If a large amount of produced sand is
6 DAVID R. UNDERDOWN, WILLIAM VAUGHAN AND R. C. DICKERSON SPE 56591True Micron Rating<strong>The</strong> issue of "true micron rating" of the various screens is atopic of many debates between screen manufactures and theend user. <strong>The</strong> bottom line is that the numerical value providedby the manufacturer for a particular screen is not the truemicron rating of the screen. <strong>The</strong> number if more related tosome nominal rating which is not related to the true openingsize of the media. <strong>The</strong>re is no straightforward method fordetermining the "true micron rating" of a screen. A discussionabout how one service company determines the size of theopenings in their produce will serve as a very good example ofwhy determination of a "true micron rating" is not practical orsimple. A good example is how manufacturer A rates the"small" and "large" opening screens. At first glance, thesenumbers would probably be thought to represent therespective micron ratings of the screens. In reality, thenumbers do not. It is true that the screens with the largernumerical value probably have bigger openings in the wovensteel mesh than the screens with the smaller numerical value.However, once questioned closely about how the numberswere obtained, there are serious concerns about the validity ofthe number. It was found out that one way manufacturer Adetermined the size of the screen openings was by looking atthe openings under a microscope and measuring the"openings" with a vernier. This technique is very difficult andnot very precise, considering the shape of the openings.Another technique used by Baker was to flow a solids ladenfluid through the screen and measure the size of the particlepassing through the screen. This technique too is verysubjective, because of when the sample is taken. If the sampleis the very first one, there might be a chance of determiningthe largest particle the screen will allow to pass. However,once a filter cake of any type is formed, the size of theparticles coming through the screen will decrease.<strong>The</strong> preceding example represents an attempt to determinethe "true micron rating" of a screen material with a veryuniform opening. <strong>The</strong> problem is even worse with a materiallike that used by manufacturer B, which is a sintered metalfiber with a random pore throat size opening. <strong>The</strong>refore,Chevron has concluded that is it not practical to put muchstock in the numerical rating provided by the respectiveservice companies for their screens. <strong>The</strong> only true measure ofthe effectiveness of a screen for a particular formation is by a<strong>Screen</strong> Efficiency performance test.General CommentsIt is obvious from the data generated from the North Sea andWest Africa fields that comparison of sand control screens fora particular application is not straight forward. <strong>Sand</strong> controlsand performance criteria are important factors which theengineers deciding on which screen to select must decideweigh in choosing a screen for a particular application.However, the SE Plot method is a good tool to aid theengineer in making that decision.<strong>The</strong> ultimate aim of the screen evaluation programdiscussed in this report is to generate enough data sets fromdifferent formations and screens to generate a correlationbetween the particle size analysis of the formation and relativescreen performance. This type of correlation would then allowthe engineer to decide on a screen for a formation based on theparticle size distribution of the formation. Until enough datasets are generated, it is necessary to continue to use the SEPlot technique to evaluate the relative performance of screensfor each formation.Future WorkAs stated previously, the objective of this type of approach isto generate enough data sets to ultimately provide analgorithm which will allow an engineer select a sand controlscreen based on the particle size distribution and flux expectedfor a particular completion. It is hoped that the work describedin this report will generate enough interest in the operatingunits to result in additional requests for screen performanceevaluations, which in turn will provide the data necessary togenerate the desired algorithm.All the tests discussed in this report were done using disksof the "filter media" representative of each of the premiumscreens. A couple of other types of "filter media" have come tothe market since the completion of the lab portion of thiswork. <strong>The</strong>se include a metal fiber mesh somewhat like steelwool, and the other is a woven ceramic fiber. <strong>The</strong> steel wooltype media definitely has its place in the market, but probablynot for the North Sea. <strong>The</strong> advertised median openings areapproximately 250 microns. However, the ceramic fiber mediamay have application.Another concern raised by more than one of the screenmanufacturers is the contention that the total configuration ofthe sand control screen contributes to the overall performanceof the screen. By the total configuration, the screen suppliersmean the combination of inner drainage layer, sand controllayer, outer drainage layer and protective shroud. Asmentioned, the tests do date at DTC only include the sandcontrol layer. It might be worthwhile to do a short series oftests with the "total configuration" of a couple of screens froma short list of screens to determine the validity of these claims.Conclusions and Observations<strong>The</strong> following conclusions and observations are based on thedata presented in this paper:1. Test results indicate that the best way to evaluate a screenfor a particular application is a performance test with asand representative of the formation of interest.2. <strong>The</strong> relative ranking of screens based on pluggingtendency and sand retention vary as a function of particlesize distribution of the formation.3. <strong>The</strong> advertised number associated with most screens isnot very useful when comparing screens.4. <strong>Screen</strong>s with similar pressure response profiles can havemarkedly different solids retention curves for the samesand.
SPE 56591 THE NOMINAL SAND CONTROL SCREEN: A CRITICAL EVALUATION OF SCREEN PERFORMANCE 75. Results show that with the sands tested, screen plugging isa function of flux; i.e., the amount of sand challenging ascreen per volume fluid per unit time.Acknowledgements<strong>The</strong> authors of this paper would like to thank ChevronProduction Technology Company for permission to publishthis paper.References1. Ali, S. A., "<strong>Sand</strong> <strong>Control</strong> <strong>Screen</strong>s Exhibits Degrees ofPlugging," Hart's Petroleum Engineering International, July,1996.2. Lau, H. C. and Davis, C. L., "Laboratory Studies of Pluggingand Clean-Up of Production <strong>Screen</strong>s in Horizontal Wellbores,"SPE 38638, presented at 1997 SPE Annual TechnicalConference, San Antonio, Texas, October 5-8 1997.3. Marken, C., and Rφrvik, O., "Criteria for Production of DrillingFluids through <strong>Sand</strong> <strong>Control</strong> <strong>Screen</strong>s", SPE 38187, presented atEuropean Formation Damage Conference, <strong>The</strong> Hague, <strong>The</strong>Netherlands, June 2-3 1997.4. Schulien. S., Ovsthus, J., Hestenes, L., Neigart, B., and Nistad,T., "Scale Formation and Treatment in and Around <strong>Sand</strong> <strong>Control</strong><strong>Screen</strong>s", SPE 37305, presented at SPE InternationalSymposium on Oilfield Chemistry, Houston, Texas, February18-21, 1997.5. Browne, S., Ryan, D., Chambers, B., Gilchrist, J., and Bamforth,S., "Simple Approach to the Cleanup of Horizontal Wells withPrepacked <strong>Screen</strong> Completions", SPE 30116, presented at theSPE European Formation Damage Conference, <strong>The</strong> Hague, <strong>The</strong>Netherlands, May 15-16 1995.6. Lester, G., Malgrel, C., and Whitlock, M., " Field Application ofa New Cleanable and Damage Tolerant Downhole <strong>Screen</strong>", SPE30132, presented at the SPE European Formation DamageConference, <strong>The</strong> Hague, <strong>The</strong> Netherlands, May 15-16 1995.7. ANSI / NFPA T3.10.8.8 R1-1990Appendix A1. Mix 10.0 gms formation sand with 50 mL methylenechloride in 250 mL beaker2. Stir gently for 30 minutes at room temperature withmagnetic stirrer3. Remove stir bar and let mixture set quiescent for 1 - 2hours4. Decant supernate gently into 100 mL graduated cylinder5. Dry wet solids in 250 mL beaker @ 125°F for 1 - 2 hours6. Inspect 100 mL graduated cylinder for residual solids; ifsolids present, decant off supernate and recombine solidsfrom graduated cylinder into 250 mL beaker and re-drysolids @ 125°FAppendix B - Test Procedure<strong>The</strong> <strong>Screen</strong> Efficiency Test uses a cell and procedure adoptedfrom the University of Oklahoma originally developed forfilter industry called the “F-2 Test” (7). During themodification of the F2 Test procedure for the evaluation ofgravel pack screens, several of the service companies wereconsulted. Pall and Baker were directly involved in the designof the apparatus; and the test procedures were discussed withPall, Baker, Halliburton and Johnson at some point in thedevelopment of the current program. <strong>The</strong> test procedurecurrently used by DTC is, in general, the same type of testused by all the service companies. <strong>The</strong> major difference is thelevel of accuracy and precision of the data.<strong>The</strong> basis of the test is that a sample of screen is exposed (challenged ) with an oil containing a set amount of solids at aconstant flow rate ( i.e, flux ) . <strong>The</strong> solids have a particle sizedistribution characteristic of the formation the business unit isinterested in controlling. During the test, the pressuredifferential as a function of time is measured; as well as, theamount of solids passing through the screen. For a particularformation and set of potential screens, data sets are used togenerate a family of curves of pressure vs time, and sandretention vs time. Even though it is not possible to predict theactual life of a particular screen in a well using this technique,the procedure does provide a relative comparison of time toplug and sand retention for each screen based on the businessunit's formation characteristics.<strong>The</strong> experimental apparatus used in the <strong>Screen</strong> <strong>Evaluation</strong>tests is shown in Figures 14 & 15. Figure14 shows the overallequipment set up, and Figure 15 shows the cell used to holdthe screen samples.
8 DAVID R. UNDERDOWN, R. C. DICKERSON AND WILLIAM VAUGHAN SPE 56591PARTICLE SIZE HISTOGRAM NORTH SEA SAND40Solids Concentration, % by volume353025201510500.97 1.94 3.89 7.78 15.56 31.11 62.23 124.45 248.9 497.8Particle Size, micronFigure 1 – Particle Size Distribution – North Sea <strong>Sand</strong>PSIG10090807060504030201000 10 20 30 40 50 60 70 80 90 100Time, min<strong>Screen</strong> #1 <strong>Screen</strong> #7 <strong>Screen</strong> #9 <strong>Screen</strong> #6 <strong>Screen</strong> #3 <strong>Screen</strong> #5<strong>Screen</strong> #4 <strong>Screen</strong> #2 <strong>Screen</strong> #8Figure 2 – Pressure Profile – North Sea <strong>Sand</strong>
SPE 56591 THE NOMINAL SAND CONTROL SCREEN: A CRITICAL EVALUATION OF SCREEN PERFORMANCE 9504540Percent Original Solids353025201510500 1 2 3 4 5 6 7 8 9Dimensionless Time<strong>Screen</strong> #1 <strong>Screen</strong> #2 <strong>Screen</strong> #7 <strong>Screen</strong> #8 <strong>Screen</strong> #9<strong>Screen</strong> #3 <strong>Screen</strong> #4 <strong>Screen</strong> #5 <strong>Screen</strong> #6Figure 3 – Gravimetric Profile – North Sea <strong>Sand</strong>1.210.8<strong>Sand</strong> <strong>Control</strong>0.60.40.200 0.2 0.4 0.6 0.8 1 1.2Performance FactorFigure 4 – SE Plot – North Sea <strong>Sand</strong><strong>Screen</strong> #1 <strong>Screen</strong> #2 <strong>Screen</strong> #8 <strong>Screen</strong> #9 <strong>Screen</strong> #7 <strong>Screen</strong> #6 <strong>Screen</strong> #4 <strong>Screen</strong> #3
10 DAVID R. UNDERDOWN, R. C. DICKERSON AND WILLIAM VAUGHAN SPE 56591PSIG1009080706050403020100504540353025201510500 10 20 30 40 50 60 70 80 90 100Time, minPercent Original ConcentrationPressurePercentFigure 5 – Plot of Lab Data
SPE 56591 THE NOMINAL SAND CONTROL SCREEN: A CRITICAL EVALUATION OF SCREEN PERFORMANCE 11Figure 6 – Raw Lab Data
12 DAVID R. UNDERDOWN, R. C. DICKERSON AND WILLIAM VAUGHAN SPE 5659110090807060PSIG504030201000 10 20 30 40 50 60 70 80 90 100Time, minMANUFACTURER D DATACHEVRON DATAFigure 7 – Comparison of Test DataPARTICLE SIZE HISTOGRAM PLOT WEST AFRICIA SAND35Solids Concentration, % by volume3025201510500.97 1.94 3.89 7.78 15.56 31.11 62.23 124.45 248.9 497.8Particle Size, micronFigure 8 – Particle Size Distributions – West Africa <strong>Sand</strong>
SPE 56591 THE NOMINAL SAND CONTROL SCREEN: A CRITICAL EVALUATION OF SCREEN PERFORMANCE 13PSIG10090807060504030201000 20 40 60 80 100 120 140 160 180 200Time, min<strong>Screen</strong> #1 <strong>Screen</strong> #7 <strong>Screen</strong> #3 <strong>Screen</strong> #5 <strong>Screen</strong> #2 <strong>Screen</strong> #6Figure 9 – Pressure Profile – West Africa <strong>Sand</strong>100Percent Orginal Concentration90807060504030201000 20 40 60 80 100 120 140 160 180Time, min<strong>Screen</strong> #1 <strong>Screen</strong> #7 <strong>Screen</strong> #3 <strong>Screen</strong> #5 <strong>Screen</strong> #5<strong>Screen</strong> #2 <strong>Screen</strong> #6Figure 10 – Gravimetric profile – West Africa <strong>Sand</strong>
14 DAVID R. UNDERDOWN, R. C. DICKERSON AND WILLIAM VAUGHAN SPE 565911.41.2<strong>Sand</strong> <strong>Control</strong> Facter1.00.80.60.40.20.00.0 0.2 0.4 0.6 0.8 1.0 1.2 1.4Performance FactorSCREEN #1 SCREEN #7 SCREEN #3 SCREEN #2 SCREEN #6Figure 11 – SE Plot – West Africa <strong>Sand</strong>10010090908080PSIG70605040307060504030Percent Original Solids2020101000 25 50 75 100 125 150 175 200 225Time, min. (Normalized)0Alba Pressure Alba Percent Solids Nigeira Pressure Nigeria Percent SolidsFigure 12 – Comparison of North Sea and West Africa Plot
SPE 56591 THE NOMINAL SAND CONTROL SCREEN: A CRITICAL EVALUATION OF SCREEN PERFORMANCE 1510090807060PSIG504030201000 20 40 60 80 100 120 140 160 180 200Time, min0.1 gm/L 1.0 gm/L 3.0 gm/LFigure 13 – Effect of Flux
16 DAVID R. UNDERDOWN, R. C. DICKERSON AND WILLIAM VAUGHAN SPE 56591StirrerMixing TankRecirculating LineMoyno Pump Cell 1 Micron FilterTubing PumpTubing Pump5 Gallon Bucket 5 Gallon BucketOil with solids Clean OilFigure 14 – Schematic of Test Appactus
SPE 56591 THE NOMINAL SAND CONTROL SCREEN: A CRITICAL EVALUATION OF SCREEN PERFORMANCE 17Inlet“O” RingSpacers<strong>Screen</strong>Support ringOutletFigure 15 – Schematic of Test Cell