MSCP - EMC
MSCP - EMC
MSCP - EMC
- No tags were found...

Create successful ePaper yourself
Turn your PDF publications into a flip-book with our unique Google optimized e-Paper software.
FINDINGS OF THE MARKET SURVEILLANCE AND COMPLIANCE PANEL<strong>MSCP</strong>/2007/F1Market Surveillance and Compliance Panel (“<strong>MSCP</strong>”)Mr Joseph Grimberg, ChairProfessor Lim ChinMr Lee Keh SaiMr TPB MenonMr David WongDate21 March 2007SubjectHigh Regulation Prices from October 2006 to January 2007________________________________________________________________________INTRODUCTION1. From the last quarter of 2006 to the early months of 2007, the MarketSurveillance and Compliance Panel (‘<strong>MSCP</strong>’) has observed a surge in theaverage regulation price.2. In a letter dated 8 February 2007, a major electricity consumer requested the<strong>MSCP</strong> to investigate the regulation prices. The consumer observed that therehad been a substantial increase in the regulation price in the wholesale market in2007 over the historical average price levels. The consumer expressed that thiswas an unacceptable outcome in a competitive market. It had resulted in asignificant increase in the cost of electricity for consumers.3. The consumer recommended that the high regulation price outcomes beinvestigated to determine the following:a. Is capacity capable of providing regulation being intentionally withheld?b. Are there any noticeable consistencies in bidding behaviour whichhistorically were not occurring?c. What is the root cause of higher flat average regulation prices?d. Why are these high regulation prices not signaling a competitive responsefrom market participants capable of providing regulation?Page 1 of 14
<strong>MSCP</strong> INVESTIGATION4. Section 4.1.1 of Chapter 3 of the Singapore Electricity Market Rules (the ‘marketrules’) provides for the <strong>MSCP</strong> to assess whether the underlying structure of thewholesale electricity markets is consistent with the efficient and fair operation of acompetitive market.5. Under section 4.6.1 of Chapter 3, the <strong>MSCP</strong> may in accordance with section 4.8initiate an investigation into any activities in the wholesale electricity markets orthe conduct of a market participant, market support services licensee, the <strong>EMC</strong>or the PSO that is brought to the attention of the <strong>MSCP</strong> by way of referral orcomplaint from any source. Section 4.8 of Chapter 3 also provides that the<strong>MSCP</strong> may report any findings to Energy Market Company, the Power SystemOperator (‘PSO’) or the Energy Market Authority (‘EMA’).6. Having regard to the above, the <strong>MSCP</strong> decided to initiate an investigation intothe high regulation prices.REVIEW PERIOD7. The high regulation price trend was first observed in October 2006 when theregulation price jumped from an average of $18.1/MWh in September 2006 to$85.9/MWh. This was also higher than the average of $53.4/MWh for the firstnine months of the year. The high regulation price trend continued at an averageof $85.9/MWh in November 2006 and $187.0/MWh in December 2006 beforesetting a record high of $719.5/MWh in January 2007.8. Although the regulation price remained high in February 2007 at $228.9/MWh, itfell to an average of $75/MWh for the first ten days of March 2007.9. On 9 February 2007, the regulator EMA informed market players that it wasinvestigating the high regulation prices. The <strong>MSCP</strong> observed that around thetime of this announcement, regulation prices dropped significantly.10. The <strong>MSCP</strong> has therefore focused its investigation on the period October 2006 toJanuary 2007 (the ‘review period’).INVESTIGATION METHODOLOGY11. The <strong>MSCP</strong> has carried out its investigation by reviewing the overall design andstructure of the regulation market.12. The performance of the regulation market during the review period wascompared with its past performance.13. The requirement for regulation is determined to be 100 MW by the PSO and hasnot changed since market start in 2003. Given that demand in the regulationmarket is fixed, detailed analysis was carried out on supply conditions such asplant outages, regulation offer quantities and regulation offer prices. This assistsPage 2 of 14
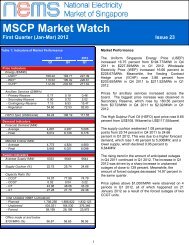
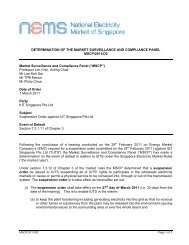
Regulation Price30002500200015001000500Chart 1: Regulation Price Duration CurveAverage Regulation Price2003-$36.5/MWh2004-$32.6/MWh2005-$68.7/MWhJan 06 to Sep 06-$53.4/MWhOct 06 to Jan 07-$269.6/MWh00% 10% 20% 30% 40% 50% 60% 70% 80% 90% 100%-5002003 2004 2005 Jan 2006-Sep 2006 Oct 2006-Jan 2007Table 1: Regulation Price by Percentage of HoursRegulation Price ($/MWh)2003 2004 2005Jan 06-Sep 06Oct 06-Jan 07Up to 10% Hours 14.0 5.5 28.0 2.9 1.1Up to 20% Hours 24.0 25.0 28.0 27.6 5.0Up to 30% Hours 27.0 28.0 28.0 28.0 18.7Up to 40% Hours 29.0 28.0 29.0 29.0 18.9Up to 50% Hours 29.0 28.0 30.0 29.0 28.2Up to 60% Hours 29.0 28.0 32.3 31.0 45.4Up to 70% Hours 34.0 29.0 39.0 38.8 393.4Up to 80% Hours 39.0 29.0 39.0 40.0 805.0Up to 90% Hours 50.1 39.0 50.9 49.0 900.0Up to 91% Hours 50.1 39.0 55.8 50.0 900.0Up to 92% Hours 50.1 39.0 59.0 51.3 908.1Up to 93% Hours 51.3 39.0 63.8 59.0 920.0Up to 94% Hours 56.0 39.0 70.0 60.0 950.0Up to 95% Hours 59.0 48.9 87.9 71.5 1000.0Up to 96% Hours 59.0 49.0 150.0 98.3 1110.0Up to 97% Hours 59.0 50.1 200.0 164.4 1200.0Up to 98% Hours 70.1 61.4 359.4 281.3 1250.0Up to 99% Hours 88.9 115.5 1500.0 370.7 1350.0Regulation prices wererelatively unchangedbetween 2003 and 2006 forup to 92% of the time, priorto the high regulationprices from Oct 2006Regulation pricesincreased substantiallyduring the last 5 to 6 % ofthe time18. The price distribution curve in Chart 2 shows that regulation prices in generalhave become more disperse since market start until September 2006. Althoughthe median for regulation prices remained at between $20/MWh and $30/MWhprior to the high regulation prices in October 2006, this percentage dropped froma peak of nearly 70 percent in 2004 to around 44 percent between January andSeptember 2006.Page 4 of 14
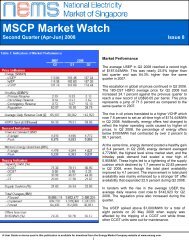
19. For the review period, the price distribution curve also shows deviation from thepast, with the median for regulation prices shifting to more than $100/MWh. Infact, only 8.2 percent of the regulation prices during the review period fell into the$20/MWh to $30/MWh price range.Percentage of Price100%90%80%70%60%50%40%30%20%10%0%Chart 2: Regulation Price Distribution Curve80
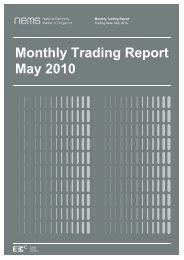
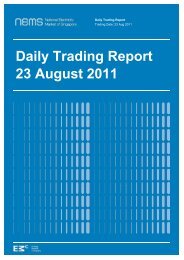
Chart 3a to 3d: Volatility of Regulation Prices since Market Start in 200327502500 02250200017501500125010007505002500Jan Feb Mar Apr May Jun Jul Aug Sep Oct Nov DecRegulation Spot Price for 2003275025002250200017501500125010007505002500Jan Feb M ar Apr M ay Jun Jul Aug Sep Oct Nov DecRegulation Spot Price for 2004275025002250200017501500125010007505002500Jan Feb M ar Apr M ay Jun Jul Aug Sep Oct Nov DecRegulation Spot Price for 2005275025002250200017501500125010007505002500Jan Feb M ar Apr M ay Jun Jul Aug Sep Oct Nov Dec JanRegulation Spot Price for 2006 & Jan 200721. In summary, although average prices and volatility have generally increased inthe regulation market since market start in 2003, the price pattern during thereview period deviated from the trends which were observed prior to that period.OBSERVATIONS AS TO SUPPLY CONDITIONS22. Given that the high regulation prices only emerged in October 2006, the <strong>MSCP</strong>has for the purpose of this investigation used supply data starting from April 2006for supply comparison and analysis. The three supply conditions comprising plantoutages, regulation offer quantities and regulation offer price are consideredbelow.a. Plant Outages23. As shown in Table 2, with the exception of January 2007, there was in general nosignificantly higher level of total planned outages for regulation providers (i.e.combined cycle gas turbines (‘CCGTs’) and steam turbines) during the reviewperiod. The average level of planned outages for such facilities was 609.2MWbetween April 2006 and September 2006 compared to 518.1MW during thereview period.Page 6 of 14
24. However, the <strong>MSCP</strong> noticed a substantial jump in CCGT planned outages tomore than 800MW in January 2007 compared to less than 400MW between Apriland December 2006. This was the highest number recorded since market startand involved three CCGTs.Table 2: Planned Outages by Types,April 2006-January 2007Planned Outages (MW)ST CCGT TotalApr-06 1052.15 305.37 1357.52May-06 806.54 397.13 1203.67Jun-06 858.05 218.48 1076.53Jul-06 741.10 240.00 981.10Aug-06 1390.67 258.19 1648.86Sep-06 700.72 341.99 1042.72Oct-06 610.94 390.11 1001.05Nov-06 583.24 245.93 829.17Dec-06 658.77 391.13 1049.90Jan-07 459.68 805.23 1264.90Total: 7861.86 3593.56 11455.42b. Regulation Offer Quantities25. Table 3 shows the average regulation offer quantities between April 2006 andJanuary 2007 that meet the conditions for providing regulation specified in themarket rules.26. Based on historical price behavior, two major factors which had caused highregulation prices were:a. Low energy demand – During periods of low energy demand, the quantityof energy that generation units are scheduled to dispatch may drop. Thismay result in the generation units failing to meet their respectiveregulation minimum condition and therefore not be selected to provideregulation;b. Commissioning of new generation units – During its commissioning, ageneration unit can provide energy but not regulation. Assuming noincrease in energy demand, with the greater competition to provideenergy, which the commissioning unit introduces, this means that thequantity of energy that other generation units are scheduled to dispatchmay drop. This may again result in these other generation units failing tomeet their respective regulation minimum condition and therefore not beselected to provide regulation.In both the above cases, a reduction in the total regulation offer quantity can beexpected, leading to high regulation prices.Page 7 of 14
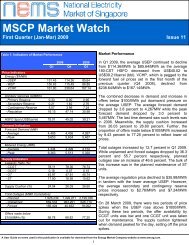
Table 3: Regulation Offers in MW,April 2006-January 2007Regulation Offers (MW)Total AverageApr-06 265,419 184.32May-06 285,378 191.79Jun-06 276,701 192.15Jul-06 205,882 138.36Aug-06 273,465 183.78Sep-06 290,786 201.93Oct-06 283,196 190.32Nov-06 267,190 185.55Dec-06 284,181 190.98Jan-07 274,312 184.35Total: 2,706,510 184.3527. Although the review period coincided with low energy demand in some periodsand the commissioning of a new CCGT unit, Table 3 shows that the quantities ofregulation on offer during the review period were not significantly lower. In fact,the lowest supply figure was recorded in July 2006, which was outside of thereview period.c. Regulation Offer Prices28. Our analysis of regulation offer price behaviour showed that supply patterns werequite similar between April 2006 and September 2006, as can be seen fromChart 3. However, this changed dramatically beginning from October 2006, withhigher average regulation offer prices observed. The following changes in offerpatterns during the review period compared to the period between April 2006 andSeptember 2006 were also observed:a. In general, the proportion of offers in the lower price range of $0.01/MWhto $100/MWh and the extremely high price range of more than$2000/MWh had dropped;b. The proportion of offers falling within the $100.01/MWh to $2000/MWhprice range had increased.Page 8 of 14
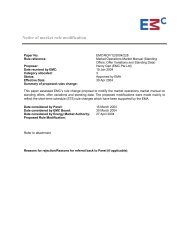
Percentage of Offer Prices100%90%80%70%60%50%40%30%20%10%0%Chart 3: Offer Price Distributions30.8% 17.3% 1.8%0.7%16.0% 2.6%36.7%23.8% 4.6%37.6%36.6%34.7%34.6%44.3%33.5%35.5%37.3%$0/MWh26.1%27.3%29.6%40.0%31.6%27.8%29.6%$0.01/MWh-$50/MWh5.3%8.0%10.4%2.6%1.1%0.8%1.0%0.5%0.5%1.8%3.9% 0.5%0.5%3.9%4.1%$50.01/MWh-$100/MWh1.6%$100.01/MWh-$500/MWh16.2%16.6%7.8%1.0%0.1% 0.2% 0.3% 0.0% 0.7%0.2%$500.01/MWh-$1000/MWh9.2%4.4%1.5%0.5%0.3%0.3%0.0%1.4%0.5% 0.5%0.4%0.3%0.7%0.3% 0.2% 0.3% 0.1%0.1%0.1%$1000.01/MWh-$1500/MWhApr-06 May-06 Jun-06 Jul-06 Aug-06 Sep-06 Oct-06 Nov-06 Dec-06 Jan-07$1500.01/MWh-$2000/MWh20.8%23.9%25.7%29.9%31.1%26.9%2.1%30.0%31.9%26.8%>$2000/MWhd. Summary29. In summary, the analysis of supply conditions shows that the level of plannedoutages and quantities of regulation offered generally did not deviate fromhistorical trends during the review period.30. The only exception was the higher than previously seen level of planned outagesfor CCGTs in January 2007. This contributed to offers in the $0/MWh price rangefalling to their lowest level of 30.8 percent in January 2007 compared to 33.5 to44.3 percent between April 2006 and December 2006.31. However, the pricing of regulation offers had changed during the review period.There was a significant shift in capacity which was historically offered at eitherthe $0.01/MWh to $100/MWh price range or the exceeding $2000/MWh pricerange, to the $100.01/MWh to $2000/MWh price range.REASONS FOR HIGH REGULATION PRICES32. Based on our above analysis, the high regulation prices during the review periodwere the result of the following:a. Regulation offers particularly those at the lower price bands ($0.01/MWhto $100/MWh) and the extremely high price band (more than$2000/MWh) were converging at the $100.1/MWh to $2000/MWh priceband;Page 9 of 14
. This had led to more regulation prices clearing at the higher $100.1/MWhto $2000/MWh price band compared to the lower price band of$0.01/MWh to $100/MWh and extremely high price band of more than$2000/MWh;c. The maintenance of up to three CCGT plants worsened the supplycondition in January 2007 as capacity offered at $0/MWh droppedsignificantly to 30.8 percent from an average of 36.8 percent betweenApril 2006 and December 2006.MARKET EFFICIENCY33. Under the market rules, the role of the <strong>MSCP</strong> is to assess if the underlyingstructure of the wholesale electricity markets is consistent with the efficient andfair operation of a competitive market. The <strong>MSCP</strong> considered this question withregard to the regulation market performance during the review period.34. The <strong>MSCP</strong>’s observations are set out in the following paragraphs.a. Energy Supply Cushion35. The average supply cushion for energy has been declining from a high of 26.4percent in 2003 to 23.6 percent in 2006.36. The supply cushion measures spare capacity available after dispatch. Itindicates the amount of capacity available to meet additional demand or suddendrop in supply such as outages.37. As the supply cushion declines, the capacity set aside for reserve and regulationto meet any imbalances between load and supply will become more valuable. Adeclining supply cushion can therefore be expected to give rise to increasingreserve and regulation prices.b. Planned Outages38. With the all-time high level of CCGT planned outages in January 2007, it wasalso conceivable that prices would be higher than usual in January 2007.39. Nonetheless, January was only one of the months during the review period.Higher regulation prices had been observed since October 2006.c. Magnitude and Speed of Change of High Prices40. Since market start, it has not been unusual to observe big movements in averageregulation prices even on a monthly basis. As shown in Chart 4, the month-onmonthchange in regulation prices can swing between about negative 50 to 150percent prior to the high regulation prices in October 2006.41. However, it is also clear from Chart 4 that during the review period, the highprices had deviated from the normal trend observed historically, both in terms ofthe magnitude of change and the speed at which changes occurred.Page 10 of 14
400%Chart 4: Average Regulation Prices vs.Month on Month Change in Regulation Prices$/MWh800Month-on-Month Changein Average RegulationPrice350%300%250%200%150%100%50%0%Jan-03-50%Jul-03 Jan-04 Jul-04 Jan-05 Jul-05 Jan-06 Jul-06 Jan-07-100%7006005004003002001000Average Regulation PriceMonth-on-Month Change in Regulation PricesMonthly Average Regulation Pricesd. Energy Prices and Fuel Cost42. Since hitting a high of $167.4/MWh in August 2006, the average energy price(Uniform Singapore Energy Price or USEP) has been generally lower as shownin Chart 4 below. The declining fuel cost and energy demand in some periodswere the primary reasons behind the lower USEP.43. The prices for High Sulphur Fuel Oil (‘HSFO’) (see Chart 5), the most relevantfuel reference price for generation companies in Singapore, dropped from anaverage of US$51.4 a barrel between April and September 2006 to an averageof US$43 a barrel during the review period.44. However, unlike energy prices, the regulation price performance during thereview period did not reflect the performance of the underlying fuel oilfundamental.Page 11 of 14
$/MWh180160140120100806040200USEPChart 5: Regulation Prices & USEPApr-06 May-06 Jun-06 Jul-06 Aug-06 Sep-06 Oct-06 Nov-06 Dec-06 Jan-07$/MWh8007006005004003002001000Regulation PriceUSEPRegulation PricesUS$/barrel60HSFO555045403530Chart 6: Regulation Prices & Fuel Oil PricesApr-06 May-06 Jun-06 Jul-06 Aug-06 Sep-06 Oct-06 Nov-06 Dec-06 Jan-07$/MWh8007006005004003002001000Regulation PriceFuel Oil PricesRegulation Pricese. Offer Prices45. The increasing regulation offer prices between the $100.01/MWh and$2000/MWh price range since October 2006 was mainly responsible for thehigher average prices during the review period.f. Market Reaction to Regulator Announcement on 9 February46. Around the time when the EMA informed market players on 9 February 2007 thatit was investigating the high regulation prices, the <strong>MSCP</strong> observed a significantdrop in the regulation prices as shown in Chart 7, Table 4 and Table 5.Page 12 of 14
47. The following price trends were observed:a. Area A (1 to 8 February 2007) – In February, prior to the EMA’sannouncement, almost 98 percent of the regulation price still cleared atbetween $100.01/MWh and $1000/MWh as the percentage of offersbetween $100.01/MWh and $2000/MWh remained high at 30.9 percent;b. Area B (9 to 16 February 2007) – This period coincided with the EMA’sannouncement of an investigation into the high regulation prices.Although occasional price spikes were still observed, most regulationprices cleared at less than $100/MWh. This was accompanied bychanges in offer prices as the percentage of offers between $100.1/MWhand $2000/MWh dropped to 23.7 percent;c. Area C (17 to 28 February 2007) – The return of a CCGT unit previouslyon planned maintenance helped reduce volatility as the averageregulation price dropped to $79.6/MWh with the percentage of pricescleared below $100/MWh strengthening to 80 percent;d. Area D (1 to 10 March 2007) – The total capacity of regulation offereddropped to an average of 174MW (see Table 5) as up to three CCGT swere on planned maintenance during this period. This led to higher pricevolatility. However, the average regulation price was lower as thepercentage of offers at less than $100/MWh continued to strengthen.$/MWh1400Chart 7: Regulation Prices between 1 Feb 07 to 10 Mar 071200Regulation Prices1000800600400ABD200C001-Feb 05-Feb 09-Feb 13-Feb 17-Feb 21-Feb 25-Feb 01-Mar 05-Mar 09-MarRegulation Spot PricesPage 13 of 14
Table 4: Regulation Price Pattern between 1 February-10 March 2007Regulation Price ($/MWh)Area A Area B Area C Area DAverage Regulation Price 499.8 110.8 79.6 75.5Maximum Regulation Price 1150.0 900.0 628.1 900.0% of Prices in the $0/MWh to$100/MWh Range% of Prices in the $100.01/MWhto $2000/MWh Range13.28% 69.27% 80.03% 81.04%86.72% 30.73% 19.97% 18.96%Table 5: Regulation Offer Pattern between 1 February-10 March 2007Regulation OffersAverage Regulation OfferQuantity% of Offers in the $0/MWh to$100/MWh Range% of Offers in the $100.01/MWhto $2000/MWh RangeArea A Area B Area C Area D198.2 192.0 201.2 174.948.68% 52.93% 51.44% 53.42%30.88% 23.71% 25.51% 23.61%CONCLUSION48. Having regard to the above, in our view, the regulation price performance duringthe review period indicates that the current regulation market structure warrantscloser review.49. Given that the regulator EMA has informed the industry that it is investigating thehigh regulation prices, the <strong>MSCP</strong> notes that this matter is receiving the requisiteattention.Joseph GrimbergChair, Market Surveillance and Compliance PanelPage 14 of 14