View - Dr. DS Kothari
View - Dr. DS Kothari
View - Dr. DS Kothari
- No tags were found...

You also want an ePaper? Increase the reach of your titles
YUMPU automatically turns print PDFs into web optimized ePapers that Google loves.
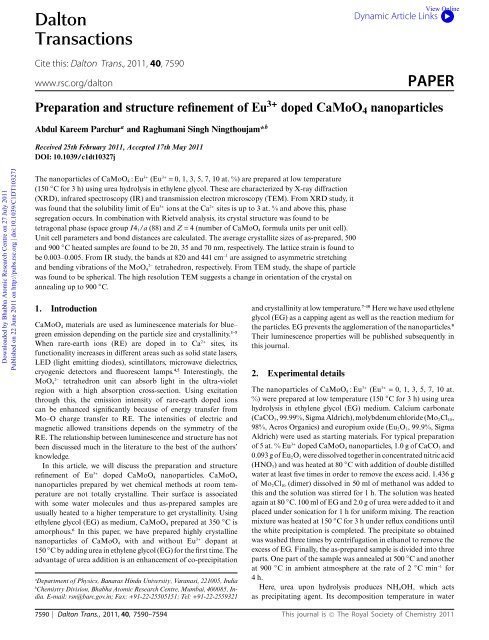
DaltonTransactionsDynamic Article Links<strong>View</strong> OnlineCite this: Dalton Trans., 2011, 40, 7590www.rsc.org/daltonPAPERPreparation and structure refinement of Eu 3+ doped CaMoO 4 nanoparticlesAbdul Kareem Parchur a and Raghumani Singh Ningthoujam* bReceived 25th February 2011, Accepted 17th May 2011DOI: 10.1039/c1dt10327jDownloaded by Bhabha Atomic Research Centre on 27 July 2011Published on 22 June 2011 on http://pubs.rsc.org | doi:10.1039/C1DT10327JThe nanoparticles of CaMoO 4 :Eu 3+ (Eu 3+ = 0, 1, 3, 5, 7, 10 at. %) are prepared at low temperature(150 ◦ C for 3 h) using urea hydrolysis in ethylene glycol. These are characterized by X-ray diffraction(XRD), infrared spectroscopy (IR) and transmission electron microscopy (TEM). From XRD study, itwas found that the solubility limit of Eu 3+ ions at the Ca 2+ sitesisupto3at.%andabovethis,phasesegregation occurs. In combination with Rietveld analysis, its crystal structure was found to betetragonal phase (space group I4 1 /a (88) and Z = 4 (number of CaMoO 4 formula units per unit cell).Unit cell parameters and bond distances are calculated. The average crystallite sizes of as-prepared, 500and 900 ◦ C heated samples are found to be 20, 35 and 70 nm, respectively. The lattice strain is found tobe 0.003–0.005. From IR study, the bands at 820 and 441 cm -1 are assigned to asymmetric stretchingand bending vibrations of the MoO 42-tetrahedron, respectively. From TEM study, the shape of particlewas found to be spherical. The high resolution TEM suggests a change in orientation of the crystal onannealing up to 900 ◦ C.1. IntroductionCaMoO 4 materials are used as luminescence materials for blue–green emission depending on the particle size and crystallinity. 1–5When rare-earth ions (RE) are doped in to Ca 2+ sites, itsfunctionality increases in different areas such as solid state lasers,LED (light emitting diodes), scintillators, microwave dielectrics,cryogenic detectors and fluorescent lamps. 4,5 Interestingly, the2-MoO 4 tetrahedron unit can absorb light in the ultra-violetregion with a high absorption cross-section. Using excitationthrough this, the emission intensity of rare-earth doped ionscan be enhanced significantly because of energy transfer fromMo–O charge transfer to RE. The intensities of electric andmagnetic allowed transitions depends on the symmetry of theRE. The relationship between luminescence and structure has notbeen discussed much in the literature to the best of the authors’knowledge.In this article, we will discuss the preparation and structurerefinement of Eu 3+ doped CaMoO 4 nanoparticles. CaMoO 4nanoparticles prepared by wet chemical methods at room temperatureare not totally crystalline. Their surface is associatedwith some water molecules and thus as-prepared samples areusually heated to a higher temperature to get crystallinity. Usingethylene glycol (EG) as medium, CaMoO 4 prepared at 350 ◦ Cisamorphous. 6 In this paper, we have prepared highly crystallinenanoparticles of CaMoO 4 with and without Eu 3+ dopant at150 ◦ Cbyaddingureainethyleneglycol(EG)forthefirsttime.Theadvantage of urea addition is an enhancement of co-precipitationaDepartment of Physics, Banaras Hindu University, Varanasi, 221005, IndiabChemistry Division, Bhabha Atomic Research Centre, Mumbai, 400085, India.E-mail: rsn@barc.gov.in; Fax: +91-22-25505151; Tel: +91-22-2559321and crystallinity at low temperature. 7–10 Here we have used ethyleneglycol (EG) as a capping agent as well as the reaction medium forthe particles. EG prevents the agglomeration of the nanoparticles. 8Their luminescence properties will be published subsequently inthis journal.2. Experimental detailsThe nanoparticles of CaMoO 4 :Eu 3+ (Eu 3+ = 0, 1, 3, 5, 7, 10 at.%) were prepared at low temperature (150 ◦ C for 3 h) using ureahydrolysis in ethylene glycol (EG) medium. Calcium carbonate(CaCO 3 , 99.99%, Sigma Aldrich), molybdenum chloride (Mo 2 Cl 10 ,98%, Acros Organics) and europium oxide (Eu 2 O 3 , 99.9%, SigmaAldrich) were used as starting materials. For typical preparationof 5 at. % Eu 3+ doped CaMoO 4 nanoparticles, 1.0 g of CaCO 3 and0.093 g of Eu 2 O 3 were dissolved together in concentrated nitric acid(HNO 3 )andwasheatedat80 ◦ C with addition of double distilledwater at least five times in order to remove the excess acid. 1.436 gof Mo 2 Cl 10 (dimer) dissolved in 50 ml of methanol was added tothis and the solution was stirred for 1 h. The solution was heatedagain at 80 ◦ C. 100 ml of EG and 2.0 g of urea were added to it andplaced under sonication for 1 h for uniform mixing. The reactionmixture was heated at 150 ◦ C for 3 h under reflux conditions untilthe white precipitation is completed. The precipitate so obtainedwas washed three times by centrifugation in ethanol to remove theexcess of EG. Finally, the as-prepared sample is divided into threeparts. One part of the sample was annealed at 500 ◦ C and anotherat 900 ◦ C in ambient atmosphere at the rate of 2 ◦ Cmin -1 for4h.Here, urea upon hydrolysis produces NH 4 OH, which actsas precipitating agent. Its decomposition temperature in water7590 | Dalton Trans., 2011, 40, 7590–7594 This journal is © The Royal Society of Chemistry 2011
<strong>View</strong> OnlineTable 1Parameters obtained after refinement of observed XRD dataCompositionsParameters CaMoO 4 3at.%Eu 3+ doped CaMoO 4Downloaded by Bhabha Atomic Research Centre on 27 July 2011Published on 22 June 2011 on http://pubs.rsc.org | doi:10.1039/C1DT10327JCa (x, y, z) (0, 1/4, 5/8) (0, 1/4, 5/8)Mo (x, y, z) (0, 1/4 1/8) (0, 1/4, 1/8)O(x, y, z) (0.145, 0.047, 0.205) (0.151, 0.023, 0.209)Angles (a, b, g ) (90, 90, 90) (90, 90, 90)Lattice parameters (a, c) inÅ a = 5.243, c = 11.381 a = 5.239, c = 11.381Unit cell volume in Å 3 312.89 312.49Isotropic temperature factors B (Ca, Mo, O) (10.2, 0.5, 9.4) (9.1, 0.5, 9.6)c 2 1.4 1.2Ca–O1 2.477 2.476Ca–O2 2.449 2.448Mo–O1 1.765 1.764improve as compared to 500 ◦ C heated sample. The extra peaksat 14.08, 22.13, 23.67 and 24.37 ◦ could be observed distinctly for5, 7 and 10 at. % Eu 3+ and their intensities increase as the Eu 3+concentration increases from 5 to 10 at. %. These peaks may berelated to MoO 3 and other Eu–Mo–O compounds, but could notbe distinguished in this study. The average crystallite size of 900 ◦ Cheated samples is found to be ~70 nm. Strain (e) present in lattice iscalculated 12,13 and e values of 1, 3 and 5 at. % Eu 3+ doped CaMoO 4samples heated at 900 ◦ C are found to be 0.003, 0.004 and 0.005,respectively indicating increase in strain with increasing Eu 3+ .Fig. 4 shows the XRD-Rietveld plot for pure and 3 at. % Eu 3+doped CaMoO 4 heated at 900 ◦ C. Based on space group I4 1 /a(88) and Z = 4 (number of CaMoO 4 formula units per unit cell),positions of the respective atoms are Ca: (4b: 0, 1/4, 5/8), Mo: (4a:0, 1/4, 1/8) and O: (16f: x, y, z). 17 Fitting parameters are given inTable 1. The crystal structure and symmetry favorably match thatin Fig. 5, showing high inversion symmetry of the nanoparticlespresent. Calcium molybdate belongs to scheelite-like structure,which is represented by the generic formula ABO 4 ,whereA= Ca,Ba, Sr, Pb and B = Mo, W with tetragonal structure having spacegroup I4 1 /a (88) and body-centered inversion symmetry. 1–3,17 TheA and B sites have S 4 point symmetry. Its crystal structure hastwo building blocks of CaO 8 polyhedra and MoO 4 tetrahedra.In the c-direction, CaO 8 polyhedron shares four of its edges withfour other CaO 8 polyhedron through O atoms. There are O atomssharing among CaO 8 polyhedron and MoO 4 tetrahedron. Each Oatom links with two Ca atoms and one Mo atom. There are twodifferent Ca–O bond lengths in CaO 8 and one Mo–O bond lengthin MoO 4 . Indeed, Ca sites with pair symbols 1–1, 2–2, 3–3 haveinversion symmetry and similarly Mo sites with pair symbols i–i,ii–ii, iii–iii have inversion symmetry at the center of unit cell.3.2 FT–IR studyThe FT–IR spectra of the as-prepared, 500 and 900 ◦ C annealednanoparticles of CaMoO 4 in the wavenumber range of 400–4000 cm -1 are shown in Fig. 6. It can be seen that all samplesshow approximately similar peaks. The bands 1558 cm -1 and3410 cm -1 correspond to H–O–H bending vibration and O–Hstretching vibration, respectively. 7–10 The bands at 820 and 441cm -1 are assigned to asymmetric stretching and bending vibrations2-of MoO 4 tetrahedron, respectively. 18–20 In the as-prepared samplea peak at 2918 cm -1 indicates the C–H stretching vibration fromEG molecules present on the surface of the nanoparticles. 7–10 TheFig. 4 Rietveld-XRD plots of pure and 3 at. % Eu 3+ doped CaMoO 4samples heated at 900 ◦ C.intensity corresponding to O–H decreases with increasing heattreatmenttemperature. Different reports for peaks correspondingto Ca–O at 732 and 437 cm -1 are found. 21,22 Even if Ca–Opeak is present in the spectrum, this will be merged with Mo–Obands.7592 | Dalton Trans., 2011, 40, 7590–7594 This journal is © The Royal Society of Chemistry 2011
<strong>View</strong> OnlineDownloaded by Bhabha Atomic Research Centre on 27 July 2011Published on 22 June 2011 on http://pubs.rsc.org | doi:10.1039/C1DT10327JFig. 5 (a) Ball and stick model, (b) and (c) polyhedra representationsfrom different projections in a unit cell. In (a), Ca sites with pair symbols1–1, 2–2, 3–3 have inversion symmetry (i) and similarly Mo sites with pairsymbols i–i, ii–ii, iii–iii have inversion symmetry (i).Fig. 7 Images of (a) TEM, (b) SAED and (c) HRTEM of as-preparedCaMoO 4 .plane of tetragonal phase. Fig. 8(a) shows the HRTEM imageof 900 ◦ C heated sample. It clearly shows an improvement incrystallinity and d = 3.2 Å, which matches with hkl = 112 plane.This suggests a change in crystal orientation when as-preparedsample is heated to 900 ◦ C. Using a Fast Fourier Transformation(FFT) program, the improved clarity of HRTEM image is seen(Fig. 8(b, c)).Fig. 6 FT–IR spectra of as-prepared, 500 and 900 ◦ C heated CaMoO 4samples.3.3 TEM studyFig. 7(a) shows the TEM image of pure as-prepared CaMoO 4sample. Spherical particles of 20 nm size are observed. Its selectedarea electron diffraction is shown in Fig. 7(b). Based on atetragonal phase, the rings are observed and (hkl) planesareindexed. The high resolution TEM (HRTEM) image suggeststhat particle is crystalline (Fig. 7(c)). The lattice fringe couldbe observed and d = 2.8 Å, which matches with hkl = 004Fig. 8 Images of (a) HRTEM, (b) FFT and (c) HRTEM after FFTprocess of 900 ◦ C heated CaMoO 4 .This journal is © The Royal Society of Chemistry 2011 Dalton Trans., 2011, 40, 7590–7594 | 7593
<strong>View</strong> OnlineDownloaded by Bhabha Atomic Research Centre on 27 July 2011Published on 22 June 2011 on http://pubs.rsc.org | doi:10.1039/C1DT10327J4. ConclusionsWell-crystalline nanoparticles of Eu 3+ doped CaMoO 4 have beenprepared at 150 ◦ C using urea hydrolysis in ethylene glycol. Theas-prepared samples were heated at 500 and 900 ◦ Ctoincreasethe particle size and crystallinity. The structure was found to betetragonal with space group I4 1 /a. Eu 3+ can substitute Ca 2+ sitesup to 3 at. % and above this concentration, extra phases are found.Lattice fringes could be seen clearly when a FFT method was used.AcknowledgementsA. K. Parchur acknowledges the financial support providedby University Grants Commission, Govt. of India through theD. S. <strong>Kothari</strong> Post Doctoral Fellowship. Authors thank <strong>Dr</strong> T.Mukherjee, Chemistry Group and <strong>Dr</strong> D. Das, Chemistry Division,BARC for their support and encouragement during this work.References1 G. Blasse and B. C. Grabmaier, Luminescent Materials, Springer,Berlin, 1994.2 F.LeiandB.Yan,J. Solid State Chem., 2008, 181, 855.3 F. Zhu, Z. Xiao, F. Zhang, L. Yan and A. Huang, J. Lumin., 2011, 131,22.4 V. S. Marques, L. S. Cavalcante, J. C. Sczancoski, A. F. P. Alcantara,M. O. Orlandi, E. Moraes, E. Longo, J. A. Varela, M. S. Li and M. R.M. C. Santos, Cryst. Growth Des., 2010, 10, 4752.5 V. M. Longo, A. T. de Figueiredo, A. B. Campos, J. W. M. Espinosa, A.C. Hernandes, C. A. Taft, J. R. Sambrano, J. A. Varela and E. Longo,J. Phys. Chem. A, 2008, 112, 8920.6 H. Lei, X. Zhu, S. Zhang, G. Li, X. Tang, W. Song, Z. Yang, J. Dai andY. Sun, J. Phys. D: Appl. Phys., 2009, 42, 045404.7 M. Niraj Luwang, R. S. Ningthoujam, Jagannath, S. K. Srivastava andR. K. Vatsa, J. Am. Chem. Soc., 2010, 132, 2759.8 N. Yaiphaba, R. S. Ningthoujam, N. Shanta Singh, R. K. Vatsa, N. R.Singh, S. Dhara, N. L. Misra and R. Tewari, J. Appl. Phys., 2010, 107,034301.9 R. S. Ningthoujam, Chem. Phys. Lett., 2010, 497,208.10 N. S. Singh, R. S. Ningthoujam, S. D. Singh, B. Viswanadh, N. Manojand R. K. Vatsa, J. Lumin., 2010, 130, 2452.11 B. D. Cullity, Elements of X-ray Diffraction, Addision-Wesley, Reading,MA, USA, 1959.12 N. S. Gajbhiye and R. S. Ningthoujam, Mater. Res. Bull., 2006, 41,1612.13 B. D. Cullity, Elements of X-Ray Diffraction, Addison-Wesley, Massachusetts,1959 Broadening (bhkl) of peaks in XRD pattern comesfrom instrumental (binst), particle size (bD) and strain (bstrain), i.e.bhkl = binst + bD + bstrain. binst is removed by using an Si standard.bD is equal to l/(Dcosq) (where D is the crystallite size). bstrain comesfrom variation in lattice spacing (d hkl ) and is equal to e hkl tanq (wheree hkl is the strain developed in the lattice and equal to Dd/d). Thus b hkl =l/(Dcosq) +e hkl tanq.14 R. D. Shannon and C. T. Prewitt, Acta Crystallogr., Sect. B: Struct.Crystallogr. Cryst. Chem., 1969, 25, 925.15 K. Amezawa, Y. Tomii and N. Yamamoto, Solid State Ionics, 2005,176, 135.16 K. Amezawa, Y. Tomii and N. Yamamoto, Solid State Ionics, 2003,162–163, 175.17S.N.Achary,S.J.Patwe,M.D.MathewsandA.K.Tyagi,J. Phys.Chem. Solids, 2006, 67, 774.18 F. Lei and B. Yan, J. Solid State Chem., 2008, 181, 855.19 P. Yang, C. Li, W. Wang, Z. Quan, S. Gai and J. Lin, J. Solid StateChem., 2009, 182, 2510.20 Y. Yu-Ling, L. Xue-Ming, F. Wen-Lin, L. Wu-Lin and T. Chuan-Yi, J.Alloys Compd., 2010, 505, 239.21 Z. Hou, R. Chai, M. Zhang, C. Zhang, P. Chong, Z. Xu, G. Li and J.Lin, Langmuir, 2009, 25, 12340.22 C. E. Blom, H. G. Hedderich, F. J. Lovas and R. D. Suenram, J. Mol.Spectrosc., 1992, 152, 109.7594 | Dalton Trans., 2011, 40, 7590–7594 This journal is © The Royal Society of Chemistry 2011