AdCRC 2006-2007 bLACK bOOK - UCSB Division of Student Affairs ...
AdCRC 2006-2007 bLACK bOOK - UCSB Division of Student Affairs ...
AdCRC 2006-2007 bLACK bOOK - UCSB Division of Student Affairs ...

Create successful ePaper yourself
Turn your PDF publications into a flip-book with our unique Google optimized e-Paper software.
38<br />
the bLACk bOOk<br />
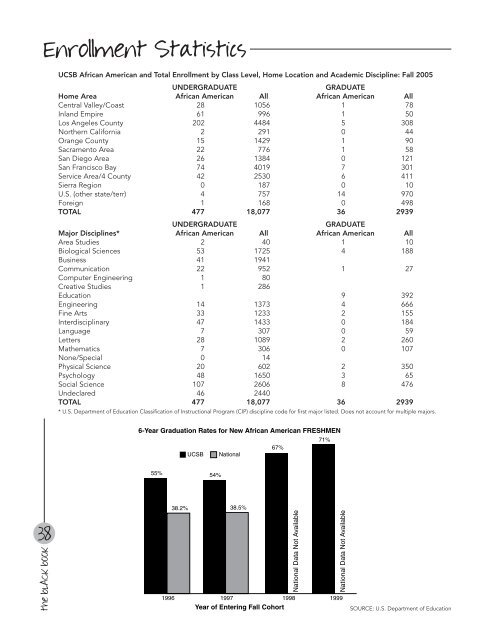
Enrollment Statistics<br />
<strong>UCSB</strong> African American and Total Enrollment by Class Level, Home Location and Academic Discipline: Fall 2005<br />
UNDERGRADUATE GRADUATE<br />
Home Area African American All African American All<br />
Central Valley/Coast 28 1056 1 78<br />
Inland Empire 61 996 1 50<br />
Los Angeles County 202 4484 5 308<br />
Northern California 2 291 0 44<br />
Orange County 15 1429 1 90<br />
Sacramento Area 22 776 1 58<br />
San Diego Area 26 1384 0 121<br />
San Francisco Bay 74 4019 7 301<br />
Service Area/4 County 42 2530 6 411<br />
Sierra Region 0 187 0 10<br />
U.S. (other state/terr) 4 757 14 970<br />
Foreign 1 168 0 498<br />
TOTAL 477 18,077 36 2939<br />
UNDERGRADUATE GRADUATE<br />
Major Disciplines* African American All African American All<br />
Area Studies 2 40 1 10<br />
Biological Sciences 53 1725 4 188<br />
Business 41 1941<br />
Communication 22 952 1 27<br />
Computer Engineering 1 80<br />
Creative Studies 1 286<br />
Education 9 392<br />
Engineering 14 1373 4 666<br />
Fine Arts 33 1233 2 155<br />
Interdisciplinary 47 1433 0 184<br />
Language 7 307 0 59<br />
Letters 28 1089 2 260<br />
Mathematics 7 306 0 107<br />
None/Special 0 14<br />
Physical Science 20 602 2 350<br />
Psychology 48 1650 3 65<br />
Social Science 107 2606 8 476<br />
Undeclared 46 2440<br />
TOTAL 477 18,077 36 2939<br />
* U.S. Department <strong>of</strong> Education Classification <strong>of</strong> Instructional Program (CIP) discipline code for first major listed. Does not account for multiple majors.<br />
6-Year Graduation Rates for New African American FRESHMEN<br />
<strong>UCSB</strong> National<br />
55% 54%<br />
38.2% 38.5%<br />
67%<br />
National Data Not Available<br />
71%<br />
1996 1997 1998 1999<br />
Year <strong>of</strong> Entering Fall Cohort<br />
National Data Not Available<br />
SOURCE: U.S. Department <strong>of</strong> Education