Harden, J.W., S.E. Trumbore, B.J. Stocks, A. Hirsh, S.T. Gower, K.P. ...
Harden, J.W., S.E. Trumbore, B.J. Stocks, A. Hirsh, S.T. Gower, K.P. ...
Harden, J.W., S.E. Trumbore, B.J. Stocks, A. Hirsh, S.T. Gower, K.P. ...
- No tags were found...

Create successful ePaper yourself
Turn your PDF publications into a flip-book with our unique Google optimized e-Paper software.
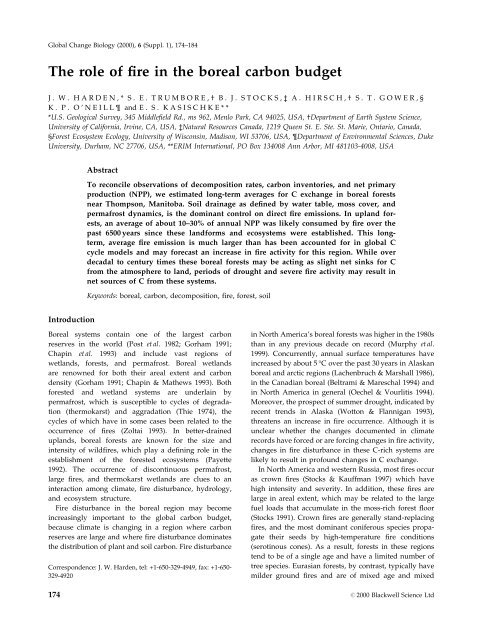
Global Change Biology (2000), 6 (Suppl. 1), 174±184The role of ®re in the boreal carbon budgetJ. W. HARDEN,* S. E. TRUMBORE,² B. J. STOCKS,³ A. HIRSCH,² S. T. GOWER,§K. P. O'NEILL andE. S. KASISCHKE***U.S. Geological Survey, 345 Middle®eld Rd., ms 962, Menlo Park, CA 94025, USA, ²Department of Earth System Science,University of California, Irvine, CA, USA, ³Natural Resources Canada, 1219 Queen St. E. Ste. St. Marie, Ontario, Canada,§Forest Ecosystem Ecology, University of Wisconsin, Madison, WI 53706, USA, Department of Environmental Sciences, DukeUniversity, Durham, NC 27706, USA, **ERIM International, PO Box 134008 Ann Arbor, MI 481103-4008, USAAbstractTo reconcile observations of decomposition rates, carbon inventories, and net primaryproduction (NPP), we estimated long-term averages for C exchange in boreal forestsnear Thompson, Manitoba. Soil drainage as de®ned by water table, moss cover, andpermafrost dynamics, is the dominant control on direct ®re emissions. In upland forests,an average of about 10±30% of annual NPP was likely consumed by ®re over thepast 6500 years since these landforms and ecosystems were established. This longterm,average ®re emission is much larger than has been accounted for in global Ccycle models and may forecast an increase in ®re activity for this region. While overdecadal to century times these boreal forests may be acting as slight net sinks for Cfrom the atmosphere to land, periods of drought and severe ®re activity may result innet sources of C from these systems.Keywords: boreal, carbon, decomposition, ®re, forest, soilIntroductionBoreal systems contain one of the largest carbonreserves in the world (Post et al. 1982; Gorham 1991;Chapin et al. 1993) and include vast regions ofwetlands, forests, and permafrost. Boreal wetlandsare renowned for both their areal extent and carbondensity (Gorham 1991; Chapin & Mathews 1993). Bothforested and wetland systems are underlain bypermafrost, which is susceptible to cycles of degradation(thermokarst) and aggradation (Thie 1974), thecycles of which have in some cases been related to theoccurrence of ®res (Zoltai 1993). In better-draineduplands, boreal forests are known for the size andintensity of wild®res, which play a de®ning role in theestablishment of the forested ecosystems (Payette1992). The occurrence of discontinuous permafrost,large ®res, and thermokarst wetlands are clues to aninteraction among climate, ®re disturbance, hydrology,and ecosystem structure.Fire disturbance in the boreal region may becomeincreasingly important to the global carbon budget,because climate is changing in a region where carbonreserves are large and where ®re disturbance dominatesthe distribution of plant and soil carbon. Fire disturbanceCorrespondence: J. W. <strong>Harden</strong>, tel: +1-650-329-4949, fax: +1-650-329-4920in North America's boreal forests was higher in the 1980sthan in any previous decade on record (Murphy et al.1999). Concurrently, annual surface temperatures haveincreased by about 5 °C over the past 30 years in Alaskanboreal and arctic regions (Lachenbruch & Marshall 1986),in the Canadian boreal (Beltrami & Mareschal 1994) andin North America in general (Oechel & Vourlitis 1994).Moreover, the prospect of summer drought, indicated byrecent trends in Alaska (Wotton & Flannigan 1993),threatens an increase in ®re occurrence. Although it isunclear whether the changes documented in climaterecords have forced or are forcing changes in ®re activity,changes in ®re disturbance in these C-rich systems arelikely to result in profound changes in C exchange.In North America and western Russia, most ®res occuras crown ®res (<strong>Stocks</strong> & Kauffman 1997) which havehigh intensity and severity. In addition, these ®res arelarge in areal extent, which may be related to the largefuel loads that accumulate in the moss-rich forest ¯oor(<strong>Stocks</strong> 1991). Crown ®res are generally stand-replacing®res, and the most dominant coniferous species propagatetheir seeds by high-temperature ®re conditions(serotinous cones). As a result, forests in these regionstend to be of a single age and have a limited number oftree species. Eurasian forests, by contrast, typically havemilder ground ®res and are of mixed age and mixed174 # 2000 Blackwell Science Ltd
F I R E I N T H E B O R E A L C A R B O N B U D G E T 175species. In all boreal regions, deciduous species such asbirch (Betula), poplar (Populus), willow (Salix) and alder(Alnus) occur, usually after ®re disturbance, in singlestands or in mixtures with coniferous species. In NorthAmerica, most pine species are found in well-drained,commonly sandy soils (Nalder & Wein, 1999). In themore poorly drained landscapes throughout the borealforests, black spruce dominates over pine and inmixtures with birch and aspen. In some regions, aspenmay be more likely than spruce to replace severe ®res(Dyrness et al. 1986), while black spruce is likely toreplace itself after milder ®res.Boreal forest ®res have only recently been consideredto be of potential importance to the global carbon cycle.Biomass burning in the tropics, largely stemming fromsavanna and forest conversions, are thought to greatlyoutweigh (by 10-fold) the emissions generated by borealforests (Crutzen & Andreae 1990). However, wild®res inboreal forests appear to show tremendous interannualvariation in both area burned and severity of burning;®re emissions may be greater than previously assumedor may be on the increase since the turn of the century.For example, in the 1980s in Canada, 10 times more landarea burned than in any previous decade on record(Murphy et al. 1999). Estimates of fuel consumption and®re severity also vary greatly (Kasischke et al. 1995b).Implications for dramatic shifts in ®re disturbance,whether interannual or interdecadal, involve not onlydirect C emissions but also shifts in stand-age andspecies composition for the region. Disturbance andregrowth patterns were found to have a large effect onseasonal amplitude of net carbon exchange in highlatitudes, an effect that was larger than interannual orgrowing-season temperatures, and that has contributedan increase of about 15% to high-latitude amplitudessince the 1960s (Zimov et al. 1999). As a result of the largevariations and uncertainties in ®re emissions and theirimportance to C exchange at high latitudes, we attemptto introduce a different approach to understanding thecontrols and constraints on C losses to ®re. Our methoduses modern estimates for production, decomposition,and storage of carbon, a model of ®re dynamicsdeveloped over millenial time-scales, and an assessmentof the long-term carbon balance for a variety of boreallandscapes in North America.Methods for a mass balance modelBecause soils represent the net accumulation of carbonover long time-periods, soils also contain informationabout the balance between plant production, decomposition,and ®re emissions. Boreal soils store large amountsof carbon (Chapin & Matthews 1993), which is evidencefor net C exchange onto land since the time of glacial iceretreat (<strong>Harden</strong> et al. 1992). Carbon studies typicallydescribe soils as net sink terms for modern C budgets(Apps et al. 1993). However, there is compelling evidencethat at least some of these systems are no longer largesinks for C onto land (Goulden et al. 1998) and that theyhave changed over time in their potential for net Cstorage (<strong>Harden</strong> et al. 1992). Soil drainage strongly affectsthe amount of carbon stored in soils (<strong>Harden</strong> et al. 1997;<strong>Trumbore</strong> & <strong>Harden</strong> 1997), and several workers (e.g.Gorham 1991) have attributed decreased decompositionin wetland peats as the reason for their large carbonstorage. However, ®re may also be an important factor inthe association of soil carbon and soil drainage class. It iscritically important today to understand: (i) whether ornot these systems have been taking up carbon for recentcenturies; (ii) whether these systems have undergone arecent change in net C exchange in response to recentwarming of the region; and (iii) how C exchange willrespond to future changes in regional climate and ®redisturbance. Based on the size and frequency of ®resand on the presence of permafrost in these regions,mechanisms that control carbon exchange are likely toinvolve ®re disturbance and regrowth as well ascarbon burial into deeper, colder soil environmentswhere carbon is protected from decomposition. To thisend, a model was developed that includes ®redisturbance, burial of C in cold soil layers, soildrainage, and plant regrowth simulated over millenialtimescales using a decadal time-step. Our mainpurpose was to understand the relative importanceof production, decomposition, and ®re in controlling Cstorage in well-drained to very poorly drainedsystems.As a ®rst principal, it is clear that C that is added to soilas plant residue must either decompose, accumulate, orburn.For the entire system:dC/dt = NPP ± C h ± F= NPP ± k s *C s ± k s *C c ± k d *C d ± f*(C s + C tr ) (1)where NPP is net primary production; C h is C lost toheterotrophic respiration (decomposition), and F iscarbon lost to ®re. C h is the sum of respiration fromshallow detritus (s), ®re-killed plant matter `char' (c), anddeep (d) soil layers expressed as C storage timesfractional decomposition coef®cient k for shallow (s)and deep (d). C tr is C stored in trees. Loss of C todissolved organic C and to herbivory are not included atthis time. As part of the Boreal Ecosystem AtmosphereStudy, we can estimate terms NPP, k, C but have nodirect estimates of ®re emissions. As a result, we treated fas an unknown and solved (1) to estimate C lost to ®re ineach soil drainage class (Table 1). This approach toestimating f is unprecedented in the literature, where# 2000 Blackwell Science Ltd, Global Change Biology, 6 (Suppl. 1), 174±184
176 J . W . H A R D E N et al.determination of f has been based on measurements ofarea burned, ®re frequency, and fuel consumptionestimated from control vs. burn comparisons. Thepresent approach also differs from other estimates of fbecause soil carbon represents a long-term balance(decadal, century, and millennial) of the carbon budget,whereas other methods rely on the more recent (annualto decadal) past.Emphasizing the ®re cycle and the mechanism ofburial by regrowing moss, the present model partitionssoil into a shallow (C s ) layer that accumulates between®res and a deep (C d ) layer that is buried by regrowing C s(Fig. 1). C s consists of roots, plant litter, and moss thatdecomposes at a ®rst order rate constant k s and typicallyhas C/N ratios of 40±60, bulk densities 0.05 g cm ±3 or less,and carbon contents of about 50%. Deep carbon C dconsists of roots, dead wood and `char' and humus thatdecomposes at a ®rst-order rate constant k d with C/Nratios of 10±20, bulk densities around 0.1 g cm ±3 , andcarbon contents of about 20% (Fig. 2). The coef®cient k d isgenerally about 103 slower than k s (Table 1) as a result ofC d being older (radiocarbon dated) and more decomposedand of burial into colder conditions (Goulden et al.1998). Upon burning, a proportion (f) of C s and C st (treestems) burns at a prescribed, average ®re return time.After ®re, the remains that include dead wood (Fig. 1)decompose at a rate of k s in the shallow compartment forone burn cycle before input into the deep soil (Input deepin Table 1) where it decomposes at a rate k d . By subjectingthe ®re-killed wood and `char' to decomposition at a ratek s for an entire burn cycle, decomposition is maximizedbefore the material enters the deep layer. Other scenarios,including a 50-y period before burial into deep or animmediate transfer into deep, result in much higherinputs to deep layers and infer even higher C losses to®re in order to balance the deep C storage.As part of the Boreal Ecosystem Atmosphere Study innorthern Manitoba, we used soil carbon and mossinventories (<strong>Harden</strong> et al. 1997), soil gas-exchange chambers(<strong>Trumbore</strong> & <strong>Harden</strong> 1997), and measurements ofradiocarbon in soil and deep sediment (<strong>Trumbore</strong> &<strong>Harden</strong> 1997 for uplands; <strong>Trumbore</strong> et al. 1999 forwetlands) to determine the rate at which soil componentsdecompose or accumulate as fuel between ®res. Deadmoss (<strong>Harden</strong> et al. 1997) and phytomass inventories(<strong>Gower</strong> et al. 1997) and growth increments of live trees(<strong>Gower</strong> et al. 1997) were used to determine Net PrimaryProduction of moss and trees. Carbon inventories of ®rekilledtrees (<strong>Harden</strong> et al. 1997) were used to determine aminimum of how much fuel is left after burning (treestems don't burn) and tree-ring analysis of ®re recurrence(Stock s 1989, 1980, 1991) were used to determinethe average return time for intensive, stand-killing ®res.Model input terms such as decomposition coef®cients(Table 1) have large uncertainties; in model runs, NPPand k s were allowed to vary within the range ofobservations as long as the value of C s was satis®edwithin its range of observation. To solve for C d after6500 years, the term f (fraction of shallow C burned) wasallowed to vary as a model unknown.The model was run separately for each drainage/ecosystem type and can be visualized as though eachecosystem were re-established repeatedly at the samesite. The char component was allowed to decomposeat the rate of the shallow layer (k s ) for a period of1 burn cycle following each ®re; then the char wasdecomposed at the rate of the deep layer (k d ). This likelyoverestimated decomposition of the charred materialbecause burial by moss is suf®ciently widespread anddeep by about 50 years after ®re (<strong>Harden</strong> et al. 1997).Also, NPP was modelled to recover within 10 years of the®re event, although areal spread of moss likely takeslonger (<strong>Harden</strong> et al. 1997); this oversimpli®cation likelyoverestimates NPP by about 10±25%. We did not attemptto simulate the effects of succession, variations inweather that might affect NPP or decomposition, variationsin ®re severity, nor accelerated decompositionfollowing ®re; however, some of these effects counteracteach other and should be examined separately for neteffects on the C budget. Model output, including totalsfor C gains (by NPP), losses (to C h and f), and netexchange (NEP) were summed over the entire modelperiod (Tables 1, 2) and represent long-term averages forthese systems.As a sensitivity test and as a method to ®nd a `bestestimate' for model results, several model scenarios wererun for the 6500 years since deglaciation. The variationsin decomposition rate k s and NPP of moss and litter wereconstrained by C s and therefore did not signi®cantlyaffect C stored in the deep soil. However, model resultswere highly sensitive to the rate at which charredremains decomposed (k char , eqn 1) before entering thedeep soil (Fig. 3). Typically, the upper estimate of ®reemissions is constrained by lower limits to decompositionrates: not more than about 14% of NPP forsphagnum and 40% for spruce and pine could be lostas ®re emissions. However, the lower limit for ®reemissions is more problematic because the mechanismsof decomposition and burial of charred material is sopoorly known: if charred material decomposes at upperranges of shallow decomposition rates then very little Closs (< 1% of NPP) is required to balance the soil Cbudget. Our best estimates for ®re losses are derivedfrom model runs in which means were used for inputterms of (most critically) k s and k d . We also used anoptimization procedure in Microsoft Excelq to minimizethe differences between model results and data for C s ,C d , k s , k d in determining the best estimates for ®re# 2000 Blackwell Science Ltd, Global Change Biology, 6 (Suppl. 1), 174±184
F I R E I N T H E B O R E A L C A R B O N B U D G E T 177Table 1. Model inputs and constraints for determining longterm C losses to ®re and decomposition. Terms de®ned in text (Eq. 1).Model inputs and constraints Model unknowns Model outputNPP 1 1/k shallow 2 1/k deep 2 Cs mature 3 Cd today 3 C mature Cc (dead) 5 Input deep 3 %Fuel burned Fire %NPP to ®re(kgC m ±2 y ±1 ) (y) (y) (kgC m ±2 ) (kgC m ±2 ) trees 1 (kgC m ±2 ) (kgC m ±2 y ±1 ) emission 6(kgC m ±2 )at t = eventkg C m ±2event ±1Pine/lichen: burn interval 60 yModel 0.15 13 100 1.1 1.18 4 3 0.009 41% 2 25% (range 1±26%)Observed data 0.1±0.15 6±14 100 1.1 1.8 2±4 > 2±3 0.01 1.1±2.5Spruce/Feathermoss: ®re interval 80 yModel 0.15 55 550 3.3 9 3.6 3.87 0.04 44% 3 33% (range 18±44%)Observed data 0.096±0.17 55±250 200±500 2±4 9±11 2.9±5.7 > 1.2±4.7 0.002±0.005 1.4±7Spruce/Sphagnum: ®re interval 200 yModel 0.12 56 1100 4.3 18 2.9 5.03 0.012 30% 2 12% (range 1±26%)Observed data 0.12±0.16 55±250 1000±2000 2±4 18±22 2.5 > 1±3 0.007±0.033 ±Wetland bryophytes, sedges: ®re interval 200 yModel 0.3 37 0.0003 5.26 70 0 5.3 0.0495 0.05
178 J . W . H A R D E N et al.Fig. 1 A model of soil carbon storage showing C loss to ®re events, C burial by mosses during regrowth, and protection from decompositionin deep layers. In a pre-®re condition, the C transfers of the forest represent inputs from NPP and losses to decomposition.When ®re occurs, carbon that is not lost to direct ®re emissions is transferred from the shallow soil and tree layer to an intermediatelayer C c that decomposes at the surface until burial by moss allows the material to decompose at slower rates of the deep layer.Data in Table 1 are used to de®ne terms including t, time t in years; NPP, net primary production in kg m ±2 y ±1 ; k s , k d , decompositioncoef®cients in units of kgC m ±2 y ±1 ; t ± 1, year previous to time t; C s carbon storage (in units of kgC m ±2 ) in shallow soil and trees, includingmoss, roots, plant litter, trees; C d , carbon storage (kgC m ±2 ) in deep soil layers; C c , C storage (kgC m ±2 ) in ®re-killed treesand remains of burning; C tr , carbon storage (kgC m ±2 ) in tree stem; F, fractional percentage loss to ®re; C h , heterotrophic respirationin kgC m ±2 in one year. Equations for calculations between ®re events are C s + C tr at time t = C tr (t ± 1) + ANPP stem + C s (t ± 1) + NPPs ±k s *C s (t ± 1) for shallow carbon and tree layer; C d at t = C d (t ± 1)±k d C d (t ± 1) for deep carbon layer; C h = k s *C s (t ± 1) + k d *C d (t ± 1) +k s *C c (t ± 1) for heterotrophic respiration in one model year; C c at time t = C c (t ± 1) ± k s *C c (t ± 1) for ®re-killed remains. For years inwhich ®re occurs, equations are C s at time of ®re = 0; C d at t of ®re = C d (t ± 1) + C c (t ± 1) for carbon storage of deep carbon; F (®re) =f * (C s ) for C consumed by ®re and released as CO 2 and other C trace gases; C h = k d *C d (t ± 1) + k s *C c (t ± 1) for decomposition or heterotropicrespiration; C c = (1 ± f)*(C s + C tr ) for carbon storage of ®re-killed remains.emissions (Table 1, output). The modelled best estimatesfor direct ®re emissions per event are comparable to dataon experimental burns in pine and spruce forests (<strong>Stocks</strong>1980, 1989).ResultsThere is a zig-zag pattern of carbon storage in both theshallow and deep soil layers (Figs 1, 3) that is caused by# 2000 Blackwell Science Ltd, Global Change Biology, 6 (Suppl. 1), 174±184
F I R E I N T H E B O R E A L C A R B O N B U D G E T 179Fig. 2 Evidence for ®re: Residues ofdecomposed and burned plant debris areconcentrated in deep organic layers.Initial forms of `black carbon' may existin these layers, but more labile, easilydecomposed material also exists,suggesting that these deep layers areprotected from decomposition by burialand cold temperatures. C density = %C/1003 bulk density.the shallow layer burning and the deep layer receivingthe ®re-killed, partially decomposed remains. Welldrainedsandy sites, which are generally warmer at thesoil surface, have rapid rates of decomposition that limitthe storage of fuel and thereby limit the inputs to thedeep soil layers (Table 1 ± note the small deep inputs;Fig. 4). Poorly drained upland sites, which have higher Cstorage in moss layers (owing to greater moss NPP butlower tree NPP; see <strong>Gower</strong> et al. 1997; <strong>Harden</strong> et al. 1997),have plenty of fuel for combustion (Table 1, see C s atmaturity) but deep C storage varies two-fold accordingto the severity of burning (Fig. 4).The importance of ®re emissions as a mechanism of Closs is best seen in a comparison of all four drainagesystems (Fig. 4), where estimates of NPP and decompositionare relatively similar, but carbon storage variesby 103 as a result of ®re emissions. Better drainedecosystems generally have greater C losses to ®re thanwetter ecosystems (Fig. 5) but the maximum ®re emissionsare derived from intermediate soils with blackspruce stands. These patterns are re¯ected in modelresults; for example, because decomposition is so fast inthe pine sites, they store small amounts of shallow C (C s ),and therefore the burn emissions are lower than forspruce sites (Table 1). Pine sites, although productive,put more of their NPP into tree stems (which do notburn) than into ®ne fuels such as moss and litter. As aresult, both high decomposition rates and the allocationof C into coarse stems accounts for a slightly lower ®reemission in pine than spruce. On the other end of thespectrum, wetland sites also do not burn as much asspruce stands, but it is the deep, wet conditions that offerprotection from ®re. As a result, the ratios of ®reemissions to total emissions (F/(C h + F) along thedrainage gradient are 0.27, 0.43, 0.26, and 0.08 for driestto wettest sites (Fig. 4). In uplands of our study area, 10±30% of the annual CO 2 that is ®xed as NPP has beenreleased in the form of ®re emissions, while about40±80% of NPP has been released to decomposition and8±30% ®xed as soil carbon (Table 1).Following a ®re, exposure of charred and deadmaterial at the surface leads to a high decompositionef¯ux during the warm season. A change in the surfaceenergy balance is evident from a thickening of the activelayer (Viereck 1983; O'Neill et al. 1997). In the laboratory,charred material appeared to be a mixture of more stablecarbon, that resisted digestion by strong acid and base(method of Gillespie et al. 1992; data not shown), andmore labile carbon, that at room temperature decomposedat rates similar to shallow, preburn material(Goulden et al. 1998; see footnote 23). On ®re-scars ofvarious ages, O'Neill and colleagues found net losses of# 2000 Blackwell Science Ltd, Global Change Biology, 6 (Suppl. 1), 174±184
180 J . W . H A R D E N et al.Table 2. Boreal ecosystem classes and long-term carbon mass balance terms (does not include forest-tundra).Area %of boreal Area 2 Range of NPP 1 Boreal NPP 3 Annual ®re emission 4 Annual decomposition 4 NEP (NPP-F-Ch) 6Drainage class Vegetation 1 forest (m 2 ) (kg C m ±2 y ±1 ) (range in gC y ±1 ) (range in gC y ±1 ) (range in gC y ±1 ) (range in gC y ±1 )Well-drained Jack Pine/lichen 26% 3.80E+12 0.18 to 0.26 6.8E+14 to 9.9E+14 1.7E+14 to 2.5E+14 5.1E+14 to 7.4E+14 0.0E+01 to 0.0E+01Mixed drainage Deciduous 5 40% 5.90E+12 0.22 to 0.43 1.3E+15 to 2.5E+15 4.3E+14 to 8.4E+14 8.6E+14 to 1.7E+15 1.3E+13 to 2.5E+13Poorly drained B. Spruce/Sphagnum 13% 1.90E+12 0.18 to 0.43 3.4E+14 to 8.2E+14 4.1E+13 to 9.8E+13 2.9E+14 to 6.9E+14 1.0E+13 to 2.5E+13Moderately drained B. Spruce/Feathermoss 13% 1.90E+12 0.18 to 0.43 3.4E+14 to 8.2E+14 1.1E+14 to 2.7E+14 1.9E+14 to 4.7E+14 3.4E+13 to 8.2E+13Very poorly drained Wetland mosses, sedge 8% 1.10E+12 0.15 to 0.38 1.7E+14 to 4.2E+14 3.3E+12 to 8.4E+12 1.6E+14 to 3.8E+14 0.0E+01 to 3.4E+131.00E+00 1.46E+13 2.5E+15 to 4.8E+15 6.4E+14 to 1.2E+15 1.8E+15 to 3.5E+15 2.3E+13 to 8.4E+13Data sources:1 Trees and moss from synthesis by <strong>Gower</strong> et al. (1997) for pine, broadleaf, and spruce forests around the world. See also Randerson et al. (1997) with 0.3 to 0.5 range. See<strong>Trumbore</strong> et al. (1999) for wetlands. The NPP in Manitoba sites used in model are low end of the range.2 Most global inventories of boreal phytomass lump pine and spruce into evergreen needleleaf (Chapin & Matthews 1993). For Canada, the ratio of well-drained Spodosols topoorly drained peats and Inceptisols (from <strong>Harden</strong> et al. 1992) is 60% Spodosols, 40% other; whereas forests are 36% pine to 64% spruce (For. Canada, written commun.). We used50% for global pine/spruce breakdown for all boreal forests.Within Spruce forests, we also used 50% mixture for poorly drained black spruce (BS)/sphagnum and moderately drained BS/feathermoss.3 Multiplying NPP range by area; compares with 2.9 PgC y±1 (Whittenburg et al. 1997, 1998) and 5.2 PgC y±1 (Randerson et al. 1997).4 Best-estimate value from Table 1 of %NPP burned and %NPP decomposed is multiplied by NPP range. Compare totals with 0.3 PgC y±1 of Kasischke et al. (2000b).5 Very few data for broadleaf exist; we used NPP, C, and litter turnover of aspen from <strong>Gower</strong> et al. (1997) and soil data of H.Velduis, Agriculture Canada (written comm.).6 Although a net C sink has been postulated for boreal systems (Gorham 1991; <strong>Harden</strong> et al. 1992) measurement and model based estimates range enormously from sources tosinks (Goulden et al. 1998).# 2000 Blackwell Science Ltd, Global Change Biology, 6 (Suppl. 1), 174±184
F I R E I N T H E B O R E A L C A R B O N B U D G E T 181Fig. 3 The sensitivity of burn emissions to decomposition rateof charred remains (k char ) required to balance the C budget fordeep soil. Using a decomposition rate for deep soil ofk d = 0.0005 (turnover time of 2000 years; shown as lower linewith circles) to 0.0009 (1111 years; upper line with boxes) forblack spruce/feathermoss site, model results require a combinationof faster turnover time for charred material or higherburn emission to balance the C stored in deep soil. Shown ashorizontal lines, decomposition rates for char may lie somewherebetween ranges measured for k d and k s (Table 1).carbon as a result of increased heterotrophic respiration(O'Neill et al. 1997) and absence of vegetative cover. Asthe site recovers with new vegetation, dead and charredmaterial is protected by burial into deeper, colder layers(Goulden et al. 1998), and decomposition is offset by netprimary production. Based on the work of Rapalee et al.(1998), ®re scars are net C sources for about 30 years afterburning, after which time the systems become net sinksfor C. The loss of the insulating organic layers probablyalso has an effect on winter ¯uxes in which soils wouldbe colder to greater depths and may remain frozen for alonger period. However, the thickening of the activelayer after ®re suggests an overall warming. Althoughour model does not explicitly include a post-®rewarming or winter cooling, nor a slow transition duringregrowth, a sensitivity test suggested that a two-foldincrease in decomposition sustained for 20 years resultedin an underestimate of decomposition comparable toabout 3%NPP. This estimate, however, may change asdifferent model scenarios include changes in ®re returninterval and shifts in the C h and F terms.For a regional and global perspective on carbonexchange, carbon storage and decomposition may beextrapolated best by soil drainage class in associationwith ecosystem structure. For each drainage and ecosystemclass, we assigned relationships of C h , F, and NPP toareas of the globe based on the distribution of soildrainage and ecosystem class. Because the discontinuouspermafrost that underlies our study may disproportionatelyaffect ratios of F/(C h + F) relative to regionsFig. 4 A model of deep soil carbon storage (C d ) for wetland fensystems that burn very lightly, poorly drained spruce systemsthat burn severely, and well drained pine systems that decomposeand burn severely. The zig-zag pattern represents inputof dead and burned material from shallow to deep layers andsubsequent decline by decomposition between ®res. For a sitematuring after a burn, local Net Ecosystem Production (NEP)is represented by C accumulation in deep soil layers.Extrapolating NEP from local site measurements to a regionalscale or long-term average must include ®re emission lossesthat account for the major differences in carbon storage in fen,spruce and pine systems.lacking permafrost, the F/(C h + F) relationship may nothold true for the boreal forest in the absence ofpermafrost. Based on our areal extrapolations in thepresence of permafrost, however (Table 2), global boreal®re emissions could have been about 0.5±1 Pg C y ±1 overthe past century or millennia. This overlaps at least thelow end of some recent boreal ®re studies (Kasischkeet al. 1995a; Conard & Ivanova 1998) but is at least threetimes larger than extrapolations from some directemission estimates (Cahoon et al. 1994) and 3±10 timeslarger than estimates used in general circulation models(Houghton 1991; Randerson et al. 1997; Wittenburg et al.1998; see discussion below). While our estimates arehighly uncertain, they do emphasize the importance of®re emissions in closing the C budget over century-tomillenialtimescales, and they emphasize the linksbetween NPP, decomposition and ®re.DiscussionIf the distribution of stand age were to change through®re suppression or through changes in climate, then therelationships of NPP, k, C, and F would change and# 2000 Blackwell Science Ltd, Global Change Biology, 6 (Suppl. 1), 174±184
182 J . W . H A R D E N et al.Fig. 5 Carbon losses to ®re and decompositionwere calculated from model resultsdescribed in text. Long-term sums forNPP, C h for shallow (k s C s ), C h for deep(k d C d ) and C h for dead (k s C c ), and ®reemission F were divided by years of simulationfor annual uptake and lossrates of C exchange. Each drainage classwas modelled separately for runs where®re emissions were minimized (all C hvalues generally maximized within dataconstraints of Table 1) and maximized(C h minimized) to show range of possible®re emissions. Best estimates for F andC h are not shown here but are summarizedin Tables 1 and 2.result in a shift in F/(C h + F) and in NEP. Looking backthrough the past century, some investigators have notedvariations in ®re occurrence that coincided with variationsin ®re-season climate, but regional results vary.Compared to ad1850, burn areas and ®re occurrencewere notably low in tree-ring records in Quebec from1870 to 1988 (Payette et al. 1989; Bergeron & Archambault1993) and in charcoal deposition of Minnesota in the 19thCentury (Clark 1988). By contrast, ®res in the rest ofCanada after the 1980s have been more extensive than inprevious decades (Murphy et al. 1999). These variationsin climate and in ®re disturbance likely resulted in shiftsof F/(C h + F) and therefore in shifts of how fast and inwhat forms C was lost from the systems. More discreetstand-age information is needed before we can understandhow such shifts may relate to NEP or how shifts inclimate will affect F/(C h + F) and NEP.The reasons for the discrepancy between our estimatesof the long-term average carbon emissions and directestimates of C emissions are unclear but potentiallyimportant. First, estimates derived from observationsbefore the 1980s (Murphy et al. 1999) may be biasedtoward a lower ®re activity of the last century, assuggested by Bergeron & Archambault (1993). In thiscase, our long-term estimates suggest that we areentering a period of ®re activity that is atypical of thepast century but more typical for the boreal forest.Secondly, the technology for estimating emissions hasadvanced to increase the area burned by two-fold overthe past 5 years (Cahoon et al. 1994; Conard & Ivanova1998). Fire severity estimates have increased steadilyalso, as studies include a wider variety of stands (such asblack spruce with more moss and ground fuels) and amore careful accounting of ground fuels in general(<strong>Stocks</strong> 1989; Kasischke et al. 2000a). Whether ®re activityis actually on the rise or is being more carefullyaccounted, CO 2 emissions from boreal ®res are likely tobe much greater than have been assumed (e.g. compareSeiler & Crutzen 1980 with Cahoon et al. 1994 and Frenchet al. 2000). In addition, ®re emissions may increase in thefuture, particularly if summer droughts are sustained inthese regions leading to more episodic ®re events.Interactions between ®re disturbance and the activelayer above permafrost have demonstrated the importanceof insulating moss and soil layers in maintaining afrozen soil near the ground surface (Viereck 1983). Inthese regions species composition is highly dependent onsoil drainage (Rapalee et al. 1998), and NEP and decompositionare sensitive to soil drainage class (<strong>Trumbore</strong> &<strong>Harden</strong> 1997); thus it would follow that changes in ®rereturn intervals could potentially invoke changes inforest structure and carbon exchange. As ®re is episodicand sudden in the boreal forest, relative to gradualchanges in temperature and decomposition, the mechanismby which carbon may respond to regional climatechange is inherently different from other ecosystemswhere ®re is managed or of smaller scale. Furthermore,changes in permafrost regions can be irreversible whenshallow and deep freeze layers become separated(formation of talik and massive soil drainage).Depending on the balance between colder, deeper winterfreezes and warmer, deeper summer thaws in areaswhere organic mats were burned, a change to morefrequent ®res may prevent insulating layers from# 2000 Blackwell Science Ltd, Global Change Biology, 6 (Suppl. 1), 174±184
F I R E I N T H E B O R E A L C A R B O N B U D G E T 183recovering and therefore might favour the degradation ofpermafrost (Landhausser & Wein 1993; Kasischke et al.2000b).AcknowledgementsMany thanks go to Dave McGuire, Jim Randerson, TerryChapin, and Kristen Manies for very helpful comments.ReferencesApps MJ, Kurz WA, Price DT (1993) Estimating carbon budgetsof Canadian forest ecosystems using a national scale model.In: Carbon Cycling in Boreal Forests and Sub-Arctic Ecosystems(eds Vinson TS, Kolchugina TP), pp. 243±252. U.S.Department of Commerce, Spring®eld, VA.Beltrami H, Mareschal J-C (1994) Ground temperature changesin eastern Canada: borehole temperature evidence comparedwith proxy data. Terra Nova, 5, 21±28.Bergeron Y, Archambault S (1993) Decreasing frequency offorest ®res in the southern boreal zone of Quebec and itsrelation to global warming since the end of the `Little Ice Age'.The Holocene, 6, 255±259.Cahoon DR Jr, <strong>Stocks</strong> BH, Levine BJ, Cofer WR, Pierson JM(1994) Satellite analysis of the severe 1987 forest ®res innorthern China and southeastern Siberia. Journal of GeophysicalResearch, 97, 3805±2814.Chapin FS III, Mathews E (1993) Boreal carbon pools:approaches and constraints in global extrapolations. In:Carbon Cycling in Boreal Forests and Sub-Arctic Ecosystems(eds Vinson TS, Kolchugina TP), pp. 9±20, U.S. Dept.Commerce, National Technical Information Service,Washington, DC.Clark JS (1988) Drought cycles, the `little ice age', and fuels: a750-yr record of ®re in northwestern Minnesota. Nature, 334,233±235.Conard SG, Ivanova GA (1998) Wild®re in Russian boreal forests± potential impacts of ®re regime characteristics on emissionsand global carbon balance estimates. Environmental Pollution,98, 305±313.Crutzen PJ, Andreae MO (1990) Biomass buring in the tropics:impact on atmospheric chemistry and biogeochemical cycles.Science, 250, 1669±1678.Dyrness CT, Viereck LA, Van Cleve K (1986) Fire in taigacommunities of interior Alaska. In: Forest Ecosystems in theAlaskan Taiga: a Synthesis of Structure and Function EcologicalStudies 57 (eds Van Cleve K et al.), pp. 74±88. Springer, NewYork.French NHF, Kasischke ES, Lee BS, <strong>Stocks</strong> BJ, Mudd JP (2000)Carbon released during ®res in North American boreal forestsduring the 1980s. In: Fire, Climate Change and Carbon Cycling inNorth American Boreal Forests (eds Kasischke ES, <strong>Stocks</strong> BJ),Ecological Studies Series, pp. 377±388. Springer, New York.Gillespie R, Hammond AP, Goh KM et al. (1992) AMS dating of alate Quaternary Tephra at Graham Terrace, New Zealand.Radiocarbon, 34, 21±27.Gorham E (1991) Northern Peatlands: Role in the Carbon Cycleand Probable Responses to Climatic Warming. EcologicalApplications, 1, 182±195.Goulden ML, Wofsy SC, <strong>Harden</strong> JW (1998) Sensitivity of borealforest carbon balance to soil thaw. Science, 279, 214±217.<strong>Gower</strong> ST, Vogel JG, Norman JM, Kucharik CJ, Steele SJ, StowTK (1997) Carbon distribution and aboveground net primaryproduction in aspen, jack pine, and black spruce stands inSaskatchewan and Manitoba. Canadian Journal of GeophysicalResearch, 102, 29,029±29,042.<strong>Harden</strong> JW, Sundquist ET, Stallard RF, Mark RK (1992)Dynamics of soil carbon during the deglaciation of theLaurentide Ice Sheet. Science, 258, 1921±1924.<strong>Harden</strong> JW, O'Neill KP, <strong>Trumbore</strong> SE, Veldhuis H, <strong>Stocks</strong> BJ(1997) Moss and soil contributions to the annual net carbon¯ux of a maturing boreal forest. Journal of Geophysical Research,102, 28,805±28,816.Houghton RA (1991) Biomass burning from the perspective ofthe global carbon cycle. In: Global Biomass Burning (ed. LevineJN), pp. 321±325. MIT Press, Cambridge, MA.Kasischke ES, Christensen NL, <strong>Stocks</strong> BJ (1995a) Fire, globalwarming, and the carbon balance of boreal forests. EcologicalApplications, 5, 437±451.Kasischke ES, French NHF, Bourgeau-Chavez LL, ChristensenNL (1995b) Estimating release of carbon from 1990 and 1991forest ®res in Alaska. Journal of Geophysical Reseach, 100,2941±2951.Kasischke ES, O'Neill KP, French NHF, Bergeau-Chavez LL(2000a) Controls on patterns of biomass burning in Alaskanboreal forests, in ®re, climate change and carbon cycling. In:Fire, Climate Change and Carbon Cycling in the Boreal Forest (edsKasischke ES, <strong>Stocks</strong> BJ), Ecological Studies Series, pp.173±196. Springer, New York.Kasischke ES, O'Neill KP, French NHF, Richter DD, Bourgeau-Chavez LL, Harrell PH (2000b) In¯uence of ®re on long-termpatterns of forest succession in Alaskan boreal forests. In: Fire,Climate Change and Carbon Cycling in the Boreal Forest (edsKasischke ES, <strong>Stocks</strong> BJ), Ecological Studies Series, pp.214±238. Springer, New York.Lachenbruch AH, Marshall BV (1986) Changing climate.Geothermal evidence from permafrost in the Alaskan Arctic.Science, 234, 689±696.Landhausser SM, Wein RW (1993) Post®re vegetation recoveryand tree establishment at the Arctic treeline: climate-changevegetationresponse hypotheses. Journal of Ecology, 81,665±672.Murphy PJ, <strong>Stocks</strong> BJ, Kasischke ES et al. (1999) Historical ®rerecords in the North American boreal forest. In: Fire, ClimateChange and Carbon Cycling in the Boreal Forest (eds KasischkeES, <strong>Stocks</strong> BJ), Ecological Studies Series, pp. 274±288.Springer, New York.Nalder IA, Wein RW (1999) Long-term forest ¯oor carbondynamics after ®re in upland boreal forests of westernCanada. Global Biogeochemical Cycles, 13, 951±968.Oechel WC, Vourlitis GL (1994) The effects of climate change onland-atmosphere feedbacks in arctic tundra regions. Trends inEcology and Evolution, 9, 324±329.O'Neill KP, Kasischke ES, Richter DD (1997) The effect of ®re onbiogenic carbon emissions from soils of interior Alaska. EOS,Transactions of the American Geophysial Union, 77, 46.Payette S (1992) Fire as a controlling process in the NorthAmerican boreal forest. In: Systems Analysis of the Global BorealForest (eds Shugart HH, Leemans R, Bonan GB), pp. 73±85.Cambridge University Press, New York.# 2000 Blackwell Science Ltd, Global Change Biology, 6 (Suppl. 1), 174±184
184 J . W . H A R D E N et al.Payette S, Morneau C, Sirois L, Desponts M (1989) Recent®re history of the northern Quebec biomes. Ecology, 70,657±673.Post WM, Emanuel WR, Zinke PJ, Stangenberger AG (1982)Carbon pools and world life zones. Nature, 298, 156±159.Randerson JT, Thompson MV, Conway TJ, Fung IY, Field CB(1997) The contribution of terrestrial sources and sinks totrends in the seasonal cycle of atmospheric carbon dioxide.Global Biogeochemistry and Cycles, 11, 535±560.Rapalee G, <strong>Trumbore</strong> SE, Davidson EA, <strong>Harden</strong> JW, Veldhuis H(1998) Estimating soil carbon stocks and ¯uxes in aboreal forest landscape. Global Biogeochemical Cycles, 12,687±701.Seiler W, Crutzen PJ (1980) Estimates of gross and net ¯uxes ofcarbon between the biosphere and atmosphere from biomassburning. Climatic Change, 2, 207±247.<strong>Stocks</strong> BJ (1980) Black spruce crown fuel weights in Ontario.Canada Canadian Journal of Forest Research, 10, 498±501.<strong>Stocks</strong> BJ (1989) Fire behavior in mature jack pine. Journal ofForest Ecology, 19, 783±799.<strong>Stocks</strong> BJ (1991) The extent and impact of forest ®res in northerncircumpolar countries. In: Global Biomass Burning (ed. LevineJ), pp. 197±203. MIT Press, Cambridge, MA.<strong>Stocks</strong> BJ, Kauffman JB (1997) Biomass consumption andbehavior of woodland ®res in boreal, temperate, and tropicalecosystems: parameters necessary to interpret historic ®reregimes and future ®re scenarios. In: Sediment Records ofBiomass Burning and Global Change (eds Clark JS et al.), NATOASI Series 51. Springer, Berlin.Thie J (1974) Distribution and thawing of permafrost in thesouthern part of the discontinuous permafrost zone inManitoba. Arctic, 27, 189±200.<strong>Trumbore</strong> SE, <strong>Harden</strong> JW (1997) Accumulation and turnover ofcarbon in organic and mineral soils of the BOREAS northernstudy area. Journal of Geophysical Research, 102, 28,816±28,830.<strong>Trumbore</strong> SE, Bubier J, <strong>Harden</strong> JW, Crill P (1999) Carbon cyclingin boreal wetlands: a comparison of three approaches. Journalof Geophysical Research, 104, 27,673±27,682.Viereck LA (1983) The effects of ®re in black spruce ecosystemsof Alaska and northern Canada. In: The Role of Fire in NorthernCircumpolar Ecosystems (Scope 18) (eds Wein RW, MacLeanDA), pp. 132±145. John Wiley, Chichester.Wittenburg U, Heimann M, Esser G, McGuire DA, Sauf W (1998)On the in¯uence of burning on the seasonal CO 2 signal asobserved at monitoring stations. Global Biogeochemical Cycles,12, 531±544.Wotton BM, Flannigan MD (1993) Length of the ®re season in achanging climate. The Forestry Chronicle, 69, 187±192.Zimov SA, Davidov SP, Zimova GM et al. (1999) Contribution ofdisturbance to increasing seasonal amplitude of atmosphericCO 2 . Science, 284, 1973±1976.Zoltai SC (1993) Cyclic development of permafrost in thepeatlands of northwestern Alberta. Canadian Arctic andAlpine Research, 25, 240±246.# 2000 Blackwell Science Ltd, Global Change Biology, 6 (Suppl. 1), 174±184