Basic Math Skills Assessment Test for Statistics The following ...
Basic Math Skills Assessment Test for Statistics The following ...
Basic Math Skills Assessment Test for Statistics The following ...
- No tags were found...

Create successful ePaper yourself
Turn your PDF publications into a flip-book with our unique Google optimized e-Paper software.
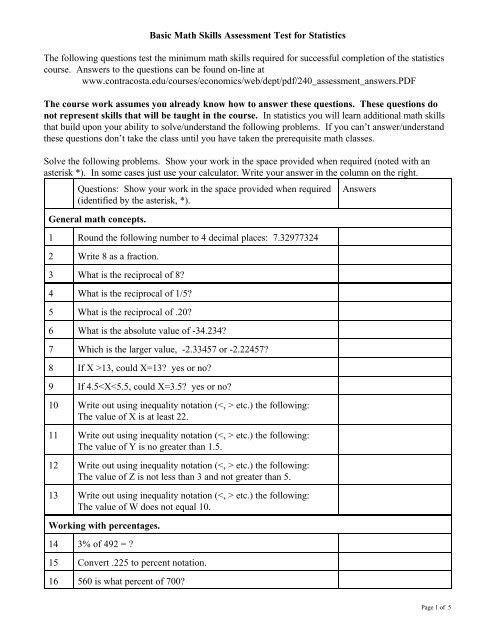
<strong>Basic</strong> <strong>Math</strong> <strong>Skills</strong> <strong>Assessment</strong> <strong>Test</strong> <strong>for</strong> <strong>Statistics</strong><strong>The</strong> <strong>following</strong> questions test the minimum math skills required <strong>for</strong> successful completion of the statisticscourse. Answers to the questions can be found on-line atwww.contracosta.edu/courses/economics/web/dept/pdf/240_assessment_answers.PDF<strong>The</strong> course work assumes you already know how to answer these questions. <strong>The</strong>se questions donot represent skills that will be taught in the course. In statistics you will learn additional math skillsthat build upon your ability to solve/understand the <strong>following</strong> problems. If you can’t answer/understandthese questions don’t take the class until you have taken the prerequisite math classes.Solve the <strong>following</strong> problems. Show your work in the space provided when required (noted with anasterisk *). In some cases just use your calculator. Write your answer in the column on the right.Questions: Show your work in the space provided when required(identified by the asterisk, *).General math concepts.1 Round the <strong>following</strong> number to 4 decimal places: 7.329773242 Write 8 as a fraction.3 What is the reciprocal of 8?4 What is the reciprocal of 1/5?5 What is the reciprocal of .20?6 What is the absolute value of -34.234?7 Which is the larger value, -2.33457 or -2.22457?8 If X >13, could X=13? yes or no?9 If 4.5
17 If one out of every nine adult women smokes, what percent ofadult women smoke?18 If 50% of high school graduates enroll in college then one out ofevery ________ high school graduates enrolls in college. (Fill inthe blank.)19 Write out in percent notation, four-tenths of one percent.20 <strong>The</strong> results of counting the number of M&Ms by color in onepackage are:red: 5; orange: 4; yellow: 6; brown: 7; blue: 1; green: 2What percent of M&Ms in the package are red?21 If 50% of students in a class are female and there are 22 womenin the class, how many students in total are in the class?22 * If there are 30 students in a class and 40% are female, howmany student are male?Solving some basic equations23 (.4)(100) = ?24 What is the square root of 40?25 What is 5 squared?26 What is 5 cubed?27 What is 5 to the power of 14?28 If X squared = 36, what is the value of X?29 * Solve <strong>for</strong> X: 23 = 4X + 330 * Solve <strong>for</strong> X: X=2(1+3)+3(7-3)+4(20/5)Page 2 of 5
31 * Solve <strong>for</strong> X: X={[(5/20)]/.25}10032 * Find the value of y from the <strong>following</strong> equation: y=ax+bgivena=3b=2x=7Working with the equation <strong>for</strong> a straight line–basic concepts.33 Write the basic equation that represents a straight line.34 From your answer to the above (the basic equation) what symbolrepresents the “y-intercept”?35 What does the y-intercept represent? Explain in words.36 From your basic equation, what symbol represents the “slope” ?37 What does the “slope” represent? Explain in wordsWorking with graphs.Refer to the graph indicated to answer the <strong>following</strong>. Graphs are on page 5.38 Graph 1What happens to income between the ages of 30 and 40? Does itincrease, decrease or remain the same?Page 3 of 5
39 Graph 1What happens to income between the ages of 60 and 70? Does itincrease, decrease or remain the same?40 Graph 1At what age is income the greatest?41 Graph 2What happens to consumption spending as income increases?Does it increase, decrease or remain the same.42 Graph 2If income is $50,000 what is the level of consumption spending?43 Graph 2If income is $0 what is the level of consumption spending?44 Graph 2What is the value of the y-intercept?45 Graph 2Calculate the slope of the line?46 Graph 2If income increases by $10,000 consumption will increase by howmuch?47 Graph 2Write the equation <strong>for</strong> the line using your y-intercept and slopevalues.48 Graph 2Use your equation from the question above to predict the value ofconsumption spending if income were $70,000.49 Graph 3If the price of rutabagas increases, what happens to the amount ofrutabagas purchased? Does it increase, decrease or remain thesame?50 Graph 3If the price of rutabagas is $4, how many rutabagas arepurchased.51 Graph 3Calculate the slope of the line.52 Which graph or graphs show a linear relationship?53 Which graph or graphs show a non-linear relationship?54 Which graph shows a negative linear relationship?55 Which graph shows a positive linear relationship?Page 4 of 5
Graph 1Graph 2Graph 3Page 5 of 5