GMT I, mapping and plotting
GMT I, mapping and plotting
GMT I, mapping and plotting
- No tags were found...

You also want an ePaper? Increase the reach of your titles
YUMPU automatically turns print PDFs into web optimized ePapers that Google loves.
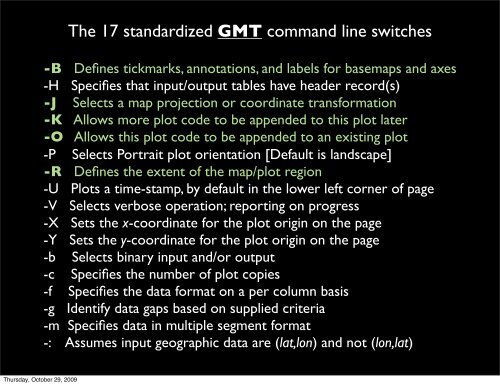
The 17 st<strong>and</strong>ardized <strong>GMT</strong> comm<strong>and</strong> line switches-B Defines tickmarks, annotations, <strong>and</strong> labels for basemaps <strong>and</strong> axes-H Specifies that input/output tables have header record(s)-J Selects a map projection or coordinate transformation-K Allows more plot code to be appended to this plot later-O Allows this plot code to be appended to an existing plot-P Selects Portrait plot orientation [Default is l<strong>and</strong>scape]-R Defines the extent of the map/plot region-U Plots a time-stamp, by default in the lower left corner of page-V Selects verbose operation; reporting on progress-X Sets the x-coordinate for the plot origin on the page-Y Sets the y-coordinate for the plot origin on the page-b Selects binary input <strong>and</strong>/or output-c Specifies the number of plot copies-f Specifies the data format on a per column basis-g Identify data gaps based on supplied criteria-m Specifies data in multiple segment format-: Assumes input geographic data are (lat,lon) <strong>and</strong> not (lon,lat)Thursday, October 29, 2009