swap spread puzzle notes.pdf
swap spread puzzle notes.pdf
swap spread puzzle notes.pdf
- No tags were found...

Create successful ePaper yourself
Turn your PDF publications into a flip-book with our unique Google optimized e-Paper software.
The 30s Swap Spread Puzzle10-22
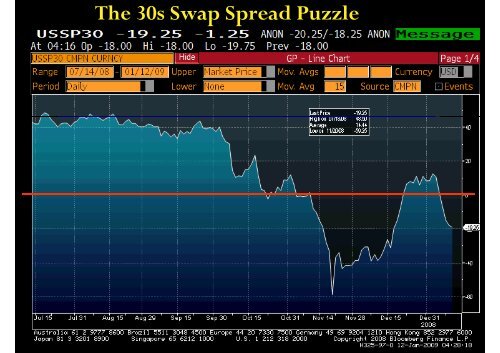
http://insight.kellogg.northwestern.edu/index.php/finance/Fundamental Value and the Swap Spread AnomalyArvind KrishnamurthyMany pundits and policymakers think that asset prices have deviated from “fundamental values” and that thisdeviation is part of the problem affecting financial institutions. For example, if mortgage and credit assets,which banks hold in plenty, are currently priced below “fundamental values,” then banks will be assessedlarger losses than they otherwise would. This in turn can lead to concerns of banks defaulting, etc. In otherwords, the dysfunctionality of asset markets is part of the problem in the current financial crisis.But, what is fundamental value, and how can one make these sorts of statement? The notion that one canaccurately assess “fundamental value” on the most toxic mortgage-backed securities should be rightly treatedwith some suspicion. However, there is considerable evidence that arbitrage forces, which we normally taketo be the key enforcer of fundamental value relationships, are not present in today’s environment. This iscircumstantial evidence for fundamental value deviations.Below I discuss two pricing relationships which reflect these distortions. The examples are somewhat involved;but bear with me because they are not as complicated as they sound, and they are illuminating.Figure 1: Swap Spreads (sourse: Federal Reserve)10-23
10-24
Figure 2: OAS on GNMA 6% (source: Bloomberg)The blue line graphs the <strong>spread</strong> on the Ginnies versus the interest rate <strong>swap</strong> (i.e. LIBOR) curve. The Ginnies carrythe explicit “full faith and credit of the U.S. government” and are therefore as safe as Treasuries. Moreover, if ahomeowner defaults on a mortgage, the U.S. government absorbs any losses, paying par to the holder of themortgage-backed security. Thus there is no default issue with these securities, and the risks as with all MBS, areprepayment risk and interest rate risk. Ginnies also have much higher underwriting standards than subprimemortgages, so that the typical equity buffer is on the order of 20%.Prior to February of 2008 the <strong>spread</strong> is negative reflecting the low credit risk that comes with the explicit governmentguarantee. The first blip upwards in the <strong>spread</strong> is in March with the Bear Stearns event. Bear Stearns was animportant player in the mortgage market, and thus one read of this graph is that the capital devoted to pricing andbearing MBS risk shrank in the Bear Stearns event. The next blip upwards in the <strong>spread</strong> is at the end of July,corresponding to the problems with Fannie Mae and Freddie Mac. Although Ginnie Mae was not directly affectedin this event, the problems in Fannie and Freddie further shrank the risk-capital in the mortgage market. The<strong>spread</strong> increases again the week of September 26 (data is weekly in the graph). Note that since the <strong>spread</strong> ismeasured relative to <strong>swap</strong>s, and LIBOR was also affected during this event, the <strong>spread</strong> rise is not initiallydramatic.The upper (red) line in the graph reflects the MBS <strong>spread</strong> relative to Treasuries. The high <strong>spread</strong>s reflect aphenomenon that is common in crises: investors especially value the liquidity of Treasuries, pushing the <strong>spread</strong>srelative to Treasuries up on all securities. The <strong>spread</strong> patterns are broadly similar to that of the lower (blue)line. The low point in the <strong>spread</strong> occurs the week of September 12 (again, data is weekly).These high <strong>spread</strong>s on a security which has no credit risk also points to the scarcity of arbitrage capital in themarketplace and the large effects that this shortage can have on asset prices. For financial institutions, this isimportant because it suggests that the value of financial claims reflecting future mortgage risk is especially low.Hence the losses on financial institutions balance sheets are larger than they would otherwise be if prices were atfundamental value. For households and the mortgage market more generally, the high Ginnie Mae <strong>spread</strong> impliesthat homeowner mortgage rates remain at high <strong>spread</strong>s relative to Treasuries. Thus, it helps explain whymortgage rates have remained high despite the general drop in interest rates as reflected by the Federal Funds rateor the rates on Treasuries.If the prices on these two low-risk assets – <strong>swap</strong> <strong>spread</strong> and Ginnie Mae MBS – can be as affected by marketdisruptions, we can surmise that more risk-sensitive assets such as the senior tranches on subprime CDOs must bemore affected. Thus, it is very likely that asset prices are far from fundamental values.10-27
10-28
01/01/200965432110-293M Libor 3m Tbill FedFund3mL-Trgt 3mL-3mTBil03/01/200817/01/200831/01/200814/02/200828/02/200813/03/200827/03/200810/04/200824/04/200808/05/200822/05/200805/06/200819/06/200803/07/200817/07/200831/07/200814/08/200828/08/200811/09/200825/09/200809/10/200818/12/200804/12/200820/11/200806/11/200823/10/20080-1
01/01/200918/12/200804/12/200820/11/200806/11/200823/10/200810-306543210-13M Libor 3m Tbill FedFund3mL-Trgt 3mL-3mTBil03/01/200817/01/200831/01/200814/02/200828/02/200813/03/200827/03/200810/04/200824/04/200808/05/200822/05/200805/06/200819/06/200803/07/200817/07/200831/07/200814/08/200828/08/200811/09/200825/09/200809/10/2008
10-31
10-32
10-33