Acute Multidimensional Poverty: A New Index for Developing ... - OPHI
Acute Multidimensional Poverty: A New Index for Developing ... - OPHI
Acute Multidimensional Poverty: A New Index for Developing ... - OPHI

Create successful ePaper yourself
Turn your PDF publications into a flip-book with our unique Google optimized e-Paper software.
Ox<strong>for</strong>d <strong>Poverty</strong> & Human Development Initiative (<strong>OPHI</strong>)Ox<strong>for</strong>d Department of International DevelopmentQueen Elizabeth House (QEH), University of Ox<strong>for</strong>d<strong>OPHI</strong> WORKING PAPER NO. 38<strong>Acute</strong> <strong>Multidimensional</strong> <strong>Poverty</strong>:A <strong>New</strong> <strong>Index</strong> <strong>for</strong> <strong>Developing</strong> CountriesSabina Alkire 1 and Maria Emma Santos 2July 2010AbstractThis paper presents a new <strong>Multidimensional</strong> <strong>Poverty</strong> <strong>Index</strong> (MPI) <strong>for</strong> 104 developing countries. It isthe first time multidimensional poverty is estimated using micro datasets (household surveys) <strong>for</strong>such a large number of countries which cover about 78 percent of the world´s population. The MPIhas the mathematical structure of one of the Alkire and Foster poverty multidimensional measuresand it is composed of ten indicators corresponding to same three dimensions as the HumanDevelopment <strong>Index</strong>: Education, Health and Standard of Living. The MPI captures a set of directdeprivations that batter a person at the same time. This tool could be used to target the poorest,track the Millennium Development Goals, and design policies that directly address the interlockingdeprivations poor people experience. This paper presents the methodology and components in theMPI, describes main results, and shares basic robustness tests.Keywords: <strong>Poverty</strong> Measurement, <strong>Multidimensional</strong> <strong>Poverty</strong>, Capability Approach,<strong>Multidimensional</strong> Welfare, Human Development, HDI, HPI.JEL classification: I3, I32, D63, O11 Ox<strong>for</strong>d <strong>Poverty</strong> & Human Development Initiative (<strong>OPHI</strong>), Queen Elizabeth House (QEH), Department of InternationalDevelopment, 3 Mansfield Road, Ox<strong>for</strong>d OX4 1SD, UK +44 1865 271915, sabina.alkire@qeh.ox.ac.uk2 Ox<strong>for</strong>d <strong>Poverty</strong> and Human Development Initiative, UK and Consejo Nacional de Investigaciones Científicas y Técnicas,Universidad Nacional del Sur, Argentina. maria.santos@qeh.ox.ac.uk1This study has been prepared within the <strong>OPHI</strong> theme on multidimensional measurement.<strong>OPHI</strong> gratefully acknowledges support <strong>for</strong> its research and activities from the Government of Canada through theInternational Development Research Centre (IDRC) and the Canadian International Development Agency (CIDA), theAustralian Agency <strong>for</strong> International Development (AusAID), and the United Kingdom Department <strong>for</strong> InternationalDevelopment (DFID) as well as private benefactors.ISSN 2040-8188 ISBN 978-1-907194-22-1
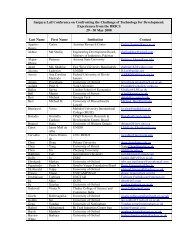
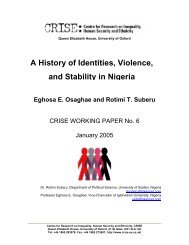
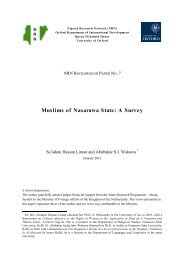
Ox<strong>for</strong>d <strong>Poverty</strong> & Human Development Initiative (<strong>OPHI</strong>)Ox<strong>for</strong>d Department of International DevelopmentQueen Elizabeth House (QEH), University of Ox<strong>for</strong>dProportion of Poor People1.000.900.800.700.600.500.400.300.200.100.00Contribution education Contribution health Contribution living standards $1.25 a day poorNigerEthiopiaMaliCentral African RepublicBurundiLiberiaBurkina FasoGuineaSierra LeoneRwandaMozambiqueAngolaComorosDR CongoMalawiBeninMadagascarSenegalTanzaniaNepalZambiaNigeriaChadMauritaniaGambiaKenyaBangladeshHaitiRepublic of CongoIndiaCameroonTogoCambodiaYemenCote d'IvoireSao Tome and PrincipePakistanLesothoLaoSwazilandNicaraguaBoliviaGabonHondurasGhanaDjiboutiMoroccoGuatemalaIndonesiaPeruTajikistanMongoliaViet NamParaguayPhilippinesChinaDominican RepublicColombiaBrazilTurkeyEstoniaEgyptAzerbaijanSri LankaKyrgyzstanMexicoSouth AfricaArgentinaTunisiaJordanUzbekistanArmeniaEcuadorMoldovaUkraineMacedoniaUruguayThailandCroatiaMontenegroRussian FederationAlbaniaSerbiaBosnia and HerzegovinaGeorgiaHungaryKazakhstanLatviaBelarusSlovenia2This study has been prepared within the <strong>OPHI</strong> theme on multidimensional measurement.<strong>OPHI</strong> gratefully acknowledges support <strong>for</strong> its research and activities from the Government of Canada through theInternational Development Research Centre (IDRC) and the Canadian International Development Agency (CIDA), theAustralian Agency <strong>for</strong> International Development (AusAID), and the United Kingdom Department <strong>for</strong> InternationalDevelopment (DFID) as well as private benefactors.ISSN 2040-8188 ISBN 978-1-907194-22-1
<strong>Acute</strong> <strong>Multidimensional</strong> <strong>Poverty</strong>: A <strong>New</strong> <strong>Index</strong> <strong>for</strong> <strong>Developing</strong> CountriesAlkire & SantosFigure 8: Composition of MPI by H and AFigure 9: Categorisation of countries by their combination of H and AFigure 10: Contribution by Dimension to MPIFigure 11: Correlations of Income <strong>Poverty</strong> Headcounts with MPI and dimensional headcountsFigure 12: Scatter plot of MPI vs. $1.25/day headcountFigure 13: Scatter plot of GDP per capita vs. MPI HeadcountFigure 14: Crosstab of Income and MPI <strong>Poverty</strong>Figure 15: Income <strong>Poverty</strong> vs. MPI <strong>Poverty</strong> in Sri Lanka, China and ChadFigure 16: Income <strong>Poverty</strong> vs. MPI <strong>Poverty</strong>: insightful mismatchesFigure 17: DHS Wealth <strong>Index</strong> vs. MPI <strong>Poverty</strong>: insightful mismatchesFigure 18: Summary MPI and income poverty estimates by UN regionsFigure 19: Map of India MPI by StateFigure 20: MPI Estimates of Kenyan States Compared with Aggregate MPI in other countriesFigure 21: Composition of <strong>Poverty</strong> in Two Indian StatesFigure 22: MPI Composition PatternsFigure 23: Five ‘Types’ of poverty found across countriesFigure 24: Malnutrition and Child Mortality in Sub-Saharan Africa and South AsiaFigure 25: MPI in two points in time in Bangladesh, Ethiopia and GhanaFigure 26: Decomposition of changes in MPI over time in Bangladesh, Ethiopia and GhanaFigure 27: Decomposition of changes in MPI over time in Bangladesh, Ethiopia and Ghana - Rural and UrbanFigure 28: Ratio of Rural MPI to Urban MPI in two points in time in Bangladesh, Ethiopia and GhanaFigure 29: Changes in Deprivation in each Indicator - Bangladesh, Ethiopia and GhanaFigure 30: Underweight, Stunting and Wasting in India and Mali using different reference populationsFigure 31: Examples of Robustness to the k-cutoff <strong>for</strong> countries by UN RegionsList of AppendicesAppendix 1: Tables of Estimation ResultsAppendix 2: Tables of Sample Sizes and Non-Response RatesAppendix 3: Decomposition results <strong>for</strong> India, Kenya and BoliviaAppendix 4: Differences in children´s nutritional reference populationsAppendix 5: Correlations between different specifications of MPIAcronyms:A: The intensity of <strong>Multidimensional</strong> <strong>Poverty</strong>, measured by the proportion of weighted indicators in whichthe average <strong>Multidimensional</strong>-poor person is deprived.CHNS: China Health and Nutrition Survey (here using 2006)DHS: Demographic and Health SurveyENSANUT: National Survey of Health and Nutrition <strong>for</strong> Mexico (Encuesta Nacional de Salud y Nutricion,2006ENNyS: National Survey of Nutrition and Health, <strong>for</strong> Argentia (Encuesta Nacional de Nutricion y Salud,2004-2005H: Headcount, or the proportion of the population who are identified as poorMPI: <strong>Multidimensional</strong> <strong>Poverty</strong> <strong>Index</strong>MICS: Multiple Indicator Cluster SurveyWHS: World Health SurveyHDI: Human Development <strong>Index</strong>HPI: Human <strong>Poverty</strong> <strong>Index</strong>UN: United NationsWHO: World Health OrganizationMDG: Millennium Development Goalswww.ophi.org.uk July 2010 5
<strong>Acute</strong> <strong>Multidimensional</strong> <strong>Poverty</strong>: A <strong>New</strong> <strong>Index</strong> <strong>for</strong> <strong>Developing</strong> CountriesAlkire & Santos1. INTRODUCTIONIn June 2010, the UNDP released an assessment of What it would take to reach the MillenniumDevelopment Goals (MDGs hereafter) based on detailed studies in 50 countries. Its first key message isthat we need to address the deprivations that trap people in poverty together. Because they areinterconnected: “acceleration in one goal often speeds up progress in others…. Given thesesynergistic and multiplier effects, all the goals need to be given equal attention and achievedsimultaneously.” In doing so, the report echoed and strengthened an insight from the 2001 UNRoadmap towards the Implementation of the MDGs, which pointed out that “all the issues around povertyare interconnected and demand crosscutting solutions” (p 3). But how are the interconnections to beseen, and how can they in<strong>for</strong>m ‘crosscutting’ solutions?Amartya Sen, Nobel Laureate in Economics whose work underpins the concept and measures ofhuman development, has argued powerfully <strong>for</strong> the need to take a multidimensional approach topoverty as well as development: “Human lives are battered and diminished in all kinds of differentways, and the first task… is to acknowledge that deprivations of very different kinds have to beaccommodated within a general overarching framework” (Sen 2000). Sen’s perspective hasimplications <strong>for</strong> poverty measurement. “The need <strong>for</strong> a multidimensional view of poverty anddeprivation,” Anand and Sen wrote in 1997, “guides the search <strong>for</strong> an adequate indicator of humanpoverty.” 3In<strong>for</strong>med and inspired by previous work, 4 this paper implements a new international measure ofacute multidimensional poverty <strong>for</strong> 104 countries. What is distinctive about this multidimensionalpoverty index, or MPI, is that it reflects the overlapping deprivations that members of a householdexperience. By providing in<strong>for</strong>mation on the joint distribution of deprivations related to the MDGs– which shows the intensity and the composition of several aspects of poverty at the same time – wehave tried to explore how better measures could support ef<strong>for</strong>ts to accelerate the reduction ofmultidimensional poverty.Map of paper. The paper proceeds as follows. First, we set the context <strong>for</strong> the MPI by describingthe main differences between MPI and income poverty measures, and MDG indicators. Next, wedescribe the construction of the MPI, focusing on the normative selection of dimensions, indicators,cutoffs and weights; on the influence of data limitations; and on the methodology <strong>for</strong> identifyingwho is poor and aggregating data into a poverty index. We signal the main axiomatic properties ofthe MPI which make it particularly suited <strong>for</strong> the policy analysis that follows. Next, we introduce thedata sources used to calculate the MPI and the particular considerations and adaptations we havemade <strong>for</strong> each indicator. Following this, we present the main results of the MPI. First, we presentthe MPI findings and undertake key comparisons. Second, we drill down to explore more finely therelationship between MPI and income data. Third, we illustrate further features of the MPI that canin<strong>for</strong>m policy analysis: we decompose the MPI in greater detail <strong>for</strong> certain countries; we identifydistinct ‘types’ of poverty that begin to illustrate different regular patterns of deprivation, or povertytraps; and we explore changes in the MPI over time using time series data <strong>for</strong> three countries.Finally, we present a set of robustness tests <strong>for</strong> the MPI that focus on its robustness to changes inpoverty cutoffs, to changes in certain variables, and in the cross-dimensional cutoff k. We close by3 See also Sen 1992, Sen 1993, Foster and Sen 19974 In particular, the works cited above and also Bourguignon and Chakravarty (2003), Atkinson (2003), and Brandolini &D’Alessio (2009).www.ophi.org.uk July 2010 6
<strong>Acute</strong> <strong>Multidimensional</strong> <strong>Poverty</strong>: A <strong>New</strong> <strong>Index</strong> <strong>for</strong> <strong>Developing</strong> CountriesAlkire & Santosidentifying additional avenues <strong>for</strong> further scrutiny, such as the relationship between MPI andhousehold size and composition, or robustness tests on the indicator weights.1.1 <strong>Multidimensional</strong> <strong>Poverty</strong> <strong>Index</strong>: Basic OverviewThe MPI is an index of acute multidimensional poverty. It reflects deprivations in very rudimentaryservices and core human functionings <strong>for</strong> people across 104 countries. Although deeply constrainedby data limitations, the MPI reveals a different pattern of poverty than income poverty, as itilluminates a different set of deprivations. The MPI has three dimensions: health, education, andstandard of living. These are measured using ten indicators. Poor households are identified and anaggregate measure constructed using the methodology proposed by Alkire and Foster (2007, 2009).Each dimension is equally weighted; each indicator within a dimension is also equally weighted.The MPI reveals the combination of deprivations that batter a household at the same time. Ahousehold is identified as multidimensionally poor if, and only if, it is deprived in some combinationof indicators whose weighted sum is 30 percent or more of the dimensions. The dimensions,indicators, and deprivation criteria are presented below and explained with detail in the followingsection.1. Health (each indicator weighted equally at 1/6) Child Mortality: If any child has died in the family Nutrition: If any adult or child in the family is malnourished2. Education (each indicator weighted equally at 1/6 ) Years of Schooling If no household member has completed 5 years of schooling Child School Attendance If any school-aged child is out of school in years 1 to 83. Standard of Living (each of the six indicators weighted equally at 1/18) Electricity If household does not have electricity Drinking water If does not meet MDG definitions, or is more than 30 mins walk Sanitation If does not meet MDG definitions, or the toilet is shared Flooring If the floor is dirt, sand, or dungCooking Fuel If they cook with wood, charcoal, or dungAssets If do not own more than one of: radio, tv, telephone, bike, motorbike orrefrigerator and do not own a car or truck.The MPI is the product of two numbers: the Headcount H or percentage of people who are poor,and the Average Intensity of deprivation A – which reflects the proportion of dimensions in whichhouseholds are deprived. Alkire and Foster show that this measure is very easy to calculate andinterpret, is intuitive yet robust, and satisfies many desirable properties.1.2 Millennium Development Goals (MDGs)Since 2000, the United Nations and World Bank have compiled and reported data on the progressof nations and regions with respect to a uni<strong>for</strong>m set of targets and indicators. These targets andindicators were agreed upon within the MDG framework, and countries’ progress towards them hasbeen monitored. The additional quantitative targets are needed because income poverty measuresprovide vitally important but incomplete guidance to redress multidimensional poverty.www.ophi.org.uk July 2010 7
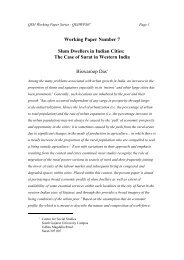
<strong>Acute</strong> <strong>Multidimensional</strong> <strong>Poverty</strong>: A <strong>New</strong> <strong>Index</strong> <strong>for</strong> <strong>Developing</strong> CountriesAlkire & SantosThe MDGs catalysed the collection and compilation of comparable international data related to theagreed goals and targets. The MDG statistics are presented annually and have been tremendouslyuseful in providing feedback regarding improved development outcomes and in creating incentivesto address core deprivations.Unlike the MPI, however, the international MDG reports invariably report progress on eachindicator singly. No composite MDG index has been developed, and few studies have reflected theinterconnections between indicators. The reason that no composite MDG index has been developedis plain to see: the ‘denominator’ or base population of MDG indicators differ. In some cases it is allpeople (malnutrition, income); in some cases children (primary school, immunization), or youth 15-24 (literacy), or childbearing women (maternal mortality), or households (access to secure tenure),and so on. Some environmental indicators do not refer to human populations at all. Given thisdiversity of indicators, it is difficult to construct an index that meaningfully brings all deprivationsinto the same frame.What the MPI does in relation to the MDGs is the following. First, it employs indicators that relateto the MDGs: 8 of the 10 indicators are directly linked to MDGs; the other two (electricity, flooring)are plausibly related. Second, the MPI establishes the ‘base’ population as being the household.People live in households, the suffering of one member affects other members, and similarly theabilities of one member (e.g. literacy) often help other household members. Third, within theseparameters, insofar as data permit, the MPI illuminates the simultaneous deprivations of households.This enables us to identify different ‘types’ of deprivations – clusters of deprivations that occurregularly in different countries or groups. Such a measure can thus contribute to a betterunderstanding of the interconnectedness among deprivations, can help identify poverty traps, andcan thus strengthen the composition and sequencing of interventions required to meet the MDGs.It is indeed our hope that the MPI will support ef<strong>for</strong>ts to accelerate progress towards the MDGs.Figure 1: Tracking the MDGs bypercentage of developing countriesA final comment on the MPI analysis in comparison withthe MDG reports is that in this paper we have oftenfocused our results on people rather than nations. ManyMDG reports identify the percentage of countries that are‘on target’ to meet the MDGs. Suchanalyses do not present anyin<strong>for</strong>mation on the actual number ofpeople who are deprived – althoughthe MDGs were deemed feasible ata global not national level.Reporting the MDGs entirely interms of countries deeply underemphasisespoor people in largecountries. India has 3,000 times asmany people as the Maldives, buteach contribute equally as one South Asian country. In effect, this means that each Indian citizen’slife is weighted 1/3000 th as much as a citizen of the Maldives. This aspect of the MDG reportingsystem is pervasive, affecting all Global Monitoring Reports (the above figure is from p 25 of the 2010Report), <strong>for</strong> example, and summary tables on progress to achieving the MDGs. Yet in a humanrights-based approach and many other ethical approaches, every human life is to be given equalweight. For this reason, our analysis of MPI emphasizes the number of people whose lives arewww.ophi.org.uk July 2010 8
<strong>Acute</strong> <strong>Multidimensional</strong> <strong>Poverty</strong>: A <strong>New</strong> <strong>Index</strong> <strong>for</strong> <strong>Developing</strong> CountriesAlkire & Santosdiminished by multiple deprivations – not the number of countries. Naturally, because many policiesare constructed at the national level, we also report the percentage of people in different countrieswho are deprived and the intensity of their poverty, as these data are tremendously useful toincentivize and celebrate progress.2. METHODOLOGY2.1 Alkire Foster MethodAs a measure, the MPI has the mathematical structure of one member of a family ofmultidimensional poverty measures proposed by Alkire and Foster (2007, 2009). This member ofthat family is called M 0 or Adjusted Headcount Ratio. M 0 is the appropriate measure to be usedwhenever one or more of the dimensions to be considered are of ordinal nature, meaning that theirvalues have no cardinal meaning. 5 In this section, we describe this mathematical structure which isactually a methodology <strong>for</strong> poverty measurement. For accuracy, we refer to the measure as M 0 . TheMPI is the M 0 measure with a particular selection of dimensions, indicators and weights, which willbe explained below.M 0 measures poverty in d dimensions across a population of n individuals. 6 Let y y ij denote then d matrix of achievements <strong>for</strong> i persons across j dimensions. The typical entry in the achievementy ij ≥0 represents individual i’s achievement in dimension j. Each row vector yi ( yi1,yi2,...., yid)gives individual i’s achievements in the different dimensions, whereas each column vectory. j ( y1 j, y2 j,...., ynj) gives the distribution of achievements in dimension j across individuals. M 0allows weighting each dimension differently. In fact, this is the procedure followed by the MPI,which has ‘nested weights’. For that purpose, we define a weighting vector w. The element w jdrepresents the weight that is applied to dimension j. Note that wj 1 j d, that is, the dimensionalweights sum to the total number of dimensions. In the case of the MPI d=10.To identify who is poor among the population, a two-step procedure is applied using two differentkinds of cutoffs. First we identify all individuals who are deprived in any dimension. Let zj0bethe poverty line (or deprivation cut-off) in dimension j, and z be the vector of poverty lines <strong>for</strong> eachof the dimensions of multidimensional poverty. Define a matrix of deprivations g 0 [ g0ij], whose00typical element gijis defined by gij wjwhen yij z , and g 0 0jijwhen yij z . That is, thejthij entry of the matrix is equivalent to the dimensional weight w j when person i is deprived indimension j, and is zero when the person is not deprived.5 For example, the type of source of drinkable water can be coded as 4 if the water source is some <strong>for</strong>m of piped water,3 if it is a public tap or standpipe, 2 if it a tube well, borehole or protected well, and 1 if it is some unprotected source.However the values 1, 2, 3, 4 have no meaning in themselves: having a value of 3 does not mean that the person is threetimes better off than another that has a value of 1.6 Note that Alkire and Foster term ‘dimensions’ is what we have referred to as ‘indicators’ in this paper. The MPI iscomposed of ten indicators, and the weighting vector takes the value of 0.56 <strong>for</strong> the living standard indicators and 1.67<strong>for</strong> the indicators of health and education.www.ophi.org.uk July 2010 9
<strong>Acute</strong> <strong>Multidimensional</strong> <strong>Poverty</strong>: A <strong>New</strong> <strong>Index</strong> <strong>for</strong> <strong>Developing</strong> CountriesAlkire & Santos0From the matrix g we construct a column vector c of deprivation counts, whose i th d 0entry ci gj1ijrepresents the sum of weighted deprivations suffered by person i 7 . Second, we need to identify whois to be considered multidimensionally poor. To do so, we select a second cutoff k>0 and apply itacross this column vector c. More <strong>for</strong>mally, let : d d R R 0,1, kbe the identification functionddthat maps from person i´s achievement vector yi R and cutoff vector z in R to an indicatorvariable. ktakes the value of 1 when c i k , and k( y i, z) 0 when c i k . That means that aperson is identified as poor if her weighted deprivation count is greater than or equal to k. This iscalled a dual cutoff method, because it uses the within dimension cutoffs z jto determine whether aperson is deprived or not in each dimension, and the cross-dimensional cutoff k to determine who is tobe considered poor.To aggregate in<strong>for</strong>mation about poor persons into the population-wide measure MPI, we focus onpoor people by censoring the deprivations of persons who are deprived but non-poor given k. Todo that we construct a second matrix0 0g ( k ), obtained from g by replacing its i th 0row giwith avector of zeros whenever k= 0. This matrix contains the weighted deprivations of all persons whohave been identified as poor and excludes deprivations of the non-poor. From this censored matrixwe construct the censored vector of deprivation counts ck ( ) which differs from vector c in that it countszero deprivations <strong>for</strong> those not identified as multidimensionally poor. 8 M 0 is simply the mean of thematrix0 0g ( k ), that is M0 ( g ( k)), where μ denotes the arithmetic mean operator. In words, M 0is the weighted sum of the deprivations the poor experience divided by the total number of peopletimes the total number of dimensions considered. 9Interestingly, it can be verified that M 0 can also be expressed as the product of two intuitivemeasures: the (multidimensional) headcount ratio (H) and the average deprivation share among thepoor (A). H is simply the proportion of people that are poor. That is, H q n where q is thenumber of poor people; it represents the incidence of multidimensional poverty. To understand A,we first notice that ci( k)/d indicates the fraction of weighted indicators in which the poor person iis deprived. The average of that fraction among those who are poor (q), is precisely A, where itsnexpression is given by A ci( k)dq. A represents the intensity of multidimensional poverty.i1In this way, the M 0 measure summarises in<strong>for</strong>mation on the incidence of poverty and its intensity,hence its name of Adjusted Headcount Ratio. As a consequence of combining both H and A, M 0satisfies dimensional monotonicity 10 : if a poor individual becomes deprived in an additional dimension,the M 0 will increase. This is a very important advantage over the multidimensional headcount, which7 Note that c i is simply the sum of all the entries in the i th row of matrix8 Note thatg ( k) g ( y , z)and c ( k) c( y , z).0 0ij ij ii i in d0 i1 j1ij9 0In a more conventional notation: M g nd .10 Alkire and Foster (2007) define the axiom <strong>for</strong>mally and explain the intuition thus: “Dimensional monotonicity specifiesthat poverty should fall when the improvement removes the deprivation entirely.” In other words, if a person who wasdeprived in four dimensions is now deprived in three dimensions only, by dimensional monotonicity, poverty shouldfall.0g .www.ophi.org.uk July 2010 10
<strong>Acute</strong> <strong>Multidimensional</strong> <strong>Poverty</strong>: A <strong>New</strong> <strong>Index</strong> <strong>for</strong> <strong>Developing</strong> CountriesAlkire & Santosdoes not vary when the poor become poor in another dimension. Yet a society that has 30 percentof its population in poverty where –on average – the poor are deprived on average in six out of tendimensions seems poorer than a society that although also having 30 percent of its population inpoverty, the poor are deprived on average in three out of ten dimensions. M 0 reflects this higherintensity, H does not.Another important characteristic of M 0 is that it is decomposable by population subgroups. Giventwo distributions x and y, corresponding to two population subgroups of size n(x) and n(y), theweighted sum of the subgroup poverty levels (weights referring to the population shares) equals theoverall poverty level obtained when the two subgroups are merged (with the total population notedas n(x,y):nx ( ) ny ( )M0( x, y; z) M0( x, z) M0( y, z)nxy ( , ) nxy ( , )Additionally, after identification, M 0 can be broken down by dimension. To see this, note that the0measures can also be expressed in the following way: M d0( g 1 * j( k ))/ d0 , where g ( )j* jk isthe j th column of the censored matrix g0 ( k ). The contribution of dimension j to multidimensional0poverty can be expressed as Contrj ( ( g* j( k))/ d)M0. Itemizing the contribution of eachdimension provides in<strong>for</strong>mation that can be useful to reveal a group or region’s particularconfiguration of deprivations and to target poor persons. This is a second advantage of M 0 over H,which does not allow such break-down.The intuition of M 0 – the proportion of the poor adjusted by the intensity of their poverty– togetherwith its convenient properties of dimensional monotonicity and decomposability makes it a suitablemeasure to be adopted in an index that intends to be internationally comparable and robust as theMPI, and this is why we use the M 0 structure in the MPI. 11The Alkire Foster M 0 methodology does not specify dimensions, indicators, weights, or cutoffs; it isflexible and can be adapted to many contexts. The MPI, in contrast, has specified dimensions,indicators, weights, and cutoffs. In the remainder of this section, we explain how and why thesewere chosen.2.2 Choice of DimensionsSen has argued that the choice of relevant functionings and capabilities <strong>for</strong> any poverty measure is avalue judgment rather than a technical exercise. “There is no escape from the problem of evaluationin selecting a class of functionings in the description and appraisal of capabilities, and this selectionproblem is, in fact, one part of the general task of the choice of weights in making normativeevaluation…. The need <strong>for</strong> selection and discrimination is neither an embarrassment, nor a uniquedifficulty, <strong>for</strong> conceptualizing functionings and capabilities” (Sen 2008). 1211 M 0 also satisfies other properties: replication invariance, symmetry, poverty focus, deprivation focus, weakmonotonicity, non-triviality, normalisation, and weak re-arrangement.12 As is well known, Nussbaum argues that a list of central human capabilities must be specified <strong>for</strong> the purpose ofconstitutional guarantees. Her argument and Sen’s rejoinder arguing against the creation of one list of capabilities ingeneral, can be found in these articles: Nussbaum 2003, Sen 2004a.www.ophi.org.uk July 2010 11
<strong>Acute</strong> <strong>Multidimensional</strong> <strong>Poverty</strong>: A <strong>New</strong> <strong>Index</strong> <strong>for</strong> <strong>Developing</strong> CountriesAlkire & SantosThe potential dimensions that a measure of poverty might reflect are quite broad and include health,education, standard of living, empowerment, work, environment, safety from violence, socialrelationships, and culture among others. In the context of choosing capabilities that have a moralweight akin to human rights, Sen has suggested focusing on dimensions that are of a) specialimportance to the society or people in question, and b) social influenceable – which means that they arean appropriate focus <strong>for</strong> public policy, rather than a private good or a capability like serenity whichcannot be influenced from outside. 13In practice, the selection of the 2010 HDR dimensions has relied on the following mechanisms:a. The first is the literature arising from participatory exercises, which engage a representativegroup of participants as reflective agents in making the value judgments to select focalcapabilities. All of the dimensions <strong>for</strong> the MPI have been regularly identified as importantelements of ill-being by communities.b. The second is the use of some enduring consensus, particularly surrounding human rights andthe Millennium Development Goals (MDGs).c. The third is theory based, as in the many philosophical or psychological accounts of basicneeds, universal values, human rights, and so on.d. The fourth and the binding constraint is whether the data exist. Due to data constraints (as wellas, perhaps, interpretability) we have had to severely limit the dimensions. For example, wedo not have sufficient data on work or on empowerment. Yet each of these dimensionsshould arguably be considered in a human development-based multidimensional povertymeasure. 14The MPI includes three dimensions: health, education, and the standard of living. The dimensionsmirror the HDI. Why is this? Now, as then, data <strong>for</strong>m the binding constraint. The construction ofthe HDI was driven to a great extent by the cross-country data available in 1990, as well as the needto generate a simple compelling policy message. It included three dimensions and four indicators.The Human <strong>Poverty</strong> <strong>Index</strong> (HPI) released in 1997 maintained the same three dimensions, butdefined the indicators differently. Both the HDI and the HPI have been criticized <strong>for</strong> not includingadditional dimensions, such as those identified as human rights or within the MDGs. We very muchwished the MPI to include additional vital dimensions. Un<strong>for</strong>tunately, we can state categorically thatcomparable data of sufficient quality are not available from the same survey in the public domain <strong>for</strong>100+ less developed countries to consider any other dimensions, nor to include consumption data. 15However there are several arguments in favor of the chosen dimensions. First, parsimony: havingonly three dimensions simplifies comparisons with income poverty measures. Second, consensus:while there could be some disagreement about the appropriateness of including work,empowerment, or physical safety in a poverty measure, the value of health, education, and basicstandard of living variables is widely recognized. Third, interpretability: there are substantialliteratures and fields of expertise on each of these topics, which will make analysis of the MPI easier.Fourth, data: while some data are poor, the validity, strengths, and limitations of various indicatorsare well documented; such documentation is not as developed in domains such as empowerment.Fifth, inclusivity: human development appreciates both the intrinsic and the instrumental value ofthese dimensions. These same dimensions are emphasized in human capital approaches that seek to13 Sen 2004b.14 Alkire 2008.15 Additional questions are available in the Gallup International survey but the data are not publicly available.www.ophi.org.uk July 2010 12
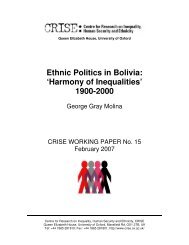
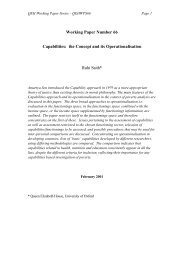
<strong>Acute</strong> <strong>Multidimensional</strong> <strong>Poverty</strong>: A <strong>New</strong> <strong>Index</strong> <strong>for</strong> <strong>Developing</strong> CountriesAlkire & Santosclarify how each dimension is instrumental to income growth. In sum, there are good reasons <strong>for</strong>releasing the first version of the MPI with these three dimensions.At the same time, because data are a binding constraint, a key priority <strong>for</strong> future work onmultidimensional poverty must be gathering more and better data around core areas such asin<strong>for</strong>mal work, empowerment, safety from violence, and human relationships (social capital andrespect versus humiliation) (Alkire 2007). This will enable empirical explorations of whether suchdimensions add value to a multidimensional poverty measure. There is also growing interest inunderstanding potential contributionsfrom data on subjective and psychologicalwell-being.2.3 Choice of Indicators andUnit of AnalysisThe MPI has ten indicators: two each <strong>for</strong>health and education, and six <strong>for</strong> livingstandard. Ideally, the MPI would have usedthe person as a unit of analysis, which ispossible to do with the AF measurementmethodology. Such an analysis would haveenabled us to compare across gender and age groups, and to document intra-household inequalities.The reason we were not able to do this is that the data required <strong>for</strong> such comparisons across 100+developing countries are not available. For example, the DHS gathers nutritional in<strong>for</strong>mation <strong>for</strong>children younger than five years and <strong>for</strong> women in reproductive age; MICS collects nutritionalin<strong>for</strong>mation <strong>for</strong> children only whereas WHS focuses on adults only. The only indicators <strong>for</strong> whichindividual level data are available <strong>for</strong> all householdmembers are years of education and the livingFigure 2: Dimensions and Indicators of MPIstandard variables which naturally apply to all household members. There<strong>for</strong>e the MPI uses thehousehold as a unit of analysis. This means that the indicators differ systematically fromtraditional indicators constructed from the same data, and these differences are explained below.The ten indicators (displayed in Figure 2) are almost the only set of indicators that could have beenused to compare around 100 countries. 16 In fact, one of the main lessons of this first exercise ofestimating multidimensional poverty <strong>for</strong> developing countries is the urgent need to start collectingin<strong>for</strong>mation on key internationally comparable indicators at the individual level (Alkire and Eli,2010).Within the education dimension we use two indicators that complement each other: whethersomeone in the household has five years of education and whether all children of school age are16 For a detailed survey of the academic literature on each indicator please see Alkire and Eli (2010). Note that as anempirical exploration of different indicators and cutoffs, we constructed eight trial measures and presented these in mid-December to UNDP HDRO staff and statistical advisors, together with a draft background paper, and one set ofindicators was selected. In March 2010, we presented four additional trial measures <strong>for</strong> 47 countries, and in April, anadditional five measures <strong>for</strong> 108 countries. The March and April measures had the same three dimensions; the cutoffsand the precise indicators were varied.www.ophi.org.uk July 2010 13
<strong>Acute</strong> <strong>Multidimensional</strong> <strong>Poverty</strong>: A <strong>New</strong> <strong>Index</strong> <strong>for</strong> <strong>Developing</strong> CountriesAlkire & Santosattending school. Years of schooling acts as a proxy <strong>for</strong> the level of knowledge and understandingof household members. While years of schooling is an imperfect proxy, not capturing the quality ofeducation nor the level of knowledge attained, nor skills, it is a robust indicator, widely available, andprovides the closest feasible approximation to levels of education <strong>for</strong> household members. It can beconceived as a relatively good proxy of functionings that require education: literacy, numeracy, andunderstanding of in<strong>for</strong>mation. Because the unit of analysis is the household, all household membersare considered non-deprived if at least one person has five years of schooling. This variable followsthe idea of effective literacy of Basu and Foster (1998) that all household members benefit from theabilities of a literate person in the household, regardless of each person’s actual level of education. Itis also linked to the idea of external capabilities (Foster and Handy, 2008).Similarly all household members are considered deprived if any of their school-age children are notattending grades 1 to 8 of school. Once again, school attendance does not capture completion,quality of schooling, or skills. But it is the best indicator possible to indicate whether or not schoolagedchildren are being exposed to a learning environment. Given the data restrictions, we considerit to be a sufficiently good proxy of educational functionings. The intuition of considering allhousehold members deprived if one or more children are not attending school relates to externaleffects. When a child is not in school, the household’s current and future knowledge and abilities arereduced. Note that households with no school-aged children are considered non-deprived. Henceincidence of deprivation in this indicator will reflect the demographic structure of the household andcountry as well as the educational attainments. Empirical studies suggest that this indicator providesdifferent and complementary in<strong>for</strong>mation to mean years of schooling (Santos et al, 2010).Furthermore, this indicator will be immediately sensitive to policy changes, whereas mean years ofschooling will change more slowly. Moreover the indicator of children attending school is justifiedby a number of distinct sources that have attained a high degree of consensus: the MDGs includeachieving universal primary education; ‘echoing’ the MDGs, UNESCO’s Education For All 2010report specifically analyzes possible solutions <strong>for</strong> making sure that no children are excluded fromschooling; and the Unsatisfied Basic Needs approach typically includes this indicator.Health was the most difficult dimension to measure. Comparable indicators of health <strong>for</strong> allhousehold members are generally missing from household surveys. Yet the capability to live a longand healthy life is a basic capability and is also the prerequisite <strong>for</strong> much of human development. Weuse two health indicators that, although related, depart significantly from standard health indicators.The first identifies a person as deprived in nutrition if anyone in their household is malnourished.Malnutrition is a direct indicator of functionings. For children, malnutrition can have life-longeffects in terms of cognitive and physical development. Adults or children who are malnourished arealso susceptible to other health disorders; they are less able to learn and to concentrate and may notper<strong>for</strong>m as well at work.This being said, malnutrition indicators (BMI <strong>for</strong> adults, weight <strong>for</strong> age <strong>for</strong> children) are imperfect;they do not reflect micronutrient deficiencies. Also, we do not consider the problem of obesity.Moreover, some people may appear to be technically malnourished who are not (due to body type)or their nutritional status may be not be due to poverty (it may be due to alimentary disorders orfashion norms or a recent illness <strong>for</strong> example).We wish to emphasise one key feature of our indicators on nutrition that might confuse the readerand which relates to the special construction of our measure. In the MPI all household members areconsidered to be deprived in nutrition if at least one undernourished person is observed in thewww.ophi.org.uk July 2010 14
<strong>Acute</strong> <strong>Multidimensional</strong> <strong>Poverty</strong>: A <strong>New</strong> <strong>Index</strong> <strong>for</strong> <strong>Developing</strong> CountriesAlkire & Santoshousehold. 17 There<strong>for</strong>e, it is fundamental to note that when we present deprivation rates by indicator(censored headcounts), these estimates depart from the standard nutritional statistics. The standard measuresrefer to the percentage of undernourished population (number of malnourished people divided bytotal set people under consideration, such as percentage of underweight children). In our measurethey refer to those identified as multidimensionally poor and who live in a household where at leastone member is undernourished (both the numerator and the denominator of our indicators aredifferent). Our estimate can be either higher or lower than the standard nutritional indicator becausea) it counts as deprived people who are not undernourished themselves but in a household wheresomebody else is; b) it depends on the distribution of malnutrition in the population and the size ofthe households with malnourishment; 18 and c) we consider as non-deprived people in householdswhere no one was measured. 19 Once again, note that although considering the household as the unitof analysis is not ideal, it is intuitive: the household experiences an external negative effect by thepresence of a malnourished person.The second indicator uses data on child mortality. The death of a child is a total health functioningfailure – one that is direct and tragic, and that influences the entire household. Most, although notall, child deaths are preventable, being caused by infectious disease or diarrhea; child malnutritionalso contributes to child death.This indicator is particularly problematic. It is a stock indicator, because the year of death of thechild is not recorded in most surveys – so the death could have happened many years ago. Howevergiven the absence of health functioning in<strong>for</strong>mation on household members, it provides at leastrudimentary in<strong>for</strong>mation on health functionings.In the MPI all household members are considered to be deprived if there has been at least oneobserved child death (of any age) in the household. 20 It is fundamental to note that this indicatordiffers from the standard mortality statistics. The standard under-five mortality rate is the number ofdeaths of children 0-5 years per 1000 children born alive. Here, it is the percentage of people17 Un<strong>for</strong>tunately the exact definition of the deprived in nutrition varies depending on the survey used: when we useDHS, it refers to child or women in reproductive age being undernourished; when we use MICS, the household isconsidered deprived if there is at least one undernourished child (this survey does not provide in<strong>for</strong>mation on adults’nutrition); when we use the WHS, the household is considered deprived when the respondent (either men or women,any age) is undernourished (this survey does not provide in<strong>for</strong>mation on children’s nutrition).There are two countryspecificsurveys used, in Argentina, and Mexico. In Argentina the indicator coincides with that used with DHS. In theMexican survey all household members were measured, so the household is deprived if there is any undernourishedmember.18 If the malnourished are concentrated in a few households and the size of these households is not excessively large, ourestimates will tend to be lower than the standard measure. On the other hand, if the malnourished are distributed oneperhousehold (as it could happen with a very unequal distribution of food resources within the household), ourestimates will tend to be higher than the standard measure.19 Given that the in<strong>for</strong>mation on nutrition was limited in each survey to a particular group, we have had to follow thisassumption. Otherwise we would have had to drop all households where no-one was measured, which would haveimplied a significant loss of in<strong>for</strong>mation and representativeness in the other indicators.20 The ‘eligible’ population <strong>for</strong> the mortality questionnaire varies slightly from one survey to the other, but on the basisof our analysis we think that – although not ideal – the comparison across the surveys is not unreasonable. In DHS, themortality data are obtained from women 15-49 and – in most countries – it is also obtained from men aged 15-59. InMICS it is obtained from all women 15-49 who are currently married or were married at some point. In WHS it isobtained from the respondent, when this is a woman between 18 and 52 years of age. In WHS we have also used a smallpart of the in<strong>for</strong>mation provided by the questionnaire on sibling’s death, which is obtained from all respondents. This isexplained in the Data section.www.ophi.org.uk July 2010 15
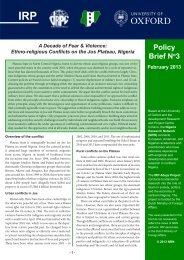
<strong>Acute</strong> <strong>Multidimensional</strong> <strong>Poverty</strong>: A <strong>New</strong> <strong>Index</strong> <strong>for</strong> <strong>Developing</strong> CountriesAlkire & Santosidentified as poor and who live in a household where at least a child died. Our estimate can be eitherhigher or lower than the mortality rate because a) it counts as deprived all people in households witha child death and not the actual children that died (both the numerator and the denominator aredifferent); b) it depends on the distribution of child mortality in the population and the size of thehouseholds with child mortality; 21 c) we consider as non-deprived households where no one wasinterviewed on mortality. 22 Once again, note that although considering the household as the unit ofanalysis is not ideal, it does have some intuitive meaning, because the household experiences anexternal negative effect by the death of a child.The MPI considers and weights standard of living indicators individually. It would also be veryimportant and feasible to combine the data instead into other comparable asset indices and exploredifferent weighting structures. The present measure uses six indicators which, in combination,arguably represent acute poverty. It includes three standard MDG indicators that are related tohealth, as well as to standard of living, and particularly affect women: clean drinking water,improved sanitation, and the use of clean cooking fuel. The justification <strong>for</strong> these indicators isadequately presented in the MDG literature. It also includes two non-MDG indicators: electricityand flooring material. Both of these provide some rudimentary indication of the quality of housing<strong>for</strong> the household. The final indicator covers the ownership of some consumer goods, each ofwhich has a literature surrounding them: radio, television, telephone, bicycle, motorbike, car,truck and refrigerator. We are aware that all the living standard indicators are means rather thanends; they are not direct measures of funtionings. Yet, they have two strengths. In the first place,unlike income, which can serve an incredibly wide range of purposes (and one never knows whetherit is used effectively to accomplish the needs considered to be basic), these are means very closelyconnected to the end (functioning) they are supposed to facilitate. Access to safe drinking waterserves directly to satisfy the need of hydration and hygiene (hygiene is also facilitated by the accessto improved sanitation and flooring material). Clean cooking fuel prevents respiratory diseases,which are a leading cause of preventable death, and contributes to a healthy home environment.Electricity is fundamental to pursue a number of activities. It allows lighting, which in turn allowspeople to be independent during the night time. Power also enables a wide range of work and leisureactivities ranging from refrigeration to drilling to blending, sewing, and so <strong>for</strong>th. Electricity is alsousually a safer means of lighting. And the set of considered assets are directly linked to the ability tocommunicate with other people, to be mobile, and even to have access to safe food. Secondly, mostof the indicators are related to the MDGs, which provides stronger grounds <strong>for</strong> their inclusion inour index.Of the ten indicators, all but one are relatively sensitive to policy change and measure ‘flow’, whichmeans they will reflect changes in-country with as little as one year between surveys. The exceptionto this is the stock indicator of child mortality. More direct measures of household healthfunctioning were simply not available. Other relatively stable indicators are years of schooling –which will be stable <strong>for</strong> many households who have no one in full-time education.21 If mortality is concentrated in a few households and the size of these households is not excessively large, our estimateswill tend to be lower than the standard measure. On the other hand if mortality is distributed one-per household, ourestimates will tend to be higher than the standard measure. For specific examples, please see the section on results.22 As explained by describing the eligible population <strong>for</strong> the mortality questionnaire in each survey (see footnote 22),many households in each survey were not asked the mortality questionnaire, and they are considered non-deprived inthis indicator. If we had restricted the in<strong>for</strong>mation only to households were the mortality questionnaire was asked, wewould have missed significant in<strong>for</strong>mation in the other indicators.www.ophi.org.uk July 2010 16
<strong>Acute</strong> <strong>Multidimensional</strong> <strong>Poverty</strong>: A <strong>New</strong> <strong>Index</strong> <strong>for</strong> <strong>Developing</strong> CountriesAlkire & SantosAs we said be<strong>for</strong>e, it would have been ideal to estimate the measure at the individual level. Measurescreated using individual level data have significant strengths: <strong>for</strong> example, they can be decomposedto compare poverty between men and women, and between different age groups. However, workingat the household level (a <strong>for</strong>ced choice given the availability of data 23 ) is not all counter-intuitive. Itallows <strong>for</strong> interaction, smoothing, and mutual sharing within the household regarding the differentindicators considered. We are aware that household size may affect results: large households aremore likely to be deprived in child school attendance, nutrition, and mortality simply because theyhave more people who are ‘eligible’ to report these deprivations. For better or worse, this may beless of a problem in practice than in theory, particularly <strong>for</strong> health deprivations, as data are rarelyavailable <strong>for</strong> all household members. However large households are less likely to be deprived inyears of schooling. In subsequent versions of this paper, we will present decompositions andcorrelations of poverty and household size to explore vigorously any potential biases.To capture the poverty differences between social and regional groups in Bolivia, Kenya, and India,we have decomposed the MPI by state and by ethnic group (see Appendix 3 on Decomposition). Wefind that large differences do emerge, so groups are clearly a key variable to consider in analyzing thecauses of and responses to multidimensional poverty. The MPI allows these group differences to beseen and studied in detail, in order to design effective policies. 242.4 Cutoffs <strong>for</strong> each IndicatorWe have chosen cutoffs <strong>for</strong> each indicator that are based to a large extent on international standardssuch as the Millennium Development Goals. Where no standard was possible, we consulted theliterature and also implemented multiple cutoffs to explore the sensitivity of the overall ranking tothem.The indicators and cutoffs are summarized in the figure below.Figure 3: Dimensions, indicators, cutoffs and weights of the MPIDimension Indicator Deprived if… Related to… RelativeWeightEducationYears of Schooling No household member has completed five years of schooling MDG2 16.7%Child School Any school-aged child is not attending school in years 1 to 8 MDG2 16.7%AttendanceMortality Any child has died in the family MDG4 16.7%Health Nutrition Any adult or child <strong>for</strong> whom there is nutritional in<strong>for</strong>mationis malnourished*MDG1 16.7%Electricity The household has no electricity 5.6%Sanitation The household´s sanitation facility is not improvedMDG7 5.6%(according to the MDG guidelines), or it is improved butshared with other householdsStandardof LivingWaterThe household does not have access to clean drinking water(according to the MDG guidelines) or clean water is morethan 30 minutes walking from home.MDG7MDG7Floor The household has dirt, sand or dung floor 5.6%Cooking Fuel The household cooks with dung, wood or charcoal. MDG7 5.6%AssetsThe household does not own more than one of: radio, TV,telephone, bike, motorbike or refrigerator, and does not owna car or truck.MDG7 5.6%Note: MDG1 is Eradicate Extreme <strong>Poverty</strong> and Hunger, MDG2 is Achieve Universal Primary Education, MDG4 is Reduce Child Mortality, MDG7 is Ensure EnvironmentalSustainability.* Adults are considered malnourished if their BMI is below 18.5. Children are considered malnourished if their z-score of weight-<strong>for</strong>-age is below minus twostandard deviations from the median of the reference population.23 Note that to compute the poverty measure at the individual level, we would have needed nutritional in<strong>for</strong>mation ofevery household member (and not just children/women/respondent – depending on the survey used). Analogously, wewould have needed in<strong>for</strong>mation on whether each adult experienced the death of a child.24 For example, Mexico’s national poverty measure highlighted the high poverty rates of indigenous people.5.6%www.ophi.org.uk July 2010 17
<strong>Acute</strong> <strong>Multidimensional</strong> <strong>Poverty</strong>: A <strong>New</strong> <strong>Index</strong> <strong>for</strong> <strong>Developing</strong> CountriesAlkire & Santos2.5 Indicator WeightsWeights can be applied in three ways in multidimensional poverty measures: i) between dimensions(the relative weight of health and education), ii) within dimensions (if more than one indicator isused), and iii) among people in the distribution, <strong>for</strong> example to give greater priority to the mostdisadvantaged.It is important to note that the choice of dimensions, of cutoffs, and of weights between dimensions isinterconnected. For example, dimensions might be chosen such that they were of relatively equalweight. This, indeed, is the recommendation given by Atkinson et al (2002) in their work on socialindicators in Europe: “the interpretation of the set of indicators is greatly eased where the individualcomponents have degrees of importance that, while not necessarily exactly equal, are not grosslydifferent.” 25 At the same time, in the MPI the standard of living has a higher effective weightbecause the deprivation headcounts tend to be higher than they are in health or education, soalthough the explicit weights are equal, in practice standard of living is weighted more highly.In the capability approach, because capabilities are of intrinsic value, the relative weights on differentcapabilities or dimensions that are used in society-wide measures are value judgments. Weights canrepresent1) the enduring importance of a capability relative to other capabilities or2) the priority of expanding one capability relative to others in the next phase.Weights may be set by a number of processes, such as participatory processes or expert opinion thatare in<strong>for</strong>med by public debate. Alternatively, weights may be drawn from survey questions such associally perceived necessities or interpreted using data on subjective evaluations. 26 The importantfeature to consider is that the weights are meant to represent a ‘reasoned consensus’ of the relevantcommunity.It is thus crucial to ask in any evaluative exercise of this kind how the weights are to beselected. This judgmental exercise can be resolved only through reasoned evaluation. …[I]narriving at an agreed range <strong>for</strong> social evaluations (e.g., in social studies of poverty), there hasto be some kind of a reasoned consensus on weights or at least on a range of weights. This isa social exercise and requires public discussion and a democratic understanding andacceptance (Sen 1996: 397).Empirically, the relative weights are influenced by the cutoffs, the normalization (if any) of thevariable, and the explicit weights. The MPI explicitly weights each dimension equally and eachindicator within the dimension equally. Equal weighting between the dimensions follows the HDIconvention, upon which a critical literature has developed (e.g., Chowdhury and Squire 2006), yetlargely substantiated this weighting structure. Equal weights <strong>for</strong> indicators within dimensions are notnecessary– <strong>for</strong> example HDI places a 2/3 weight on adult literacy and 1/3 on Gross Schoolattendance Ratio. In the case of health indicators, it seems that malnutrition and mortality are bothimportant deprivations and it is not clear which is the more important indicator. In the case of25 Atkinson, Cantillon, Marlier, Nolan and Vandenbroucke 2002, p 25.26 Papers from a May 2008 workshop on setting weights in the capability approach are available as working papers onwww.ophi.org.uk. For example Decanq and Lugo sketch the landscape of statistical and normative approaches toweighting; Fleurbaey and Schokkaert propose the use of subjective weights; Wright discusses the use of sociallyperceived questionnaires; and Dibben et al. discuss discrete choice experiments.www.ophi.org.uk July 2010 18
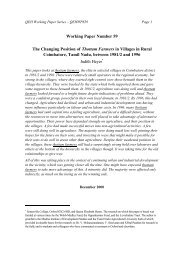
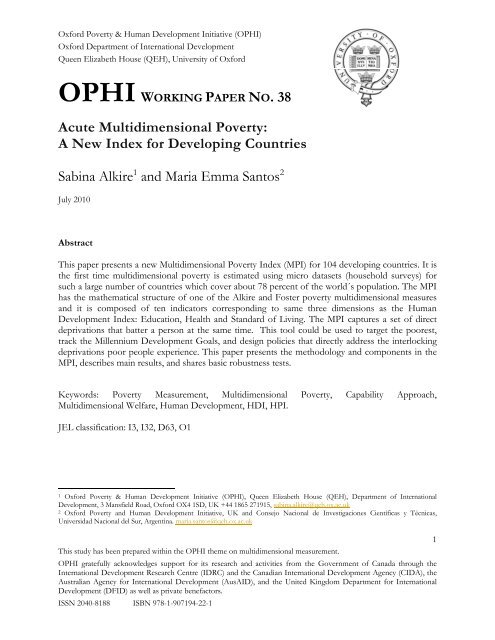
<strong>Acute</strong> <strong>Multidimensional</strong> <strong>Poverty</strong>: A <strong>New</strong> <strong>Index</strong> <strong>for</strong> <strong>Developing</strong> CountriesAlkire & Santoseducation, it could be argued that having one person with five or more years of schooling was themost important outcome; yet child school attendance is a time-sensitive input with long futurereturns, hence again we have weighted them equally. Weighting the six asset indicators equally isadmittedly more difficult to justify and is also particularly important given that this is the dimensionthat contributes most to poverty in the poorest countries. Further research on the best comparableasset measures that can be constructed from multiple datasets would be useful in the future. 272.6 <strong>Poverty</strong> cutoff kThe MPI reflects the number of deprivations a poor household experiences at the same time. Butwhat qualifies a household as being multidimensionally poor? One could consider a household aspoor if it were deprived in any of the ten indicators. Yet one deprivation may not represent poverty.For example, a household containing a slim fashion model or a grandfather who wants to cook onlyon a woodstove would have one MPI deprivation but perhaps should not be considered poor. Atthe other end of the extreme, one could require a household to be deprived in all ten indicators inorder to be considered poor. This, however, seems overly demanding; surely a household that hasmany but not all of these basic deprivations should be considered poor. The MPI requires ahousehold to be deprived in a few indicators at the same time. Concretely, we report two values ofthe MPI.The variable k reflects the sum of weighted indicators in which a household must be deprived inorder to be considered multidimensionally poor. Simply put, k is a policy variable that governs therange of simultaneous deprivations each poor household necessarily must have. As k goes up, thenumber of households who will be considered poor goes down, but the intensity or breadth ofdeprivations in any poor household goes up.We report two values <strong>for</strong> k: k = 3 and k = 2. When k = 3, a person has to be deprived in at least theequivalent of 30 percent of the weighted indicators (two to six indicators) in order to be consideredmultidimensionally poor. This amounts to six asset indicators or two health or education indicators.If we choose instead cutoff value k = 2 then all poor people must be deprived in at least 20 percentof the weighted indicators (two to four indicators).A person is multidimensionally poor if the weighted indicators in which he or she isdeprived sum up to 30 percent.Example: There are 10 indicators. Weight of Health = 3.33; Education = 3.33; and Standard ofLiving = 3.33 Any person whose deprived indicators’ weights sum to 3 or more is considered poor.Health and Education: 1.67 each (1/6 of 10)Standard of Living: 0.55 each (1/18 of 10)Poor if deprived in:* any 2 health/education indicators or* all 6 standard of living indicators or* 1 health/education indicator plus 3 standard of livingindicators.Consider Tabitha and her household, living in a Nairobi slum. 2827 Ferguson et al. 200328 This is a real case. Tabitha was interviewed as part of <strong>OPHI</strong>´s Ground Reality Check in Kenya.www.ophi.org.uk July 2010 19
<strong>Acute</strong> <strong>Multidimensional</strong> <strong>Poverty</strong>: A <strong>New</strong> <strong>Index</strong> <strong>for</strong> <strong>Developing</strong> CountriesAlkire & SantosFigure 4: Diagram of dimensions and indictors of the MPIThe diagram above shows the five indicators in which Tabitha is deprived. The height of theindicators corresponds to their weight. To identify whether Tabithais poor, we sum up the weightedindicators and see if they come up to the equivalent of 30 percent of indicators. In the right column,wesee that indeed Tabitha is deprived in over 30 percent of indicators and is thus multidimensionallypoor. Consider some other examples: 29Ana is deprived in nutrition and child school attendance. Is Ana multidimensionally poor?1.67 + 1.67 = 3.34 (> 3) YesAli is deprived in electricity, water, sanitation, and has a dirt floor. Is Ali multidimensionally poor?0.55+0.55+0.55+0.55= 2.20 (3) YesWe now turn to the data sources description and then to the results of the MPI.3. Data & Results3.1 Surveys usedThree main datasets were used to compute the MPI: the Demographic and Health Survey (DHShereafter), the Multiple Indicators Cluster Survey (MICS hereafter), and the World Health Survey(WHS hereafter). Ideally we would have liked to use the same dataset <strong>for</strong> all countries, but this wasnot possible as none of the mentioned surveys (or others) were per<strong>for</strong>med in a sufficiently highnumber of developing countries at a relatively recent point in time. However, the three surveys usedhave two primary advantages. In the first place, the countries implementing each of these surveysfollow standardized guidelines and receive technical assistance, in terms of the questionnaire,sampling procedure, and training of the enumerators, so that within each survey there is greaterhomogeneity and comparability than between other national multi-topic household surveys. Second,29 The particular weights on indicators vary <strong>for</strong> countries which do not have data on all of the ten indicators; this willaffect identification as well as aggregation. An example of the adjustments is given in the Results section.www.ophi.org.uk July 2010 20
<strong>Acute</strong> <strong>Multidimensional</strong> <strong>Poverty</strong>: A <strong>New</strong> <strong>Index</strong> <strong>for</strong> <strong>Developing</strong> CountriesAlkire & Santosthey are the only currently available surveys that contain relevant in<strong>for</strong>mation on health indicatorssuch as nutrition and mortality in an internationally comparable way. 30A second problem is that although we would have liked to estimate poverty <strong>for</strong> exactly the sameyear in all countries to enable a strict cross-country comparison, this was not possible given that thedifferent surveys have been per<strong>for</strong>med in different years in each country. We followed a combinedcriterion of using (a) the most recent available dataset <strong>for</strong> each country (never be<strong>for</strong>e the year 2000)and (b) whenever more than one survey dataset was available from the year 2000 onwards, weprivileged DHS over MICS, and MICS over WHS, because of data quality and indicator availability. 31The MEASURE DHS project started in 1984 and is funded mainly by the US Agency <strong>for</strong>International Development (USAID) and has conducted surveys in 84 countries. Over the years, thequestionnaires have had some changes in some variables and that is why there are different DHSPhases, Phase 1 (surveys carried out between 1984 and 1989) through Phase 6 (surveys between2008 and 2013). We used DHS datasets <strong>for</strong> 49 developing countries. All the DHS datasets used inthis study correspond to Phase 4 or higher. 32 This favors cross-country comparability in theindicators used <strong>for</strong> this study. Moreover, all the questions used to construct the ten indicators thatcompose the MPI were homogenized one-by-one, so as to have the same recoding of categories. 33The MICS is financially and technically supported by the United Nations Children´s Fund(UNICEF) and it is implemented in each country in collaboration with some government officesuch as the Statistical Institutes or the Ministry of Health. 34 The program started in the mid-1990s.Up to present, there have been three rounds of MICS: MICS 1 conducted in 1995 in about 65countries, MICS 2 was conducted in 2000 in about 65 countries, and MICS 3 was conducted in2005-06 in 50 countries. For this study we used MICS 2 or MICS 3 datasets <strong>for</strong> 35 developingcountries. 35 As with DHS datasets, all the questions used to construct the ten indicators thatcompose the MPI were homogenized <strong>for</strong> each country individually, so as to have the same recodingof categories.30 See Alkire and Eli (2010) <strong>for</strong> a discussion on bottlenecks of availability of internationally comparable indicators.31 For example, <strong>for</strong> Cameroon, Cote d´Ivoire, Guyana, and Malawi, the DHS datasets of either 2004 or 2005 areavailable, as well as the 2006 MICS dataset. We used the DHS datasets. There are a few exceptions to the mentionedrule. One is Nicaragua. For this country, we had DHS 2001 and 2006. Although we estimated the MPI <strong>for</strong> both years,we decided to use the estimates in 2001 (despite being older) because the dataset in 2006 lacks in<strong>for</strong>mation on mortality.We indicate the difference in the estimates in the section of Results. The second exception is Angola. Although weprefer DHS data over MICS, in the case of Angola we used MICS because DHS does not contain in<strong>for</strong>mation onnutrition and education <strong>for</strong> all household members (only <strong>for</strong> women and children). Third, although we prefer MICS dataover WHS data, <strong>for</strong> Chad we used WHS because the MICS dataset had a very high percentage of households withmissing data which produced an unacceptable sample size reduction.32 We use DHS 2008 (Phase 6) <strong>for</strong> three countries. We also use DHS 2007 <strong>for</strong> ten countries, DHS 2006 <strong>for</strong> ninecountries, DHS 2005 <strong>for</strong> twelve countries, DHS 2004 and DHS 2003 <strong>for</strong> six countries each; all the a<strong>for</strong>ementionedcorrespond to Phase 5. Finally, we use DHS 2002, DHS 2001, and DHS 2000 <strong>for</strong> one country each, which correspondto Phase 4.33 For example, when there were differences in country datasets, the type of toilet question was recoded to match ageneral standard coding. The same was done with type of drinking water source, cooking fuel, etc.34 It is common that other international and national agencies contribute to financing the implementation of DHS orMICS in each country. One example is the United Kingdom Department <strong>for</strong> International Development (DFID).35 We used MICS 2 <strong>for</strong> seven countries (six conducted the survey in 2000 and one in 2001) and MICS 3 <strong>for</strong> the other 28countries (eleven conducted the survey in 2005, sixteen in 2006 and one in 2007).www.ophi.org.uk July 2010 21
<strong>Acute</strong> <strong>Multidimensional</strong> <strong>Poverty</strong>: A <strong>New</strong> <strong>Index</strong> <strong>for</strong> <strong>Developing</strong> CountriesAlkire & SantosThe WHS was designed by the World Health Organization (WHO hereafter) and implemented <strong>for</strong>the first time in 2003 in 70 countries (both developing and developed) by different institutions ineach country with the technical assistance and guidance of WHO. We use WHS datasets <strong>for</strong> 19countries, all correspond to 2003.The three surveys´ datasets used to compute the MPI are nationally representative samples ofhouseholds. Two points are worth noting. First, in all surveys the samples are optimized with multistagestratified designs. Second, these surveys aim to provide accurate in<strong>for</strong>mation on certain healthindicators (such as fertility and child mortality). There<strong>for</strong>e, the sample design makes sure to selectenough number of cases from the relevant population to reduce the sampling error in suchindicators. Because of these two characteristics, when the sample is not self weighted, we used thesample weight provided in the datasets to calculate the poverty estimations. In this way we ensurethe actual national representativeness of the results. In the three surveys, the sample weights areadjusted by non-response. Not using the sample weights would produce bias towards the clusters orgroups of population that were oversampled according to the survey design.In addition to the three mentioned surveys, two country-specific surveys were also used: theEncuesta Nacional de Salud y Nutrición (ENSANUT hereafter) of Mexico, conducted in 2006, andthe Encuesta Nacional de Nutrición y Salud (ENNyS) of Argentina conducted in 2004-2005. 36 Noother survey with the required indicators was available <strong>for</strong> these two countries. ENSANUT has anationally representative sample of households and collects indicators that are comparable withthose in the other three surveys. However, un<strong>for</strong>tunately, ENNyS is the only survey we use that isnot nationally representative. First, it was conducted only in urban areas; second, the sample designand survey weights do not allow nationally representative estimates in urban areas. However, wekept these estimates as a lower bound estimate of acute multidimensional poverty in the urban areasof Argentina. 37We have estimated the MPI <strong>for</strong> a total of 104 developing countries where one of the mentionedsurveys with in<strong>for</strong>mation on the relevant indicators was available. Of the 104 countries, 24 are inCentral and Eastern Europe and the Commonwealth of Independent States (CIS), 11 are ArabStates, 18 countries are in Latin America and the Caribbean, 9 in East Asia and the Pacific, 5 inSouth Asia, and 37 countries in Sub-Saharan Africa. Overall they add up to a total population of 5.2billion people, which is about 78.4 percent of the total world population (using 2007 populationdata, HDR, 2009).3.2 Available in<strong>for</strong>mation in each surveyThe preference of DHS over MICS and of MICS over WHS is partly due to the availability ofindicators in each survey. In general, DHS contains more complete in<strong>for</strong>mation on the tenindicators. In what follows we briefly describe differences in the indicators across the differentsurveys by dimension.36 We also per<strong>for</strong>med estimations with two other country-specific surveys: the China Health and Nutrition Survey –Cross Section 2006 (CHNS) and the 2007 South Africa Community Survey (CS). However, in both cases we decided touse the WHS results <strong>for</strong> these countries. In the case of China, because the CHNS is not nationally representative – itonly covers nine provinces. In the case of South Africa, the CS lacks nutritional in<strong>for</strong>mation and the (women) samplesize of the mortality questionnaire to which we have access is too small (3000 observations out of a total of 900,000individuals).37 It is well known that rural areas in Argentina (which are not covered systematically by any survey), especially in thenorthern regions, are significantly poorer than urban ones.www.ophi.org.uk July 2010 22
<strong>Acute</strong> <strong>Multidimensional</strong> <strong>Poverty</strong>: A <strong>New</strong> <strong>Index</strong> <strong>for</strong> <strong>Developing</strong> CountriesAlkire & SantosNutritionDHS contains nutritional in<strong>for</strong>mation on women between 15 and 49 years (Body Mass <strong>Index</strong>, BMIhereafter) and on the under-5-year-old children of the household (weight and height). As explainedin Section 2, this allows constructing a composite indicator which considers a household to bedeprived (and there<strong>for</strong>e all its members) if there is either a woman or a child undernourished in thehousehold. MICS contains nutritional in<strong>for</strong>mation only on the under-5-year-old children of thehousehold whereas WHS provides nutritional in<strong>for</strong>mation only on the survey respondent, that is anyadult (18 years old and older), either male or female. There<strong>for</strong>e, <strong>for</strong> countries with these surveys, thenutritional indicator is determined only with the in<strong>for</strong>mation of one of the two components used incountries with DHS. ENSANUT provides nutritional in<strong>for</strong>mation on all household members, ofany age, whereas ENNyS provides nutritional in<strong>for</strong>mation on under-5-year-old children and womenof 10 to 49 years of age. There<strong>for</strong>e, both ENSANUT and ENNyS allow the construction of anindicator similar to the DHS (though ENSANUT includes males, and both include a wider agerange).As explained in Section 2, the nutritional indicator <strong>for</strong> children is the weight-<strong>for</strong>-age. A child isunderweight if he or she is two or more standard deviations below the median of the referencepopulation. This is one of the indicators proposed by the MDGs to track progress in Goal 1:Eradicate Extreme poverty and Hunger. As a robustness check we also per<strong>for</strong>med estimations withtwo other well-known nutritional indicators <strong>for</strong> children: weight-<strong>for</strong>-height and height-<strong>for</strong>-age. 38 Toguarantee strict comparability of the nutritional indicators <strong>for</strong> children across surveys, we estimatedthem in all cases (DHS, MICS, ENSANUT, and ENNyS) following the algorithm provided by theWHO Child Growth Standards. 39 This algorithm uses a reference population constructed by theWHO Multicentre Growth Reference Study (MGRS), which was implemented between 1997 and2003. The study involved 8,000 healthy children from Brazil, Ghana, India, Norway, Oman, and theUnited States, living under conditions likely to favor achievement of their full genetic growthpotential. The study was purposely designed to produce a standard rather than a reference. Itthere<strong>for</strong>e provides a solid foundation to determine abnormal growth 4038 “The weight-<strong>for</strong>-age indicator reflects body mass relative to chronological age and is influenced by both the height ofthe child (height-<strong>for</strong>-age) and weight-<strong>for</strong>-height. Its composite nature makes interpretation complex. For example,weight <strong>for</strong> age fails to distinguish between short children of adequate body weight and tall, thin children. Low height <strong>for</strong>age or stunting, defined as minus two standard deviations from the median height <strong>for</strong> the age of the referencepopulation, measures the cumulative deficient growth associated with long-term factors, including chronic insufficientdaily protein intake. Low weight <strong>for</strong> height or wasting, defined as below minus 2 standard deviations from the medianweight <strong>for</strong> height of the reference population, indicates, in most cases, a recent and severe process of weight loss, oftenassociated with acute starvation or severe disease. When possible, all three indicators should be analysed and presentedsince they measure and reflect different aspects of child malnutrition.” (United Nations, 2003). The effect of usingdifferent nutritional indicators is further discussed in the Section 4.7.39 http://www.who.int/childgrowth/software/en/40 DHS and MICS provide the children´s nutrition z-scores as already computed variables. However, these computationsare based on the National Center <strong>for</strong> Health Statistics (NCHS)/WHO growth reference that had been recommended <strong>for</strong>international use since the late 1970s (WHO, 1995). “The limitations of the NCHS/WHO reference have beendocumented (WHO Working Group on Infant Growth, 1994; de Onis and Yip, 1996; de Onis and Habicht, 1996). Thedata used to construct this reference covering birth to three years of age came from a longitudinal study of children ofEuropean ancestry from a single community in the USA. These children were measured every three months, which isinadequate to describe the rapid and changing rate of growth in early infancy. Also, the statistical methods available atthe time the NCHS/WHO growth curves were constructed were too limited to correctly model the pattern andvariability of growth. As a result, the NCHS/WHO curves do not adequately represent early childhood growth” (WHOMulticentre Growth Reference Study Group 2006 report, Chapter 1, p. 1). There<strong>for</strong>e, now the WHO recommends usingwww.ophi.org.uk July 2010 23
<strong>Acute</strong> <strong>Multidimensional</strong> <strong>Poverty</strong>: A <strong>New</strong> <strong>Index</strong> <strong>for</strong> <strong>Developing</strong> CountriesAlkire & SantosMortalityIn terms of the mortality indicator, in DHS and WHS there is a general question on mortality (nonagespecific), as well as a birth history that collects in<strong>for</strong>mation on the age at death, allowing theconstruction of the age-specific indicators. In MICS, ENSANUT, and ENNyS there is only ageneral question on mortality (non-age specific). There are three exceptions to this in MICS:Somalia, Yemen, and Iraq also contain birth histories, which would allow the construction of theage-specific mortality indicator. To guarantee comparability across surveys, we use a non-age specificindicator of mortality. A household (and there<strong>for</strong>e all its members) is considered deprived if therehas been a child death, no matter the age. 41Years of educationDHS contains in<strong>for</strong>mation on the years of education <strong>for</strong> each household member. In MICS we hadto build it from two questions: highest educational level achieved and highest grade completed inthat level, considering the duration of each educational level in each country. 42 We are aware thatthere is measurement error in this variable. However, we think this does not have a significantimpact on the MPI indicator, as this only requires determining whether each household member hasfive years of education or not, regardless of how many exact years he/she has completed.In WHS, there is in<strong>for</strong>mation on the number of years of education completed by the respondent.For other household members there is only in<strong>for</strong>mation on the accomplished level. We considerthat at least someone in the household has completed five years of education if: (a) any householdmember has completed secondary school or more, or (b) the respondent has completed five years ofeducation or more, or (c) the maximum level of education of the household is incomplete orcomplete primary and the median number of years of education of all respondents with thateducational level is five or more.In ENSANUT, the variable was constructed as it was in MICS. Finally, in ENNyS there is onlyin<strong>for</strong>mation on the educational attainment of the household head and the respondent (who is eithera woman 10-49 or a child who is measured), so the household is considered non-deprived ineducation if either the household head or the respondent have completed five years of education.Child School AttendanceIn DHS, the school attendance question draws on one of two questions: 1) whether the child iscurrently attending school or 2) whether he or she attended school in the previous year. Whichquestion was implemented varies by country. To construct the indicator of child school attendance,we have adjusted the age to each question. 43 In MICS, ENSANUT, and ENNyS the variable refersto whether the child is currently attending school. In WHS – quite un<strong>for</strong>tunately – there is nothe MGRS reference population. We have computed the MPI using both reference populations and have records of thedifference. This is discussed in the section on Results.41 For a robustness check, we computed an alternative measure using the under-5-years-of-age mortality indicator <strong>for</strong>those countries in which this is available. We comment on this in Section 4.7.42 The duration of each level in each country was taken from United Nations Educational, Scientific and CulturalOrganization (UNESCO) Institute <strong>for</strong> Statistics database, Table 1. “Education systems”http://stats.uis.unesco.org/unesco/TableViewer/tableView.aspx?ReportId=163). Given that UNESCO determines theduration according to the International Standard Classification of Education, this in<strong>for</strong>mation was contrasted with eachdataset and country-specific in<strong>for</strong>mation and adjusted whenever necessary.43 For example, if the schooling age is 6-14 years old and the question refers to the previous year, this applies to children7-15; if it refers to current year then it applies to age 6-14. In<strong>for</strong>mation on the age at which children start school in eachcountry was taken from UNESCO, Institute <strong>for</strong> Statistics database.www.ophi.org.uk July 2010 24
<strong>Acute</strong> <strong>Multidimensional</strong> <strong>Poverty</strong>: A <strong>New</strong> <strong>Index</strong> <strong>for</strong> <strong>Developing</strong> CountriesAlkire & Santosin<strong>for</strong>mation on whether the child is attending school or not. So we have not been able toincorporate that indicator in the 19 countries <strong>for</strong> which we use that survey and there<strong>for</strong>e the years ofeducation indicator receives full-weight.Living StandardAll the living standard variables were recoded homogeneously across surveys. However, a fewdifferences are worth noting. For the drinking water indicator, we also consider the time to the watersource. The in<strong>for</strong>mation of time-to-water is available in most DHS countries and in all MICS andWHS countries, 44 but it is not available in ENNyS (Argentina) and ENSANUT (Mexico). However,distance to a water source is not a serious problem in these two countries (except possibly <strong>for</strong> someremote rural areas).For the sanitation indicator, we consider the household deprived if, despite having access toimproved sanitation, the toilet is shared. In most DHS countries, all MICS countries, and all WHScountries, we have in<strong>for</strong>mation on whether the household shares the sanitation facility. InENSANUT, the question is applicable only <strong>for</strong> those who have latrines (who are considereddeprived anyway as there was no specification on whether these where improved or not). InENNyS, the in<strong>for</strong>mation on whether the sanitation is shared or not is not available, but presumablythis is not a major concern in this country. In Colombia, the in<strong>for</strong>mation on shared sanitationseemed inaccurate, so despite being available we decided not to incorporate it in the indicator.In<strong>for</strong>mation on electricity was available in most of the countries across all surveys; however, in thecases in which this was not available, we have checked whether the country had a coverage of 95percent or higher and if so, we have assumed that no one is deprived in electricity. This has been thecase <strong>for</strong> Albania, the Czech Republic, Croatia, Estonia, Hungary, Latvia, Mauritius, Russia, Slovenia,Slovakia, Brazil, China, Ecuador, the United Arab Emirates, and Uruguay. 45The assets indicator considers small assets as TVs, radios, telephones (landline or mobile),refrigerators, motorcycles, and big assets as cars or trucks. We require the household to have a car orany two of the other assets to be considered non-deprived. In most DHS and MICS countries, aswell as in ENSANUT, we can count all of them. In WHS countries, we cannot track radios andmotorbikes. In ENNyS, only refrigerators and telephones are counted, but given that we know thatmost people do have a radio and TV (even in the slums), we have required the household to haveonly one of these (refrigerator or telephone) to be considered non-deprived.Overall, 63 of the 104 countries have all the ten indicators. Thirty countries lack one indicator: areWHS countries which lack child school attendance only; four countries lack mortality, eightcountries lack nutritional in<strong>for</strong>mation, and five lack one living standard. Eight countries lack twoindicators: four of them are WHS countries that lack child school attendance and mortality; one is aWHS country that lacks child school attendance and electricity; and three are DHS countries that44 The DHS countries <strong>for</strong> which we do not have any in<strong>for</strong>mation on the variable time-to-water are Cambodia, Coted’Ivoire, Guyana, Jordan, Moldova, and Morocco.45 The in<strong>for</strong>mation on electricity coverage was taken from the section “Electrification rate in 2008” in the World EnergyOutlook 2009. Countries in which in<strong>for</strong>mation on electricity was not available and no assumption was made (becausein<strong>for</strong>mation indicated that there was less than 95 percent coverage) are: Honduras (DHS), Suriname, Myanmar (MICS)and South Africa (WHS).www.ophi.org.uk July 2010 25
<strong>Acute</strong> <strong>Multidimensional</strong> <strong>Poverty</strong>: A <strong>New</strong> <strong>Index</strong> <strong>for</strong> <strong>Developing</strong> CountriesAlkire & Santoslack nutrition and cooking fuel. Finally, three countries lack three variables. 46 In all these cases, theindicators´ weights are adjusted to add up to 100 percent. 47We are aware that data limitations affect cross-country comparability in several different ways: weuse different surveys that have differences in the definition of some indicators such as nutrition, weuse different years, and 40 percent of the countries lack some indicator (<strong>for</strong>tunately the greatmajority lacks only one). There<strong>for</strong>e, the value added of this study is not in determining the relativeposition of each country in a ‘poverty ranking’ but rather in a) providing a more comprehensive andaccurate picture of the world´s acute deprivations (note that this is the first ef<strong>for</strong>t in estimatingmultidimensional poverty <strong>for</strong> the developing world), b) providing a poverty estimate in each of the104 countries using all the available in<strong>for</strong>mation with respect to three core dimensions of humandevelopment, and c) demonstrating a methodology that can be adapted to national or regionalsettings having more and better data.3.3 Treatment of households with non-applicable populationIdeally, the MPI would reflect the same achievements <strong>for</strong> each person in the sample. However suchan index would exclude all in<strong>for</strong>mation about child poverty, because not every household has a childmember. Furthermore, due to the data availability, such an index would exclude health variables.Given the importance of children and of health, the MPI includes three indicators that are notapplicable to all households. While this affects the final measure, we feel it makes the measure moreaccurate than the alternative. Further, a household made up of men only (<strong>for</strong> example) can still beidentified as poor if it is deprived in sufficient living standard and mean years of schoolingindicators.The three indicators that are not applicable to all the population are as follows: child schoolattendance is non-applicable <strong>for</strong> households with no children of school age; nutrition is nonapplicable<strong>for</strong> households that have no under-five-year-old children and no women aged 15-49(DHS) and <strong>for</strong> households that have no under-five-year-old children (MICS). Finally, the mortalityindicator is non-applicable <strong>for</strong> households that do not have females of reproductive age and nomales in the case of DHS, and no females in reproductive age in the case of MICS and WHS. 48 In all46 The thirteen WHS countries that lack child school attendance are: Chad, China, Ecuador, Estonia, Guatemala,Paraguay, Russia, Slovakia, Slovenia, Sri Lanka, Tunisia, the United Arab Emirates, and Uruguay. The five countries thatlack mortality are: Bosnia and Herzegovina, Lao, Montenegro and Kyrgyzstan. Serbia had in<strong>for</strong>mation on mortality butdue to a high number of missing values in this variable, we could not use it. So this indicator was not considered <strong>for</strong>Serbia. The eight countries that lack nutrition are: Burundi, Guyana, Indonesia, Pakistan, Tanzania, Trinidad andTobago, Ukraine and Yemen. The four countries that lack one living standard variable are: Egypt and Turkey, lackingcooking fuel, Honduras (lacking electricity) and Central African Republic, lacking floor. The four WHS countries thatlack school attendance and mortality are Brazil, Croatia, the Czech Republic, and Hungary; South Africa lacks schoolattendance and electricity. The three DHS countries that lack nutrition and cooking fuel are Cote d´Ivoire, Philippines,and Viet Nam. Finally, Latvia (WHS) lacks child school attendance, mortality, and cooking fuel; Myanmar (MICS) lacksmortality, electricity, and cooking fuel; and Suriname (MICS) lacks electricity, cooking fuel, and assets.47 The indicators´ weight is calculated as Total number of indicators/(3*Number of Indicators in the correspondingdimension). Then, if <strong>for</strong> example, there is only one missing indicator in either the education or the health dimension, thenon-missing indicator receives a weight of 9/3; if the missing indicator corresponds to the living standard dimension, theremaining five indicators receive a weight of 9/15. We did not estimate the MPI <strong>for</strong> countries that lacked all indicatorswithin a dimension.48 DHS and MICS interview all females 15-49 year in the household. DHS also interviews males 15-59 usually, althoughthe upper limit varies in some countries. In WHS, the mortality in<strong>for</strong>mation comes from two questionnaires: one is onthe respondent’s children’s mortality, which is applicable only to female respondents of reproductive (18-49 years) age,the other is a set of questions on the mortality of siblings, which is applicable to all respondents. We have used only partwww.ophi.org.uk July 2010 26
<strong>Acute</strong> <strong>Multidimensional</strong> <strong>Poverty</strong>: A <strong>New</strong> <strong>Index</strong> <strong>for</strong> <strong>Developing</strong> CountriesAlkire & Santoscases, the procedure followed is to consider as non-deprived in each indicator the households thatdo not have the relevant eligible population <strong>for</strong> the questions regarding the mentioned indicators.However, households with applicable population that had missing values are considered as withmissing in<strong>for</strong>mation and are there<strong>for</strong>e excluded from the sample.3.4 Treatment of missing data and sample sizesMissing values are a common problem of household surveys. Whenever a household had missingin<strong>for</strong>mation <strong>for</strong> all its members in an indicator, it was excluded from the computation. However, ifthere was missing in<strong>for</strong>mation <strong>for</strong> only some of its members, we have used the available in<strong>for</strong>mationas much as possible. Specifically, we proceeded as follows.For the indicator on years of education, if we observe at least one member with five or more yearsof education then, regardless of the number of other members with missing data, we classify thehousehold as non-deprived. If more than 1/3 of the household members have missing in<strong>for</strong>mationon years of education, and the people <strong>for</strong> which we observe the years of education have less thanfive years, the household is given a missing value in this indicator. If we have in<strong>for</strong>mation of 2/3 (ormore) of household members, and these report less than five years of education, the household willbe classified as deprived. For the child school attendance indicator, if all school-aged children in ahousehold have missing in<strong>for</strong>mation in school attendance, that value is considered missing. As longas we have in<strong>for</strong>mation <strong>for</strong> one of the children in the household, the household will be classified asnon-deprived or deprived depending on whether that child is reported to be attending school or not.For the nutritional indicator, in DHS countries, if nutritional in<strong>for</strong>mation <strong>for</strong> women and children inthe household was missing and these were households with applicable members (that is withchildren and/or women), we consider the household as missing this indicator. Otherwise, we usedthe available in<strong>for</strong>mation. Similarly, <strong>for</strong> child mortality, households that had applicable memberswho did not respond to the mortality question are considered to be missing this in<strong>for</strong>mation;otherwise the household is considered non-deprived.There are six living standard variables: water, electricity, toilet, cooking fuel, floor, and an assetsindicator. Whenever the household had missing in<strong>for</strong>mation on water, electricity, toilet, cooking fuelor flooring, this household is excluded from the computation of the poverty measure. The assetsindicator considers a household as non-deprived if it has more than one of any of these items: TV,radio, telephone, refrigerator, motorcycle, and bicycle or if it has a car or truck. If there are any ofthese missing, then we assume that the household does not have this asset. The indicator takes amissing value only if there is missing in<strong>for</strong>mation <strong>for</strong> all the seven assets.Following the described procedure, we have a small percentage of sample reductions <strong>for</strong> most of thecountries. Eighty-five countries have a sample size of 87 percent or higher of the original sample,nine have a sample size of between 77 and 85 percent of the original sample and only ten countrieshave a sample of 56 to 75 percent of the original sample (see Appendix 2). For the 19 countries withof the in<strong>for</strong>mation of this second questionnaire: the one provided by respondents of 25 years of age or younger withsiblings dying younger than the age of 15. In this way, we are quite certain that this sibling mortality in<strong>for</strong>mation refers toa person who was a household member (assuming that people can stay in their households up to the age of 25).Households that had a male respondent older than 25 years of age are non-eligible <strong>for</strong> either of the mortality questionsand are there<strong>for</strong>e considered non-deprived in this indicator.www.ophi.org.uk July 2010 27
<strong>Acute</strong> <strong>Multidimensional</strong> <strong>Poverty</strong>: A <strong>New</strong> <strong>Index</strong> <strong>for</strong> <strong>Developing</strong> CountriesAlkire & Santossample sizes lower than 87 percent of the original sample we have per<strong>for</strong>med a bias analysis. Foreach of the variables that have a high percentage of missing observations (typically the nutritionindicator), we have compared the percent of deprived population in each of the other indicators inthe group with missing values in the indicator under analysis with that of the group with observedvalues in the indicator under analysis. We comment on the conclusions of this analysis in the sectionon Results.4. RESULTSAppendix 1 presents the estimation results. The same results are presented in two differentgroupings of countries. Tables 1.1 to 1.3 present the countries ordered by their MPI estimate, fromlowest to highest, that is, from the least poor to the poorest. As detailed in Section 3.2, not all theindicators were available <strong>for</strong> all the countries in the sample, and years and surveys vary from onecountry to the other. There<strong>for</strong>e, cross country comparison of MPI should be made with caution.Tables 1.4 to 1.6 present the countries grouped by the UN regions. Tables 1.1 and 1.4 present theestimates of the MPI, the rank value, and the MPI components H (headcount, or incidence) and A(average breadth, or intensity). These tables also contains some key comparison data, namely theproportion of people that live on less than $1.25/day and on less than $2 a day (and the countryrankings by these income poverty measures), as well as the proportion of people under the nationalpoverty line. We also report the 2009 Human <strong>Poverty</strong> <strong>Index</strong> and Human Development <strong>Index</strong>estimates. In Table 1.1 we additionally present the GDP growth rate, GDP per capita and GiniCoefficient, whereas in Table 1.4 we additionally present the estimated number of people MPI poorand income poor. Finally, we provide the population figures in each country according to the 2007estimations.Tables 1.2 and 1.5 present the so-called censored headcounts. These reflect the percentage of peoplewho are poor and deprived in each indicator. These differ from traditional headcounts in two ways.In the first place, they are the proportion of population that are poor (i.e., deprived in somecombination of two to six indicators) and deprived in each indicator. Note that some people mightbe deprived in that particular indicator but not deprived in enough indicators to be considered poor;they are not included in these headcounts (<strong>for</strong> example, someone may cook using a wood fire butotherwise be healthy, wealthy, and well educated). Second, the headcounts refer to the percentage ofpeople who live in households that are affected by a particular deprivation. For example, asexplained in Section 2, if any person in a household is malnourished, the household is considereddeprived in nutrition – every member is a person who lives in a household that is affected bymalnutrition. Thus, both the numerator and the denominator of our statistic differ from well-knownheadcounts of malnutrition itself – the percentage of people who are themselves deprived. 49 Thesetwo differences from traditional headcounts must be highlighted to prevent mis-interpretation ofour results.Looking at the traditional headcounts in each dimension does not in<strong>for</strong>m whether the peopledeprived in one indicator are also deprived in some other indicator, that is, we cannot know whetherthey experience coupled deprivations. By identifying those with multiple simultaneous deprivations,49 It is worth re-emphasizing that as a consequence of the two mentioned differences between our censored headcountsand the traditional ones, the headcounts on nutrition, mortality, education, and school attendance should not becompared with standard measures of these variables reported elsewhere by different organizationswww.ophi.org.uk July 2010 28
<strong>Acute</strong> <strong>Multidimensional</strong> <strong>Poverty</strong>: A <strong>New</strong> <strong>Index</strong> <strong>for</strong> <strong>Developing</strong> CountriesAlkire & Santosone can prioritize the poorest poor and provide the basis <strong>for</strong> further policy analysis that may findeffective ways of reducing deprivation in one indicator by improving some other.Tables 1.3 and 1.6 provide the dimensional contributions of each country to its overall poverty.These are three percentages, adding horizontally to 100, of the relative contribution of eachdimension to that country’s poverty. This reveals whether the MPI measures are more influenced byeducation, health, or standard of living indicators in that country. It is worth noting that thesecontributions should not be disassociated from the MPI estimate. For example, in the Belarusdeprivation in education contributes 16.6 percent of overall multidimensional poverty, deprivation inthe health dimension 61.6 percent, and deprivation in the living standard 21.7 percent. However, theMPI in Belarus is 0.00008, and the multidimensional headcount, as well as all the censoredheadcounts, are below 1 percent, so multidimensional poverty is essentially zero in this country andthere<strong>for</strong>e the contributions have little meaning in this case. However, the contributions bydimension can prove useful in cases where there is poverty. This is exemplified below. The othernote of caution is that across countries the discerning reader will note that deprivation in ‘livingstandard’ generally contributes more to MPI than deprivations in health or education. To someextent, this is due to the implicit higher weight of that dimension. While all dimensions explicitlyhave equal weights, the effective weight of each dimension also depends upon the dimensionalcutoffs and resulting headcounts of poor people. The standard of living variables have a greaterincidence of deprivation overall than health or education, hence their implicit weight is greater than33 percent.Tables 1.7 presents the MPI, H and A using a k cutoff value of 2, that is, requiring the poor to bedeprived in 20 percent of the weighted indicators to be considered multidimensionally poor. Table1.8 presents the censored headcounts and contributions by dimension associated to the MPI withthis alternative cross-dimensional cutoff.Table 1.9 provides some complementary in<strong>for</strong>mation in the <strong>for</strong>m of the raw headcounts bydimension. It provides the proportion of the population deprived in at least one of the twoeducation indicators, the proportion of the population deprived in at least one of the two healthindicators, and the proportion of the population deprived in three or more of the living standardindicators. These headcounts provide an overall impression of the incidence of deprivation in eachdimension, but they are a rough guide only. For an accurate overview of the structure ofdeprivations readers are referred to Tables 2.A and B, which provide the actual censored headcountsof each of the ten indicators.Finally, Tables 2.1 and 2.2 in Appendix 2 present the sample sizes of each country and percent ofmissing in<strong>for</strong>mation in each indicator. Another clarification is worth noting. As explained in theData Section, some countries have important sample reductions due to missing values in one ormore variables (typically nutrition). For those countries we have compared the percent of deprivedpopulation in each of the other indicators in the group with missing values in the indicator underanalysis with that of the group with observed values in the indicator under analysis, per<strong>for</strong>minghypothesis tests of difference in means. From that analysis we conclude that the poverty estimates ofSouth Africa, Guatemala, Sri Lanka, Tunisia, Latvia, the Russian Federation, Mauritania, andMyanmar should be interpreted as lower bound estimates – meaning that multidimensional povertyis at least as great as their MPI value indicates. Pakistan’s MPI value should also be considered as alower bound as there was no in<strong>for</strong>mation on nutrition in the survey and it is well known thatmalnutrition has a high incidence in that country and it is associated with poverty. On the otherwww.ophi.org.uk July 2010 29
<strong>Acute</strong> <strong>Multidimensional</strong> <strong>Poverty</strong>: A <strong>New</strong> <strong>Index</strong> <strong>for</strong> <strong>Developing</strong> CountriesAlkire & Santoshand, the poverty estimates of Sao Tome and Principe, Gabon, Comoros, Slovenia, Syria, andSlovakia should be interpreted as upper bound estimates – meaning that multidimensional poverty isless than or equal to their MPI values. For the United Arab Emirates, Ecuador, Jordan, Chad, andColombia, despite the fact that they also had some significant sample reduction, we did not findevidence of under or over-estimationThe following sections highlight the salient results from our estimation and analysis. Please note thatthere is still ongoing work and analysis which will be incorporated into subsequent versions of thispaper.4.1 Who is poor? Global OverviewBelow we present a number of the interesting and thought-provoking MPI results. Some resultsexplore its comparative advantage in relation to income poverty; some illustrate the insights thatarise from the novel aspect of ‘intensity’; some simply describe its distribution across countries. Wealso per<strong>for</strong>m some basic robustness tests and more detailed country analyses such asdecompositions by dimension, region, and ethnicity; trends across time; and individual comparisonsbetween income- and MPI-poor people.4.1.1 The MPI headcounts fall between $1.25 and $2.00/day headcounts. The present resultscover 104 countries, which are home to 5,230 million or 5.2 billion people. Of these, 1,659 million(close to 1.7 billion) are poor according to the MPI. 50 For example, they could live in householdsthat have a member who is undernourished and no member has five years of education. Or theymight live in a household that has experienced a child death and is deprived in at least three livingstandard indicators (sanitation, water, cooking fuel, electricity, floor, and assets). Or they could livein a household that is deprived in three living standard indicators and in which there are school-agedchildren not attending school. According to the MPI, 32 percent of the total population in these 104countries is poor. This figure lies between the total number of people living on less than $ 1.25/day,which is 1,3789 million people (26 percent), and the total number of people living with less than$2/day, which is 2,525 million people (48 percent). 514.1.2 The MPI is measuring services and outcomes directly, so differs from income poverty.Although the global headcount is between $1.25/day and $2.00/day headcounts, the MPI is not a$1.50/day poverty line. Figure 5 presents our estimates <strong>for</strong> the 93 countries <strong>for</strong> which we haveincome poverty in<strong>for</strong>mation. The figure shows that acute multidimensional poverty complementsincome poverty. The zig-zag black line presents the income poverty headcount <strong>for</strong> each countrywhile the bar shows the multidimensional poverty headcount. The MPI headcount of poor personsis higher than the $2/day headcount in 24 countries and lower than $1.25/day headcount in 36others. There are several reasons <strong>for</strong> the observed divergence. In some cases, income data are weak50 Population figures correspond to 2007. This assumes that the poverty rates in the year of the most recent survey(which goes back as far as 2000) are an adequate reflection of poverty today. As none of these surveys post-date themore recent economic crisis, these may well be under-estimates. Note that if 2010 population figures are used, the totalnumber of MPI poor people is 1.75 billion.51 Note that the figures <strong>for</strong> the income poverty estimates exclude the following 14 countries <strong>for</strong> which this in<strong>for</strong>mationis not available: Czech Republic, Guyana, Namibia, Slovakia, Suriname, Trinidad and Tobago, the United Arab Emirates,the Occupied Palestinian Territories, Syria, Belize, Iraq, Myanmar, Zimbabwe, and Somalia. The total number ofmultidimensionally poor excluding these countries is 1,633 million, which still lies in-between the two income povertyestimates. If 2010 population figures are used, the total number of $ 1.25/day poor is about 1.44 billion, whereas thetotal number of $2/day is about 2.6 billion.www.ophi.org.uk July 2010 30
<strong>Acute</strong> <strong>Multidimensional</strong> <strong>Poverty</strong>: A <strong>New</strong> <strong>Index</strong> <strong>for</strong> <strong>Developing</strong> CountriesAlkire & Santosor known to be inaccurate; the MPI is more direct and may be more accurate. In other cases, theMPI incorporates key services such as water and sanitation, electricity, primary education, andhousing which are not consistently captured in all income/consumption surveys. Where they arenot, the MPI is measuring a related but different underlying phenomenon than income poverty.Finally, different people may have differing abilities to convert income into nutritional oreducational gains. For example, a household with a disabled member may be non-income poor butwww.ophi.org.uk July 2010 31
<strong>Acute</strong> <strong>Multidimensional</strong> <strong>Poverty</strong>: A <strong>New</strong> <strong>Index</strong> <strong>for</strong> <strong>Developing</strong> Countries Alkire & SantosFigure 5: Ranking of 93 countries by MPI compared to Income <strong>Poverty</strong>1.000.900.800.700.600.500.400.300.200.100.00NigerEthiopiaMaliCentral African RepublicBurundiLiberiaBurkina FasoGuineaSierra LeoneRwandaMozambiqueAngolaComorosDR CongoMalawiBeninMadagascarSenegalTanzaniaNepalZambiaNigeriaChadMauritaniaGambiaKenyaBangladeshHaitiRepublic of CongoIndiaCameroonTogoCambodiaYemenCote d'IvoireSao Tome and PrincipePakistanLesothoLaoSwazilandNicaraguaBoliviaGabonHondurasGhanaDjiboutiMoroccoGuatemalaIndonesiaPeruTajikistanMongoliaViet NamParaguayPhilippinesChinaDominican RepublicColombiaBrazilTurkeyEstoniaEgyptAzerbaijanSri LankaKyrgyzstanMexicoSouth AfricaArgentinaTunisiaJordanUzbekistanArmeniaEcuadorMoldovaUkraineMacedoniaUruguayThailandCroatiaMontenegroRussian FederationAlbaniaSerbiaBosnia and HerzegovinaGeorgiaHungaryKazakhstanLatviaBelarusSloveniaProportion of Poor PeopleContribution education Contribution health Contribution living standards $1.25 a day poorwww.ophi.org.uk July 2010 32
<strong>Acute</strong> <strong>Multidimensional</strong> <strong>Poverty</strong>: A <strong>New</strong> <strong>Index</strong> <strong>for</strong> <strong>Developing</strong> CountriesAlkire & Santosstill significantly deprived. It is important to note that although a significant fraction of the MPIpoor may overlap with the group of $1.25/day poor, the two groups need not perfectly coincidesince the MPI identifies people with coupled deprivations.4.1.3 Rural Areas contain about five times more MPI poor people than urban onesOf the total 1659 million MPI poor people, about 1388 million live in rural areas. The pattern ofhigher incidence and intensity of poverty in rural areas than in urban ones is consistent across thedifferent regions in the developing world. This is combined with the fact that 61 of the 104 studiedcountries have over half of their population living in rural areas, including populous countries suchas China and India. Thus those in acute poverty are mostly concentrated in rural areas.4.1.4 South Asia is home to nearly twice as many multidimensionally poor people as the nextpoorest-region, Africa. Figure 6 presents the regional distribution of the total considered world´spopulation in this study (in the pie chart on the left) and the regional distribution of the number ofpeople who are multidimensionally poor in each region. Two contrasts are worth noting: (1) there isa huge unbalance between the population contribution of each region and the proportion of pooreach region has. South Asia contributes 29.5 percent of the total considered population, yet it ishome to 51 percent of the world’s poor and (2) South Asia is home to 1.8 times the total poorpopulation of Sub-Saharan Africa and three times the total poor population of East Asia and thePacific, the third poorest region in the world.Figure 6: Distribution of the MPI poor vs. total populationPopulation of 104 countries by region(millions)Arab States217.54%Sub-Saharan Africa710.413.6%South Asia1543.929.5%East Asia and thePacific1867.735.7%Central andEastern Europeand theCommonwealth ofIndependent States(CIS)4007.6%Distribution of MPI poor people by region(millions)Arab States38.92.3%Sub-Saharan Africa458.127.6%South Asia843.850.9%East Asia and thePacific25515.4%Central andEastern Europeand theCommonwealth ofIndependent States(CIS)12.20.7%Latin America andCaribbean513.1%Latin America andCaribbean490.89.4%Note: A total of 5.2 billion people in 104 developing countries are considered, about 78.5 percent of the total worldpopulation estimated in 2007.4.1.5 The intensity of MPI poverty is greatest in South Asia and Sub-Saharan Africa. If onemerely gazes at a ranking of countries, one notices immediately that the poorest countries are all inSub-Saharan Africa (plus Somalia which is technically an Arab State). 52 Does this mean that Africa isthe poorest in terms of MPI? Un<strong>for</strong>tunately, South Asia also has comparable intensities of poverty.52 Please note that we use this ranking only indicatively.www.ophi.org.uk July 2010 33
<strong>Acute</strong> <strong>Multidimensional</strong> <strong>Poverty</strong>: A <strong>New</strong> <strong>Index</strong> <strong>for</strong> <strong>Developing</strong> CountriesAlkire & SantosIf we compare the MPI values of states within India alone, we find that 8 states with poverty asacute as the 26 poorest African countries, are home to 421 million multidimensionally poor persons,more than the 26 poorest African countries combined (410 million) (See also section 4.5). 53 Finally,even within Indian states further diversity is expected, so a district level analysis might bring outeven more variation. Just to provide a sense of perspective, the population of the poorest Indianstate Bihar, with 95 million people, exceeds the sum of nine of the ten poorest African countries. 54Hence because of the different sizes of the units of analysis, it is not possible to say definitely whereMPI poverty is more intense, but in either case what is clear is that both South Asia and Africa havea tragic intensity of poverty. In Bolivia, which we also decomposed, in no case does a state or ethnicgroup within Bolivia have a MPI that is comparable to these.4.1.6 The intensity of deprivations is highest in the countries with the highest MPIheadcounts. Recall that the MPI is the product of two components: the headcount or proportionof the population who are MPI-poor (incidence) and the average proportion of weighted indicatorsin which the MPI-poor persons are deprived (intensity). A natural question to explore is how thesetwo sub-indices relate to one another. Figure 7 plots average intensity (A) vs. headcount (H). Whatwe see is that there is a surprisingly uni<strong>for</strong>m relationship: countries with higher MPI headcountstend to have higher average intensity.Figure 7: MPI Intensity increases with Headcount53 The poorest twenty-six African countries are Cote d’Ivoire, Gambia, Zambia, Chad, Mauritania, Tanzania, Nigeria,Senegal, Malawi, DR Congo, Comoros, Benin, Madagascar, Rwanda, Angola, Mozambique, Liberia, Sierra Leone,Guinea, the Central African Republic, Somalia, Burundi, Burkina Faso, Mali, Ethiopia, and Niger. The eight Indian statesare West Bengal, Orissa, Rajasthan, Uttar Pradesh, Chhattisgarh, Madhya Pradesh, Jharkhand, and Bihar.54 It excludes Ethiopia, which has 78 million people.www.ophi.org.uk July 2010 34
<strong>Acute</strong> <strong>Multidimensional</strong> <strong>Poverty</strong>: A <strong>New</strong> <strong>Index</strong> <strong>for</strong> <strong>Developing</strong> CountriesAlkire & SantosAverage Breadth of <strong>Poverty</strong> (A)75%70%65%60%55%50%45%40%35%30%BrazilMPI = A x HMyanmarChinaPoorest Countries, Highest MPICote d´IvoirePakistanIndonesiaIndiaCambodiaBangladeshNigeria0% 10% 20% 30% 40% 50% 60% 70% 80% 90% 100%Percentage of People Considered Poor (H)DR CongoNigerEthiopiaLow High inco IncomeUpper-Middle IncomeLower-Middle IncomeLow Income4.1.7 Yet A and H have important differences: Their combination is key to the countryranking. Despite the fact that A and H are clearly highly correlated, what is interesting are theoutliers: those that have a low H but a high A, and vice versa. Consider three countries: the Republicof Congo (located on top of India), Cote d’Ivoire, and Cambodia. All have relatively similar MPIheadcounts: 56, 52, and 54 percent correspondingly. However, their average deprivations are 48percent <strong>for</strong> the Republic of Congo, 61 percent <strong>for</strong> Cote d’Ivoire, and 49 percent <strong>for</strong> Cambodia. Thisdifferences cause a change of ranking. When ordered by the MPI headcount, Cote d’Ivoire is theleast poor. However, by A and MPI, it becomes the poorest. The Republic of Congo, the poorest ofthe three countries according to the MPI headcount, is placed in the middle according to the MPI.Countries that have relatively high A values <strong>for</strong> their headcount include Suriname, Philippines,Vietnam, Myanmar and Lao. This suggests that countries can follow different pathways to reducemultidimensional poverty. For some may be easier to first reduce the proportion of the poor andonly later on the average deprivation share, <strong>for</strong> others the opposite can be more feasible. This is atopic requiring further analysis.www.ophi.org.uk July 2010 35
<strong>Acute</strong> <strong>Multidimensional</strong> <strong>Poverty</strong>: A <strong>New</strong> <strong>Index</strong> <strong>for</strong> <strong>Developing</strong> CountriesAlkire & SantosFigure 8: Composition of MPI by H and A<strong>Multidimensional</strong>Headcount(H)0.64AverageDeprivation Share(A)0.64<strong>Multidimensional</strong><strong>Poverty</strong> <strong>Index</strong>(MPI)0.360.620.620.340.600.600.32Coted´Ivoire0.580.580.300.560.540.560.540.280.26Republicof CongoCambodia0.520.520.240.500.500.220.480.480.200.460.460.18Figure 9 below provides a synthetic categorization of the countries according to their levels of Hand A. For a clearer picture, countries are colored according to the region of the world they belongto. In a bird´s eye look we can see that most Central and Eastern Europe and CIS countries have acombination of a very low headcount (below 2.5 percent) and an average deprivation share nohigher than 50 percent and usually lower than 45 percent. The Arab States, with the importantexceptions of Somalia and Yemen, have low headcounts (between 2.5 and 25 percent) and anaverage deprivation share no higher than 50 percent and most frequently below 45 percent. TheEast Asia and Pacific countries show a great variety, with some in the same categories as most ofCentral and Eastern Europe and CIS, some similar to most of the Arab States, and some alreadymentioned outliers (with high average deprivation share in relation with their headcount). LatinAmerican and Caribbean countries tend to be concentrated in middle-values of both H and A,except <strong>for</strong> Haiti. Apart from Sri Lanka, which has a relatively low H and A, South Asia countries arein the segment of countries with a headcount between 50 and 75 percent experiencing deprivationsin 50 to 55 percent of the weighted indicators, although as we have mentioned these aggregatefigures hide a huge variation, which is particularly important in large countries. Finally, most Sub-Saharan countries are concentrated in combinations of high H and A.www.ophi.org.uk July 2010 36
<strong>Acute</strong> <strong>Multidimensional</strong> <strong>Poverty</strong>: A <strong>New</strong> <strong>Index</strong> <strong>for</strong> <strong>Developing</strong> CountriesAlkire & SantosHeadcount(H)Figure 9: Categorisation of countries by their combination of H and AAverage Deprivation Share (A)Less than30%30-35% 35-40% 40-45% 45-50% 50-55% 55-60% 60-65% 65% ormoreSlovakia Uruguay OPT Croatia Czech RepublicSlovenia United Arab Emirates Macedonia LatviaAlbaniaMontenegroArmeniaSerbiaBelarusEcuadorBosnia and HerzegovinaLess than2.5%GeorgiaHungaryKazakhstanMoldovaRussian FederationUkraineUzbekistanThailandJordan Egypt Turkey Philippines Suriname MyanmarSyrian Arab Republic Iraq Indonesia Viet NamTunisia Tajikistan BrazilAzerbaijan China ParaguayEstonia Mongolia South Africa2.5%-25%KyrgyzstanBelizeArgentinaColombiaGuyanaDominicanMexicoPeruTrinidad and TobagoSri LankaSwaziland Djibouti Nicaragua LaoMoroccoBoliviaGuatemalaHonduras25%-50%GabonGhanaLesothoNamibiaZimbabweCambodia Yemen Benin Cote d´IvoireRepublic of Congo Haiti ComorosSao Tome and Principe Bangladesh MadagascarIndia MauritaniaNepal NigeriaPakistan Senegal50%-75%Cameroon TanzaniaChadDR CongoGambiaKenyaMalawiTogoZambiaRwanda Angola SomaliaCAR Burkina FasoLiberia BurundiEthiopiaMore than75%GuineaMaliMozambiqueSierra LeoneNigerArab StatesCentral and Eastern Europe and the CISEast Asia and the PacificLatin America and the CaribbeanSouth AsiaSub-Saharan Africawww.ophi.org.uk July 2010 37
<strong>Acute</strong> <strong>Multidimensional</strong> <strong>Poverty</strong>: A <strong>New</strong> <strong>Index</strong> <strong>for</strong> <strong>Developing</strong> CountriesAlkire & Santos4.1.8 Often deprivations in living standard contribute the most to multidimensional poverty.Figure 10 shows the dimensional contribution to MPI <strong>for</strong> each country. The contribution of eachdimension is calculated as the sum of the contribution of each indicator. 55 Deprivation in livingstandards (the green portion) often contributes more than deprivation in either of the other twodimensions although this varies. 56 In most countries, the second biggest contribution comes fromeducational deprivations.Figure 10: Contribution by dimension to MPIArmeniaHungaryMontenegroEcuadorCroatiaIraqUzbekistanAlbaniaKyrgyzstanMacedoniaThailandLatviaCote d'IvoireSouth AfricaPhilippinesGuatemalaMoroccoTurkeySurinameTajikistanSenegalMexicoMaliDominican RepublicBelizeGuineaMoldovaNigerCambodiaArgentinaMozambiqueMadagascarParaguayTogoBoliviaEthiopiaSao Tome and …Sierra LeoneCameroonGabonTanzaniaMalawiNamibiaZambiaRwandaSri LankaLesothoPeru0% 20% 40% 60% 80% 100%Contribution of education Contribution of health Contribution of living standards55 Each indicator´s contribution is the proportion of people who are poor and deprived in that particular indicator (thecensored headcount) multiplied by the indicator´s weight and divided by the total number of indicators times the overallMPI. For example, as can be seen in Table 2.A of the Appendix, 55.6 percent of people are poor and live in a householdwhere no one has completed five years of education. This indicator´s weight is 10/6 and Mozambique´s MPI is 0.48.Then, the contribution of deprivation in years of education in Mozambique is 55.6*(10/6)/(10*0.48)=19.3 percent.Following the same procedure, because the censored headcount in child school attendance is 40.3, deprivation in thisindicator contributes 14 percent to overall multidimensional poverty. There<strong>for</strong>e, both indicators together, whichconstitute the education dimension, contribute 33 percent to overall poverty.56 Specifically, this is the case in 55 out of the 104 countries, whereas in 22 countries deprivation in education is thebiggest contributor and in 25 countries health deprivations contribute the most to overall poverty. Recall our note abovewhich said that the higher deprivation headcounts in living standards indicators create a higher implicit weight on thisdimension.www.ophi.org.uk July 2010 38
<strong>Acute</strong> <strong>Multidimensional</strong> <strong>Poverty</strong>: A <strong>New</strong> <strong>Index</strong> <strong>for</strong> <strong>Developing</strong> CountriesAlkire & Santos4.2 Income poverty, wealth poverty, and the MPIThe most widely used measure of poverty at present is income poverty, either measured accordingto a national poverty line or by an international standard. The MPI comparisons with incomepoverty are illuminating. The preliminary analysis suggests that the MPI is capturing a slightlyoverlapping but largely distinct aspect of poverty.4.2.1 MPI and Income <strong>Poverty</strong> are relatedFigure 11 presents different correlation coefficients between three income headcounts (using the$1.25/day, $2/day and national poverty lines) and deprivations in each of the three dimensions ofthe MPI, as well as with the MPI itself. 57 In the first place, we can see that the headcounts with thetwo international poverty lines are highly correlated with the MPI, but correlations are much lowerwith the headcounts using the national poverty lines. Secondly, as expected, income poverty is mosthighly correlated with deprivation in the living standard dimension. This correlation is followed byhealth deprivation and then by education deprivation (this is the case with the $1.25 and $2/dayheadcounts, the opposite is true <strong>for</strong> the correlation with the national poverty headcount). However,as we explore below and in the following section, behind these relatively high correlations there is awide range of examples of mismatches between the two poverty criterion.Figure 11: Correlations of income poverty headcounts with MPI and dimensional headcountsPearson Spearman Kendall Tau-a Kendall Tau-bH Education 0.73 0.78 0.57 0.58$1.25/dayHeadcountH Health 0.78 0.82 0.61 0.62H Living Standard 0.88 0.90 0.72 0.74MPI 0.85 0.88 0.67 0.70$2/dayHeadcountNational<strong>Poverty</strong>HeadcountH Education 0.77 0.79 0.59 0.60H Health 0.82 0.83 0.63 0.64H Living Standard 0.90 0.90 0.73 0.74MPI 0.86 0.88 0.70 0.71H Education 0.53 0.54 0.37 0.37H Health 0.58 0.57 0.41 0.41H Living Standard 0.58 0.61 0.43 0.44MPI 0.55 0.57 0.42 0.42Figure 12 below plots the headcounts of those who are income poor against those who are MPIpoor. The size of each bubble is given by the number of MPI poor people in that country. Thegreen line plots the 45º line, while the black one plots the linear equation that best fits the scatterplot. The fact that the black line runs below the green one makes it clear that in most countries morepersons are MPI poor than income poor (as expected from the global headcounts). Obviously, thereare exceptions to this, as well as cases in which the MPI estimate is overwhelmingly higher than theincome headcount and we have named some of these outliers on both sides.57 These headcounts are those reported in Table 4 of the Appendix.www.ophi.org.uk July 2010 39
<strong>Acute</strong> <strong>Multidimensional</strong> <strong>Poverty</strong>: A <strong>New</strong> <strong>Index</strong> <strong>for</strong> <strong>Developing</strong> CountriesAlkire & SantosPercentage of People Under $1.25/dayFigure 12. Scatter plot of MPI vs. $1.25/day headcount100%Tanzania80%MozambiqueSwazilandNigeriaNiger60%DR CongoBangladeshMaliUzbekistanEthiopia40%PhilippinesSenegalChina20%IndonesiaIndiaBrazilPakistan0%‐20% 0% 20% 40% 60% 80% 100%Morocco‐20%Percentage of People MPI Poor4.2.2 MPI and GDP per capita vary widely except <strong>for</strong> higher income countriesFigure 13 plots GDP per capita in 2008 (PPP, current international $) against MPI headcount. Wehave traced an ad hoc line at a low GDP per capita level (about $1700) and we can see anextraordinary range of MPI levels. This shows that some low GDP countries are able to address theMPI indicators to a considerable extent. Among higher GDP per capita countries MPI is clearlylower in general. However, there are several noteworthy exceptions. For example, Peru, Gabon, andNamibia, classified as high income countries by the World Bank 58 , have relatively high MPIheadcounts relative to their GDP per capita. This is also the case of Angola, a lower-middle incomecountry.58 The World Bank classification is actually done using the Gross National Income per capita, calculated with the Atlasmethod, with the benchmarks being less than $975 per capita <strong>for</strong> low-income countries, between $975 and $3,855 <strong>for</strong>lower-middle income ones, between $3,856 and $11,905 <strong>for</strong> upper-middle income countries and $11,906 or higher <strong>for</strong>high-income countries.www.ophi.org.uk July 2010 40
<strong>Acute</strong> <strong>Multidimensional</strong> <strong>Poverty</strong>: A <strong>New</strong> <strong>Index</strong> <strong>for</strong> <strong>Developing</strong> CountriesAlkire & SantosFigure 13. Scatter plot of GDP per capita vs. MPI headcountGDP per capita 2008 PPP (current international $)30000250002000015000100005000CroatiaTrinidad and TobagoEstoniaTurkeyBrazilEcuadorArmeniaPeruMoroccoGabonNamibiaAngolaMoldovaIndiaGhanaCote d' IvoireComoros Ethiopia0Niger0.0 0.1 0.2 0.3 0.4 0.5 0.6 0.7 0.8 0.9 1.0<strong>Multidimensional</strong> <strong>Poverty</strong> Headcount4.2.4 At the household level, MPI and Income diverge among poorer countries. In mostcountries we do not have both income poverty data and MPI <strong>for</strong> the same households. However theWHS does include a basic consumption module <strong>for</strong> the households. Thus <strong>for</strong> the countries <strong>for</strong>which we used the WHS, we are able to explore a key question: to what extent are the samehouseholds identified as poor using two different measures, and to what extent do the differentmeasures identify completely different households as poor? 59 This is an important question becauseincome poverty measures are often used <strong>for</strong> targeting purposes.The exercise consists of identifying whether each household in the sample is income poor and MPIpoor or not, and then combining all households into four possible groups as in Figure 14 below: (A)Not Income Poor and Not MPI poor; (B) Not Income Poor but MPI poor; (C) Income Poor butNot MPI poor, and (D) Income Poor and MPI poor.Figure 14: Crosstab of income and MPI povertyMPINon-Poor PoorNot Poor A BIncome Poor C DIf Income and MPI were perfectly correlated, then the headcounts would coincide and allhouseholds would either be poor (cell D) or non-poor (cell A). Cells B and C represent Type II(exclusion) and Type I (inclusion) errors correspondingly in the sense that if the income indicatorwas used as a proxy variable to target the multidimensionally poor, B and C indicate the magnitudeof the mismatch between the two identification criterions, either because some multidimensionallypoor people would be ignored or because some multidimensionally non-poor people would beconsidered.We per<strong>for</strong>med this analysis with 18 of the total 19 WHS countries <strong>for</strong> which this was possible. Weused the US$1.25/day poverty line adjusted by the Purchasing Power Parity Conversion Factor in59 Note that these comparisons are accurate if and only if the consumption data are also accurate.www.ophi.org.uk July 2010 41
<strong>Acute</strong> <strong>Multidimensional</strong> <strong>Poverty</strong>: A <strong>New</strong> <strong>Index</strong> <strong>for</strong> <strong>Developing</strong> CountriesAlkire & Santos2002 provided by the World Bank (2004). 60 As a first indicative result, the Spearman correlationcoefficient between being income poor and being MPI poor is low in general and even negative in afew cases. The cases of negative correlation are South Africa, the Russian Federation, and Latvia: -0.024, -0.023 and -0.016, correspondingly. This is consistent with the magnitude of the Type I errorobtained <strong>for</strong> these countries. In other five countries (Estonia, Ecuador, Tunisia, Chad, and Uruguay)it is 0.10 or lower, and in China, Paraguay, Sri Lanka, Brazil, and Guatemala it is between 0.16 and0.37(countries in increasing order). The other countries have such small poverty numbers that thecoefficient cannot be estimated.For illustrative purposes, Figure 15 presents the described tabulation <strong>for</strong> three countries: Chad(MPI=0.34), China (MPI=0.05), and Sri Lanka (MPI=0.02). Sri Lanka is the least MPI poor andranks 32 nd in our MPI list; China ranks 44 th ; Chad ranks 81 nd . Chad is the poorest country <strong>for</strong> whichwe have income data. The figure presents the in<strong>for</strong>mation described above in two different ways. Inthe panel on the left we can see the percentages of population in each of the four categories, while inthe table on the right we can see the conditional probabilities given the classification in terms ofincome poverty. In other words, given that a household is not income poor, what is the probabilitythat it is identified as MPI poor? Conversely, given that a household is income poor, what is theprobability that it is not identified as multidimensionally poor?How significant are these errors? We find that they vary a great deal. In Sri Lanka, the discrepancybetween income poverty headcount (14 percent) and MPI headcount (5.3 percent) is very great,which reduces the power of this exploration. In that case we find that there is only a 4 percentchance that a household that is not income poor will be identified as poor by the MPI, suggestingthat the potential exclusion error of using the income poverty measure is low in this case (the twomeasures concur quite nicely). However, this coincidence between the two measures decreases <strong>for</strong>China and Chad. In China, there is a 12 percent probability that a person who is not income poor ismultidimensionally poor; in Chad it is 59 percent.Figure 15: Income poverty vs. MPI poverty in Sri Lanka, China and ChadPercentage of PopulationConditional Probability(Given Income <strong>Poverty</strong>)Sri LankaNot MPI Poor MPI Poor Total Not MPI Poor MPI Poor TotalNot Income Poor 78.51 2.85 81.37 Not Income Poor 0.96 0.04 81.37Income Poor 16.16 2.48 18.63 Income Poor 0.87 0.13 18.63Total 94.67 5.33 100 Total 94.67 5.33 100ChinaNot MPI Poor MPI Poor Total Not MPI Poor MPI Poor TotalNot Income Poor 85.71 11.60 97.31 Not Income Poor 0.88 0.12 97.31Income Poor 1.82 0.87 2.69 Income Poor 0.68 0.32 2.69Total 87.53 12.47 100 Total 87.53 12.47 100ChadNot MPI Poor MPI Poor Total Not MPI Poor MPI Poor TotalNot Income Poor 23.12 33.45 56.56 Not Income Poor 0.41 0.59 56.56Income Poor 13.98 29.45 43.44 Income Poor 0.32 0.68 43.44Total 37.10 62.90 100 Total 37.10 62.90 10060 http://siteresources.worldbank.org/ICPINT/Resources/Table5_7.pdf. We count with expenditure in<strong>for</strong>mation <strong>for</strong>the United Arab Emirates, but the PPP conversion factor is not available <strong>for</strong> 2002.www.ophi.org.uk July 2010 42
<strong>Acute</strong> <strong>Multidimensional</strong> <strong>Poverty</strong>: A <strong>New</strong> <strong>Index</strong> <strong>for</strong> <strong>Developing</strong> CountriesAlkire & SantosLooking at the equivalent of cell C in Figure 14 in Figure we can see the other kind of divergence:the chance that a household that is income poor will be identified as non-poor by MPI (inclusion errorwhen using income poverty to target the multidimensionally poor). Here we see the opposite crosscountrypattern. In Sri Lanka, MPI would consider non-poor 87 percent of the income-poorhouseholds; in China 68 percent, and in Chad 32 percent.Figure 16 summarizes the magnitudes of cells B and C <strong>for</strong> 18 (out of the 19) WHS countries, whichconfirms the a<strong>for</strong>ementioned pattern. Countries are sorted by the MPI. Clearly, the exclusion error(percentage of people who are not income poor but MPI poor) is higher <strong>for</strong> poorer countries,whereas the inclusion error (percentage of people who are income poor but not MPI poor) is higher<strong>for</strong> less poor countries. It may be worth recalling that the poverty estimates of South Africa,Guatemala, Sri Lanka, Tunisia, the Russian Federation, and Latvia should be seen as lower bounds.This may explain part of the inclusion error.Figure 16: Income poverty vs. MPI poverty: insightful mismatches35%30%25%20%15%10%5%0%Income Poor & MPI Non-Poor Income Non-Poor & MPI Poor MPIAdmittedly these results are indicative only, especially because the consumption module isabbreviated in WHS. However they do suggest that income becomes a poorer proxy <strong>for</strong> MPI amonghigh poverty countries, perhaps in part because income does not capture access to basic services. 61Although DHS does not contain an expenditure module, it collects in<strong>for</strong>mation on differenthousehold assets (access to services and amenities, many of which are considered in the MPI). Withthis in<strong>for</strong>mation, the survey calculates the DHS Wealth <strong>Index</strong>. MICS also computes the same index.The DHS Wealth <strong>Index</strong> treats wealth (and economic status) as an underlying unobserved dimensionthat is estimated using latent variable techniques such principal components analysis. The indicatorsused to compute the index´s score include type of flooring; type of roofing; wall material, watersupply, type of sanitation facility, access to electricity, radio, television, refrigerator, watch, type ofvehicle, furniture items, people per room, ownership of agricultural land and size, ownership ofanimals, domestic servant, telephone, bank account, type of windows, and appliances. The index hasbeen criticized as being too urban in its construction and not able to distinguish the poorest of the61 In future research we will per<strong>for</strong>m the same analysis with alternative income poverty lines.www.ophi.org.uk July 2010 43
<strong>Acute</strong> <strong>Multidimensional</strong> <strong>Poverty</strong>: A <strong>New</strong> <strong>Index</strong> <strong>for</strong> <strong>Developing</strong> CountriesAlkire & Santospoor from other poor households (Rutstein, 2008). People are classified in quintiles according totheir index´s score.We computed Spearman correlation coefficients between the DHS Wealth <strong>Index</strong> category and beingMPI-deprived in each dimension, and between being identified as MPI poor and being deprived ineach dimension. 62 As expected the correlation between being MPI poor and deprived in health oreducation is twice or more the correlation with the category of the DHS Wealth <strong>Index</strong>. In terms ofdeprivation, in the living standard dimension the correlations tend to be closer, and in some casesthe DHS index has a higher correlation.In the same lines as the table of Figure 14, we computed <strong>for</strong> the 44 (out of the 49) DHS countries(<strong>for</strong> which we had the DHS Wealth <strong>Index</strong>) the percent of population that is MPI poor and MPInon-poor that belongs to each wealth index quintile. Figure 17 presents the two extremes: thepercent of people that although being in the poorest wealth index quintile are not MPI poor (whichcan be associated with an inclusion error) and the percent of people that although being in thehighest wealth index quintile are MPI poor. Countries are presented in increasing order according totheir MPI headcount. The figure reaffirms the pattern previously described with income. Inclusionerror is higher <strong>for</strong> non-poor countries whereas exclusion errors are higher <strong>for</strong> poor countries. Infact, countries to the left of the first vertical lines have MPI headcounts lower than 20 percent, so weexpected a high inclusion error. Conversely, countries to the right of the second vertical line haveMPI headcounts above 80 percent, so we expected a high exclusion error.The evidence, obtained using micro-data comparing the poor identified using income and wealthwith the poor identified using the MPI criterion, is consistent with that obtained with macro-data(the two previous sub-sections): having enough income is no guarantee of being non-deprived incore aspects of well-being. With this we do not intend to say that income is not an importantindicator. Although it has no intrinsic value, income does have a tremendous instrumental valuebecause it is fungible and has the potential of allowing people to make certain choices – providedopportunities exist. There<strong>for</strong>e, we believe that a multidimensional measure such as the MPIconstitutes a powerful and necessary instrument to evaluate poverty but is not sufficient; it couldusefully be complemented by income measures. Alternatively, whenever data allows, income couldbe incorporated as one indicator of a multidimensional poverty measure such as the MPI. Indeed,such an approach has been followed by the Government of Mexico in its poverty measure, as well asin studies at the country level (Santos et al. 2010, Santos and Ura 2008, Yu 2008). 63 Also note thatthe fact that in very high and high HDI countries, as well as in some of the medium HDI countries,we find the income poverty headcount to be higher than the MPI headcount and we find high`inclusion´ errors. This signals what has been previously argued: these countries need a differentversion of the MPI whose indicators and cutoffs are appropriate to that context. An MPI withdifferent cutoffs and/or different indicators can succeed in depicting poverty composition in moredeveloped countries.62 Here we followed the procedure of the headcounts of Table 1.9.63 Note that most frequently the surveys that collect good quality data on income or expenditure are not the same as theones that collect good quality data on health, such as on nutrition and child mortality. In the MPI we preferredprivileging health indicators which evidence functionings much more accurately than income.www.ophi.org.uk July 2010 44
<strong>Acute</strong> <strong>Multidimensional</strong> <strong>Poverty</strong>: A <strong>New</strong> <strong>Index</strong> <strong>for</strong> <strong>Developing</strong> CountriesAlkire & Santos20%18%16%14%12%10%8%6%4%2%0%Figure 17: DHS Wealth <strong>Index</strong> vs. MPI poverty: insightful mismatchesUkraineMoldovaArmeniaJordanAzerbaijanTurkeyColombiaPhilippinesGuyanaPeruIndonesia*Morocco*Ghana*Honduras*Bolivia*Zimbabwe*Namibia*Swaziland*Lesotho*Pakistan*Cote d'Ivoire*Cambodia*Cameroon*India*Republic of Congo*Haiti*Bangladesh*Kenya*Nigeria*Zambia*Senegal*Nepal*Tanzania*Madagascar*Benin*Malawi*DR Congo*Mozambique*Rwanda◊Guinea◊Liberia◊Mali◊Ethiopia◊Niger◊Wealth Poorest & MPI Non-PoorWealth Richest & MPI Poor4.3 Regional AnalysisThe set of 104 countries is spread across UN regions as follows:~ 24 countries of Europe and Eastern Europe and the Commonwealth of Independent States(CIS), adding up to a population of 400 million in 2007~ 11 Arab States, adding up to a population of 217.5 million in 2007~ 18 countries of Latin America and the Caribbean, adding up to 491 million in 2007~ 5 countries of South Asia, adding up to a population of 1,544 million in 2007~ 9 countries of East Asia and the Pacific, adding up to a population of 1,868 million in 2007~ 37 countries of Sub-Saharan Africa, adding up to a population of 710.4 million in 2007As summarized in Figure 18, the MPI ranks these regions as follows:1) Europe and Eastern Europe and the Commonwealth of Independent States (CIS) (thelowest): a population-weighted average of 3 percent poor people. Although this is a very low figure,it still means that about 12.2 million people are MPI poor in this region.2) Latin America and the Caribbean: a population-weighted average of 10.4 percent poor people,which means about 51 million people are MPI poor in this region of the world3) East Asia and the Pacific: a population-weighted average of 13.7 percent poor people, whichmeans about 255 million people are MPI poor in this region of the world4) Arab States: a population-weighted average of 17.9 percent poor people, which means about38.9 million people are MPI poor in this region of the world.5) South Asia: a population-weighted average of 54.7 percent poor people, which means about843.8 million people are MPI poor in this region of the world6) Sub-Saharan Africa: a population-weighted average of 64.5 percent poor people, which meansabout 458 million people are MPI poor in this region of the worldAdding up all the multidimensionally poor, about 1,659 million people have been identifiedas being deprived in some combination of at least two to six indicators. On average, acrossall countries, people are, on average, deprived in 53 percent of the ten indicatorswww.ophi.org.uk July 2010 45
<strong>Acute</strong> <strong>Multidimensional</strong> <strong>Poverty</strong>: A <strong>New</strong> <strong>Index</strong> <strong>for</strong> <strong>Developing</strong> CountriesAlkire & SantosFigure 18: Summary MPI and income poverty estimates by UN regionsRegionPopulationin theregion(millions)Regional H(Proportion) Regional ARegionalMPIMPI poorpopulation(millions)$1.25/daypoor(Proportion)$1.25/daypoorpopulation(millions)$2/day poor(Proportion)$2/daypoorpopulation(millions)Central and Eastern Europe and theCommonwealth of Independent States (CIS) 400 0.030 0.421 0.013 12.2 0.055 22.0 0.098 39.4Latin America and Caribbean 490.8 0.104 0.462 0.048 51.0 0.074 36.5 0.150 73.7East Asia and the Pacific 1867.7 0.137 0.465 0.063 255.0 0.173 323.7 0.385 719.9Arab States 217.5 0.179 0.506 0.090 38.9 0.031 6.8 0.144 31.3South Asia 1543.9 0.547 0.532 0.291 843.8 0.402 620.3 0.740 1143.1Sub-Saharan Africa 710.4 0.644 0.582 0.375 457.5 0.520 369.5 0.730 518.3Total 104 countries 5230.3 0.317 0.532 0.169 1658.3 0.264 1378.8 0.483 2525.7Composition of MPI by Region. A natural question is whether the composition of poverty variesacross regions of the world to identify whether deprivation in a particular dimension is more acute incertain regions than in others. It is important to note that this analysis needs to consider both therelative contribution of each dimension to overall poverty as well as the absolute levels the MPIpoor experience in each dimension. All the figures mentioned below are contained in Tables 1.4-1.6in Appendix 1.1) South AsiaIn terms of human lives, South Asia has the world’s highest levels of poverty. Fifty-one percent ofthe population of Pakistan is MPI poor, 58 percent in Bangladesh, 55 percent in India, and 65percent in Nepal. In these four countries, the poor are deprived on average in more than half of the(weighted) indicators. In India, Bangladesh, and Nepal, deprivation in living standard is the highestcontributor of poverty, followed by health and education. In Pakistan the contributions are fairlysimilar (note that Pakistan did not have in<strong>for</strong>mation on nutrition). Sri Lanka is the only one of thefive countries we consider in this region that has low poverty estimates, with only 5 percent of MPIpoorpeople. The headcounts of the other four countries are relatively more uni<strong>for</strong>m than in otherregions. It is worth noting that water has low deprivation levels among the MPI poor in thesecountries (the highest being 14 percent in Nepal). Also, electricity has a low deprivation rate amongthe MPI poor in Pakistan (9 percent). However, deprivation in the other living standard indicators(and in electricity in India, Bangladesh, and Nepal) range from 26 percent to 63 percent, beingparticularly high in Nepal. Deprivation rates in the two health indicators are also high: 30 percent inPakistan and Nepal are poor and live in a household where at least one child died; this rate is 24percent in Bangladesh and 23 percent in India. Deprivation in nutrition of children and women ishigh, signaled by the fact that 40 percent of people in Nepal and 39 percent in India live in a poorhousehold where at least one child or woman is undernourished. This rate is 37 percent inBangladesh (there are no figures <strong>for</strong> Pakistan). Although education is the lowest contributor topoverty, deprivation rates are still high: between 17 percent and 29 percent of people in these fourcountries are poor and live in a household where no one completed five years of education. Thirtyfourpercent of the poor in Pakistan, 25 percent in India, and 15 percent in Nepal live in ahousehold where one or more children are not attending school. It is worth noting that inBangladesh only 9 percent of people live in poor households with children not attending school.Note that these country averages hide a huge diversity. In Section 4.4 below we decompose India’spoverty by state and find headcounts ranging from 14 percent to 81 percent.www.ophi.org.uk July 2010 46
<strong>Acute</strong> <strong>Multidimensional</strong> <strong>Poverty</strong>: A <strong>New</strong> <strong>Index</strong> <strong>for</strong> <strong>Developing</strong> CountriesAlkire & Santos2) Sub-Saharan AfricaAfrica presents the highest MPI poverty rates, with considerable variation among the 38 countries.The percentage of multidimensionally poor ranges from 3 percent in South Africa to 93 percent inNiger, while the average percentage of deprivations ranges from 44 percent in Swaziland to 69percent in Niger. In 33 of the estimated Sub-Saharan African countries, the highest contributor topoverty is the deprivation measured by the living standard variables. Some of the most strikingresults include: In Guinea, Mali, and Niger, more than 50 percent are poor and live in a household whereat least one child has died. In Nigeria, Madagascar, Mali, and Burkina Faso 30 percent or more are poor and live in ahousehold where at least a woman or a child is undernourished. In Liberia, the Central African Republic, Mali, Ethiopia, Burkina Faso, and Niger, morethan 55 percent are poor and live in a household where there are children of school agenot attending school. In Mozambique, Guinea, Burundi, Mali, Ethiopia, Burkina Faso, and Niger, more than 50percent are poor and live in a household where no one has completed five years ofeducation.3) Latin America and the Caribbean:The poverty estimates in the eighteen Latin American and Caribbean countries present a widevariety, from 1.6 percent of MPI poor in Uruguay and 2.2 percent in Ecuador to 57 percent inHaiti. In the middle, there is Colombia with 9.2 percent, Brazil with 8.5 percent, and Bolivia with36 percent. However, the average deprivation is more stable, ranging from 34 percent in Uruguay to58 percent in Suriname. Clearly, Haiti is the country with the most striking deprivation levels: 50percent are poor and are deprived in electricity, 53 percent lack improved sanitation, 34 percent lackan improved water source, 35 percent lack an adequate floor, 57 percent are deprived in nonbiomasscooking fuel and 49 percent in assets. In Nicaragua, deprivation in the living standardvariables is between 24 and 36 percent; in Peru, Honduras, and Bolivia, it ranges from 12 percent to35 percent. Living standard deprivation is 12 percent or lower in all the others except <strong>for</strong> Guatemala,where such deprivation ranges from 3 percent to 23 percent. With respect to deprivation ineducation and health, it is worth noting that 23 percent of people in Bolivia and Honduras live in apoor household where a school-age child is not attending school. Also, 27 percent of people in Haitiand 19 percent in Bolivia live in a poor household that experienced a child death, while 11 percentof people in Haiti live in a poor household with an undernourished woman or child.4) East Asia and Pacific:Thailand and China have relatively low poverty estimates: China has 13 percent of people who areMPI poor, 64 while Thailand has only 0.8 percent. At the other extreme, Cambodia has 54 percent ofMPI poor, who on average are deprived in half of the (weighted) indicators. Indonesia issomewhere in the middle with 21 percent MPI poor. In terms of poverty composition, deprivationin living standard is the highest contributor in Mongolia and Cambodia, although clearly, thedeprivation levels in Cambodia are far higher than in Mongolia. In Cambodia, 50 percent or more of64 We also calculated China’s MPI using the CHNS, and found that 7 percent of people were poor according to it. Butthis survey covers only nine provinces of the country. As the WHS survey is also quite small, covering just under 4,000households, we refrain from making detailed analyses.www.ophi.org.uk July 2010 47
<strong>Acute</strong> <strong>Multidimensional</strong> <strong>Poverty</strong>: A <strong>New</strong> <strong>Index</strong> <strong>for</strong> <strong>Developing</strong> CountriesAlkire & Santospeople live in poor households which are deprived in electricity, improved sanitation, and cookingfuel; 30 percent are deprived of a safe source of drinking water; and 23 percent are deprived in assets(only the floor variable has a low headcount, 5 percent). Between 15 percent and 26 percent ofCambodians are poor and deprived in the education and health indicators. In Thailand and China,the highest contributor to overall poverty is deprivation in education. The headcounts, however, arevery low in general.5) Arab StatesThe Arab States constitute a highly heterogeneous group: the UAE, Occupied PalestinianTerritories, Jordan, Tunisia, Syria, and Egypt have MPI headcounts below 7 percent. Iraq hasan MPI-poor population of 14.2 percent. Morocco and Djibouti have an MPI-poor population of28 and 29 percent correspondingly, and the percentage in Yemen is 52 percent. In Somalia, the 6thpoorest country among the 104, 81 percent of people are poor, and they are deprived – on average –in 63 percent of the weighted indicators. In most of the Arab States, deprivation in education is thehighest contributor to poverty, but the headcounts are significant only in Djibouti and Morocco: 13percent of people in Djibouti and 18 percent in Morocco live in poor households where no onecompleted five years of education. The deprivation in terms of child school attendance reverses theorder: in Djibouti 18 percent of people are in poor households with children not attending schoolwhereas this is 15 percent in Morocco. In Jordan, Tunisia, and Yemen, the highest contributor topoverty is health deprivation, but headcounts are very low in the first two countries, whereas 34percent of people live in poor households that have experienced a child death in Yemen. InSomalia, the highest contributor of poverty is living standard: between 64 and 81 percent of thepopulation is deprived in some of these indicators.6) Europe and Eastern Europe and the Commonwealth of Independent States (CIS)In Europe and Central Asia the levels of poverty estimated with MPI are very low. In Slovenia andSlovakia the MPI is zero. In the Czech Republic and Belarus the MPI headcount is below 0.2percent whereas in Latvia, Kazakhstan, Hungary, Georgia, Bosnia and Herzegovina, Serbia, andAlbania, the MPI headcount is below 1 percent. In the Russian Federation, Montenegro, Croatia,Macedonia, Ukraine, Moldova, Armenia, and Uzbekistan, it ranges from 1.3 percent to 2.3 percent.In Kyrgyzstan and Azerbaijan it is about 5 percent. Estonia and Turkey show higher percentages ofMPI-poor people, 7.2 percent and 8.5 percent, respectively. Tajikistan is the poorest country in thisregion, with 17 percent poor people. We do not believe that the MPI will be able to guide policysignificantly in these countries; a different measure is required.4.4 Decompositions by state and ethnic group 65One of the strengths of the Alkire Foster methodology is that can be decomposed by populationsubgroup. Furthermore, it can be broken down by indicator to reveal the post-identificationcomposition of multidimensional poverty <strong>for</strong> different groups. This technical feature is oftremendous practical value <strong>for</strong> policy. Given the need to accelerate progress towards the MDGs, <strong>for</strong>example, it is vital to understand the composition of deprivations among different states and ethnicgroups, so that interventions address their particular deprivations most effectively. Naturally,decomposition is only possible when the data are representative by the relevant groups, so it was notpossible to decompose all 104 countries by any common factors other than rural-urban. However to65 We are very grateful to Suman Seth <strong>for</strong> per<strong>for</strong>ming the decomposition calculations in India, Kenya, and Bolivia.www.ophi.org.uk July 2010 48
<strong>Acute</strong> <strong>Multidimensional</strong> <strong>Poverty</strong>: A <strong>New</strong> <strong>Index</strong> <strong>for</strong> <strong>Developing</strong> CountriesAlkire & Santosillustrate what could be done at the national level, we have decomposed the MPI by region andethnicity <strong>for</strong> Bolivia, Kenya, and India.The map presents the MPI values decomposed across states and union territories of India. We findthat Delhi has an MPI equivalent to Iraq (which ranks 45), whereas Bihar’s MPI is similar toGuinea´s (the 8 th poorest country in the ranking). In terms of headcount, in Delhi and Kerala 14percent and 16 percent of the population are MPI poor, respectively, whereas in Jharkhand 77percent of the population are MPI poor and in Bihar (the darkest red on the map), 81 percent.Figure 19: Map of India MPI by StateSimilarly, in Kenya, headcounts range from 12 percent to 98 percent. Figure 20 links the MPIestimates of the different Kenyan states and regions to the MPI estimates in other countries. Forexample, the MPI in Nairobi is comparable to that of the Dominican Republic, whereas in the ruralnortheast, it is worse than Niger. In Bolivia the MPI headcount ranges from 27 percent to 46percent. Naturally, the headcounts depend in part on the size of the population in the respectivestate or area, but they suggest considerable variation in MPI levels.When we come to consider the composition of poverty among states, we find that this varies, evenbetween states having similar levels of MPI. Consider, <strong>for</strong> example, two of the less-MPI poor Indianstates, Punjab and Himachal Pradesh, which are neighboring states and are also adjacent in the MPIranking. Figure21 below shows that the composition of their poverty is quite different. HimachalPradesh has very low contributions of education to its poverty in comparison with the Punjab, butmore malnutrition, as well as asset poverty.www.ophi.org.uk July 2010 49
<strong>Acute</strong> <strong>Multidimensional</strong> <strong>Poverty</strong>: A <strong>New</strong> <strong>Index</strong> <strong>for</strong> <strong>Developing</strong> CountriesAlkire & SantosFigure 20: MPI estimates of Kenyan states compared with aggregate MPI in other countries0.00MexicoBrazil0.100.20ChinaDominicanRepublicIndonesiaGhanaBoliviaNairobiCentralCentralUrbanCentralRuralMPI Value0.300.40IndiaKenyaTanzaniaEasternWesternCoastRift ValleyNyanza0.50Mozambique0.60MaliNorthEasternUrban0.70NigerNorthEasternNorthEasternRural0.80Figure 21: Composition of poverty in two Indian states100%90%11.7%4.6%9.0%80%70%60%50%40%30%20%10%0%18.2%12.8%23.3%9.4%7.4%10.4%5.2%Punjab11.5%31.7%11.9%6.5%12.4%8.5%Himachal PradeshSchoolingSchool AttendanceMortalityNutritionElectricitySanitationWaterFloorCooking FuelAssetswww.ophi.org.uk July 2010 50
<strong>Acute</strong> <strong>Multidimensional</strong> <strong>Poverty</strong>: A <strong>New</strong> <strong>Index</strong> <strong>for</strong> <strong>Developing</strong> CountriesAlkire & SantosAnother category that can be tremendously important <strong>for</strong> policy relates to ethnicity, religionsaffiliation, and caste. For example, Mexico’s national multidimensional poverty measure, launched in2009, highlighted the problem of indigenous poverty because the multidimensional poverty rates ofindigenous peoples were much higher. For example, in Kenya, the MPI headcount ranged from 29percent <strong>for</strong> the Embu to 96 percent <strong>for</strong> the Turkana and Masai. In Bolivia, poverty among mestizoswas 27 percent, but 1.6 times that among the Quechua. In India, the decomposition was per<strong>for</strong>med<strong>for</strong> caste groupings. The Scheduled Tribes have the highest MPI (0.482), almost the same asMozambique, and a headcount of 81 percent. The Scheduled Castes have a headcount of 66 percentand their MPI is a bit better than Nigeria. Fifty-eight percent of other Backward Castes are MPIpoor. About one in three of the remaining Indian households are multidimensionally poor, and theirMPI is just below that of Honduras.4.5 Clustered Deprivations 66Another key question <strong>for</strong> policy is whether it is possible to identify certain ‘types’ ofmultidimensional poverty, which would suggest distinctive policy pathways. Our results here arepreliminary and suggest that this will be a fruitful area to explore. For example, consider in Figure 22Ghana and Mali – two countries with very different MPI values. In Ghana, 30 percent people areMPI poor where as in Mali it is 87 percent. Yet what is interesting is the pattern of theirdeprivations. The spider diagrams below have one spoke <strong>for</strong> each of the ten indicators. 67 What isevident is that in both countries, deprivations in cooking fuel, sanitation, and electricity are thehighest, and health deprivations are relatively low.A very different situation is present in comparing the Gambia and Zambia, which have equal MPIvalues, but a different configuration of deprivations, with deprivations in floor, water, and sanitationbeing much higher in Zambia, whereas schooling and education are more problematic in Gambia.Figure 22: MPI Composition patternsCookingFuelAssetsSchooling1.00.80.60.40.20.0SchoolAttendanceMortalityCookingFuelAssetsSchooling1.00.80.60.40.20.0SchoolAttendanceMortalityFloorNutritionFloorNutritionDrinkingWaterSanitationElectricityDrinkingWaterSanitationElectricityGhana (MPI=0.140)Mali (MPI=0.564)Gambia (MPI=0.324)Zambia (MPI=0.325)Note: the deprivations graphed are the censored headcounts, that is, the proportion of population that is poor anddeprived in that particular indicator.66 We are grateful to Jose Manuel Roche <strong>for</strong> very helpful insights <strong>for</strong> this section and <strong>for</strong> per<strong>for</strong>ming the cluster analysis.67 Ideally there should be 3 main spokes <strong>for</strong> each dimension at 120 degrees, and the asset indicators should bedistributed so that the spokes also reflect our weighting.www.ophi.org.uk July 2010 51
<strong>Acute</strong> <strong>Multidimensional</strong> <strong>Poverty</strong>: A <strong>New</strong> <strong>Index</strong> <strong>for</strong> <strong>Developing</strong> CountriesAlkire & SantosMore generally, a cluster analysis per<strong>for</strong>med on the 62 countries with complete indicators, suggeststhat these can be grouped in five typologies, as depicted in Figure 23. Types 3 and 4 are the onesthat concentrate the great majority of countries, all of them with high acute poverty. In both typesthe contribution of deprivations in the living standard variables are the highest (an averagecontribution of 52 percent in Type 3 and of 42 percent in Type 4). The difference is that while inType 3 the contribution of the other two dimensions is fairly similar (22 percent by education and 25percent by health) in Type 4, the contribution of deprivations in education is relatively much bigger(34 percent vs. 23 percent). It is also worth noting that in both of these types, within the healthdimension, mortality contributes relatively more than malnutrition. These two typologies group 33of the 37 African countries, together with a few LAC, Arab States and EAP. 68 On the other hand,Type 2 contains India, Bangladesh and Nepal, also countries with high acute poverty, together withNamibia and Colombia. This type also shows a high contribution by deprivations in living standardvariables. However, the second salient contribution is given by deprivations in health, and withinthis one, malnutrition contributes relatively more than mortality. The first and the fifth types arecomposed of relatively low-poverty countries and in both groups health deprivations are the onesthat contribute most to poverty, followed by deprivation in education. However, the typology here islikely to be more dominated by the low poverty levels than by the specific contributions.Figure 23 Five ‘types’ of poverty found across countries100%90%80%70%60%50%40%30%20%10%0%Type 1 Type 2 Type 3 Type 4 Type 5AssetsCooking FuelFloorDrinkingWaterSanitationElectricityNutritionChild MortalityChild SchoolAttendanceSchooling68 Countries included in Group 3 are: Kenya, Republic of Congo, Sierra Leone, Lesotho, Nigeria, Rwanda, Haiti, Belize,Angola, Peru, Cameroon, Mongolia, Swaziland, Zambia, Bolivia, Zimbabwe, Malawi, Gabon, DR Congo and Liberia.Countries included in Group 4 are: Mauritania, Mexico, Ghana, Benin, Madagascar, Cambodia, Comoros, Mali,Dominican Republic, Gambia, Mozambique, Ethiopia, Somalia, Burkina Faso, Djbouti, Senegal, Sao Tome and Principe,Nicaragua, Togo, Morocco, Niger and Guinea. Countries in Group 5 have the particular feature that, the contribution ofdeprivation in child school attendance is particularly important. The countries that <strong>for</strong>m Group 1 are Moldova, Georgia,Kazakstan, Belarus, Albania, Armenia, Occupied Palestinian Territories, Thailand, Uzbekistan and Macedonia. Those inGroup 5 are, Syrian Arab Republic, Tajikistan, Jordan, Azerbaijan and Iraq.www.ophi.org.uk July 2010 52
<strong>Acute</strong> <strong>Multidimensional</strong> <strong>Poverty</strong>: A <strong>New</strong> <strong>Index</strong> <strong>for</strong> <strong>Developing</strong> CountriesAlkire & SantosFigure 24 reflects more vividly the mentioned health deprivation pattern of South Asia, withrelatively higher malnutrition incidence and Africa, with relatively higher mortality. 69 The figure plotsthe percentage of people that live in poor households which have undernourished members againstthe percentage of people who live in poor households where at least one child has died. We see thatthe bubbles corresponding to the South Asian countries are below the diagonal of the square whilemost of the bubbles of the Sub-Saharan African countries are above the diagonal. 70Figure 24: Malnutrition and Mortality in Sub-Saharan Africa and South AsiaPercentage of people in poor households where at least onechild has died60%NigerMali50%Nigeria40%EthiopiaNepalDR Congo30%20%BangladeshIndia10%0%0% 10% 20% 30% 40% 50% 60%Percentage of people in poor households with undernourished membersSub-SaharanAfricaSouth Asia4.6 Changes of MPI over time 71The strong linkages of the MPI components to the MDGs and their indicators make it a good tool<strong>for</strong> monitoring progress towards the achievement of the MDGs. It can also serve as an instrument<strong>for</strong> evaluating a government´s progress in improving the wellbeing of the poorest poor. Comparabledatasets <strong>for</strong> each country over time are not abundant, which – one more time – calls <strong>for</strong>improvement in the systematic data collection of key indicators worldwide. As we explained in theData section, both DHS and MICS have gone through different phases and their questionnaireshave changed over time. In particular, DHS be<strong>for</strong>e Phase IV (year 2000) tends to be quite different.There<strong>for</strong>e, evaluating the MPI over time <strong>for</strong> the 104 countries was not possible. However,estimations of MPI over time and trend analysis <strong>for</strong> a handful of countries <strong>for</strong> which there is dataavailability are in progress and will constitute a separate study. As an example, we now present the69 Such pattern has also been noted by Klasen (2008).70 Only in a few Sub-Saharan African countries do we find malnutrition to be more prevalent than mortality. These areSouth Africa, Chad, Namibia, Madagascar, and Comoros. Also note that Burundi, Tanzania, and Cote d’Ivoire are notincluded in this analysis as we do not have nutritional in<strong>for</strong>mation <strong>for</strong> them. In China malnutrition seems to be moreprevalent than mortality.71 We are grateful to Juan Pablo Ocampo and Mauricio Apablaza <strong>for</strong> calculations of MPI <strong>for</strong> surveys prior to 2000 andto Gaston Yalonetzky <strong>for</strong> his insights into the analysis.www.ophi.org.uk July 2010 53
<strong>Acute</strong> <strong>Multidimensional</strong> <strong>Poverty</strong>: A <strong>New</strong> <strong>Index</strong> <strong>for</strong> <strong>Developing</strong> CountriesAlkire & SantosMPI change <strong>for</strong> three countries between two points in time: Bangladesh between 2004 and 2007,Ethiopia between 2000 and 2005, and Ghana between 2003 and 2008. The time span covered ineach country differs both in points in time as well as in duration (three years in Bangladesh and fiveyears in Ethiopia and Ghana). Following this, we intend to exemplify the potential analysis that eachcountry can pursue.Figure 25 presents the MPI estimates <strong>for</strong> the three countries in the mentioned years, alongside theestimates of the MPI components: headcount (H) and intensity (A). In the cross-country set ofestimates, Ghana ranks 57, with an MPI of 0.14; Bangladesh ranks 73, with an MPI of 0.29. Ethiopiais the second poorest country in the cross-country comparison. In each of these three countries,poverty has decreased over the two points in time. Ethiopia – the poorest country of these three –had the smallest MPI reduction, of 16 percent (from 0.69 to 0.58). In Bangladesh, there has been anMPI reduction of 22 percent (from 0.37 to 0.29) whereas in Ghana the poverty reduction has beenthe largest, halving the MPI (it decreased from 0.29 to 0.14).10.90.80.70.60.50.40.30.20.10MPI - 2004MPI - 2007H - 2004H - 2007A - 2004A - 2007MPI - 2000MPI - 2005H - 2000H- 2005A - 2000A - 2005MPI - 2003MPI - 2008H - 2003H - 2008A - 2003A - 2008Bangladesh Ethiopia GhanaFigure 25: MPI in two points in time in Bangladesh, Ethiopia and GhanaHow have the corresponding transitions been? As can be seen in the figure, in the three countries,MPI was reduced as a consequence of a reduction of both H and A. That is, there was a reduction inthe proportion of people with coupled deprivations and they experienced a reduction in the numberof deprivations. It is worth noting that <strong>for</strong> the MPI to be reduced it is not necessary that both H andA are reduced, one of the two may remain constant or even increase (as long as the reduction in theother is sufficiently large).A natural question is which of the two reductions dominated, whether H or A. As suggested earlierin the paper, different countries follow different paths and this is exemplified in this set of countries.Figure 26 presents the percent variations of MPI and its components in each country. The height ofthe bar from the X-axis to the negative Y-axis quadrant minus the positive part of the bar gives thetotal percent variation of the MPI in each country. The shading in green indicates the percentvariation in H, whereas the shading in red indicates the percent variation in A. The light brownwww.ophi.org.uk July 2010 54
<strong>Acute</strong> <strong>Multidimensional</strong> <strong>Poverty</strong>: A <strong>New</strong> <strong>Index</strong> <strong>for</strong> <strong>Developing</strong> CountriesAlkire & Santos(positive) part is an interaction term which is the product of the two percent variations. The sum ofthe three bars (the two negatives plus the positive) gives the total percent variation in the MPI.In Ghana, the impressive reduction in MPI was mainly driven by a huge reduction in H, whichdecreased from 57 percent to 31 percent, that is a 44 percent reduction. However, the reduction inA is not negligible either: in 2003 the poor in Ghana were deprived on average in 52 percent of theweighted indicators, whereas in 2008 they were deprived in 46 percent of the weighted indicators(that is a reduction of 11 percent). In Bangladesh, the MPI reduction was also mainly driven by thereduction in H, which went from 69 percent to 58 percent – a reduction of 16 percent. A had areduction of only 7 percent: in 2004 the poor were deprived on average in 54 percent of theweighted indicators, while in 2007 this became 50 percent. Ethiopia´s path is different. In thiscountry the reduction of the MPI between 2000 and 2005 was mainly driven by a reduction in thenumber of deprivations the poor experience, which went from 73 percent to 65 percent – areduction of 12 percent – while H was reduced only by 4 percent (decreasing from 94 percent to 90percent).10%0%-10%Bangladesh Ethiopia Ghana-20%-30%-40%-50%-60%Percent Variation in H (Δ%H)Interaction term (Δ%H* Δ%A)Percent Variation in A (Δ%A)Figure 26: Decomposition of changes in MPI over time in Bangladesh, Ethiopia and GhanaThe previous analysis at the aggregate country level can be enriched by zooming-in to the regions ofeach country. Figure 27 is of the same type as Figure 26, but it compares the percent changes in MPIand its components in each country as a whole with changes occurring in rural and urban areas. Thegraph suggests two main results: (a) in all three countries poverty reduction was larger in urban areasthan in rural ones with the difference between the reductions in the two areas being particularlystriking in Ethiopia and (b) the reduction in MPI in the rural areas of each country was a result of areduction in H and A, as analysed at the aggregate level. However, the regional patterns do notnecessarily follow the aggregate one: in Ghana and Bangladesh, the pattern of a relatively largerreduction in H is observed both in urban and rural areas, coincident with the aggregate one. This isalso the pattern exhibited by the urban areas of Ethiopia, but it differs from the pattern in the ruralareas and nation as a whole, where the reduction was driven by a relatively larger reduction of A.www.ophi.org.uk July 2010 55
<strong>Acute</strong> <strong>Multidimensional</strong> <strong>Poverty</strong>: A <strong>New</strong> <strong>Index</strong> <strong>for</strong> <strong>Developing</strong> CountriesAlkire & SantosFigure 27: Decomposition of changes in MPI over time in Bangladesh, Ethiopia and GhanaRural and Urban Areas10%0%-10%-20%-30%-40%-50%-60%TotalRuralUrbanTotal-70%Percent Variation in H (Δ%H)Interaction term (Δ%H* Δ%A)RuralUrbanTotalRuralBangladesh Ethiopia GhanaPercent Variation in A (Δ%A)UrbanWorldwide, the incidence (H) of poverty is higher in rural areas than in urban ones. Moreover, innon-urbanized countries this also means that the rural areas are home to a much larger number ofthe poor than urban ones. This is the case in these three countries. The share of the urbanpopulation is 12 percent in Ethiopia, 22 percent in Bangladesh, and 44 percent in Ghana, the mosturbanized country of the three. The MPI estimate is also much higher in rural areas than in urbanones in these three countries. Figure 28 presents the ratio of the rural MPI to the urban one in thethree countries in the two points in time. The MPI of rural areas is 1.5 to 3.5 times larger than inurban areas. The fact that in the three countries urban areas have experienced a larger reduction ofpoverty than rural ones has increased the disparity between the two regions. Clearly, the achievedpoverty reduction represents good progress; the fact that it occurred mostly in urban areas pointsthat policy makers may need to develop complementary policies to address rural poverty. 72Figure 28: Ratio of Rural MPI to Urban MPI in two points in timein Bangladesh, Ethiopia and Ghana4.03.53.02.52.01.51.00.50.0Ratio Rural to Urban MPI2004 2007 2000 2005 2003 2008Bangladesh Ethiopia GhanaOne of the strengths of the MPI is that although it summarizes the in<strong>for</strong>mation on multiple andcoupled deprivations into one single number, it allows the poverty composition to be unpacked,identifying the most prevailing deprivations. A natural question then is which indicators in whichcountries have improved most, causing the reduction in the MPI. Figure 29 presents the percent72 Also note that the reduction of urban poverty will likely accelerate the process of urbanization.www.ophi.org.uk July 2010 56
<strong>Acute</strong> <strong>Multidimensional</strong> <strong>Poverty</strong>: A <strong>New</strong> <strong>Index</strong> <strong>for</strong> <strong>Developing</strong> CountriesAlkire & Santosreduction in the censored headcounts <strong>for</strong> each indicator, that is, the percent reduction in those whoare living in poor households deprived in each specific indicator. There we can see that inBangladesh it was a reduction in child school attendance deprivations which contributed most to thedecrease in the MPI. In Ethiopia, on the other hand, the improvement in nutrition and access todrinking water were the main contributors to the MPI reduction. Ghana’s progress was driven byoutstanding improvements in child school attendance, mortality, and nutrition, but the reduction inthe other deprivations was also very important.Percent Variation in each deprivation of thepoor0%‐10%‐20%‐30%‐40%‐50%‐60%Figure 29: Changes in deprivation in each indicatorBangladesh, Ethiopia and GhanaBangladesh Ethiopia GhanaAssetsCooking FuelFloorWaterSanitationElectricityNutritionMortalitySchool AttendanceSchooling‐70%4.7 Robustness of country rankings to changes in indicators’ cutoffsA natural question is the extent to which the country ranking is sensitive to small changes in thecutoffs. This is a concern, since some earlier work (Batana, 2008, Alkire & Seth, 2008) havesuggested that the adjusted headcount is more sensitive to changes in cutoffs than to changes in thek value. This makes sense given the supposed distribution of deprivations around the cutoffs.There is a legitimate diversity of judgments regarding what would or would not count as adeprivation in a number of indicators. If small changes in the cutoff would lead to a considerable rerankingof countries, this would compromise the power of the MPI. To test the sensitivity of theMPI to the indicator´s cutoffs, we implemented different versions of the MPI, drawing on a rangeof ways of setting the cutoff. In particular we investigate a) three different measures of childnutrition and a different reference population; b) using mortality with and without age restrictions<strong>for</strong> the deceased child; c) the addition of an indicator on child school attendance versus using yearsof education only; d) using water alone or also including time to water; and e) using much higherliving standard poverty lines <strong>for</strong> water (requiring piped water), sanitation (requiring flush toilet) andfloor (considering the household deprived if it has a dirt/sand floor or palm bamboo/wood planks)in comparison to the best approximation to the MDG cutoffs that data allow.The case of nutrition deserves some detailed explanation. As it was mentioned in the Data section,there exist three nutritional indicators <strong>for</strong> children: weight-<strong>for</strong>-age, weight-<strong>for</strong>-height and height-<strong>for</strong>age,measured in standard deviations (SD) from the median of the reference population (z-scores).Children who are two or more SD below the mean of the reference population are consideredwww.ophi.org.uk July 2010 57
<strong>Acute</strong> <strong>Multidimensional</strong> <strong>Poverty</strong>: A <strong>New</strong> <strong>Index</strong> <strong>for</strong> <strong>Developing</strong> CountriesAlkire & Santosunderweight, in wasting and stunting correspondingly. 73 Each of these indicators captures a differentaspect of malnutrition. In particular, the wasting indicator reflects a recent process of weight lossusually associated with starvation, while stunting reflects cumulative deficiencies in growthassociated with long-term factors such as chronically insufficient daily protein intake. Theunderweight indicator is a combination of the other two. In addition to the differences betweenindicators, as mentioned in the Data section, the reference population (on which the median iscalculated) has recently been changed by the WHO. DHS and MICS z-scores <strong>for</strong> children arecalculated using the old reference population which consisted only of US children. We haveestimated our own z-scores using the new reference population, which constitutes a standard ofwell-nourishment rather than a mere reference and includes children from different ethnicities.However, we per<strong>for</strong>med MPI estimations with both reference populations and we found that itmade no significant difference <strong>for</strong> the MPI. Appendix 4 plots the Cumulative Distribution Function(CDF) <strong>for</strong> the three nutritional indicators using the two different reference populations in India andMali. Clearly, the difference in the reference population produces important differences in thenumber of children considered to have deficient nutrition (look at the cumulative areas below eachCDF, from the left and up of -2SD). This has previously been noted by Klasen (2008). To illustratethis clearly, Figure 30 below reports the percent of children under five years of age withunderweight, wasting, and stunting in India and Mali <strong>for</strong> each reference population. In all, thepercentage of children with wasting is the lowest; in the new reference population <strong>for</strong> z-scores, thenumber of stunted children is highest in Mali whereas according to the previous referencepopulation, more children are underweight in India.Figure 30: Underweight, Stunting and Wasting in India and Mali using different reference populationsIndia (DHS 2005) Mali (DHS 2006)Percent of under5 children with low:NCHS/WHO(Old Reference)MGRS (WHO)(<strong>New</strong> Reference)NCHS/WHO(Old Reference)MGRS (WHO)(<strong>New</strong> Reference)Weight-<strong>for</strong>-Age43% 39% 32% 28%(Underweight)Weight-<strong>for</strong>-Height 16% 18% 14% 16%(Wasting)Height-<strong>for</strong>-Age39% 44% 34% 38%(Stunting)“Low” refers to lower than -2SD from the median of the reference population.Own estimations. The small differences from the DHS Reports are due to the fact that these particularestimates were not weighted with the survey weights.However, despite these differences in the traditional nutritional estimates obtained with eachreference population, our estimates are not sensitive to these variations. This is because a) our basepopulation is not just the children but includes adult women in the DHS, and we count as deprivedall members in a household with an undernourished child or women; b) we are considering jointdeprivations: it is not enough <strong>for</strong> someone to live in a household with an undernourished child to beconsidered multidimensionally poor. She needs to be deprived in at least one other health oreducational indicator, or in three living standard indicators. Here as elsewhere, we find thatscrutinizing joint deprivations not only reveals the character of poverty but also, practically,improves the accuracy of the measure by diminishing its sensitivity to potential inaccuracies in anysingle indicator.73 If they are below minus three SD, they are severely underweight, wasted, or stunted, correspondingly.www.ophi.org.uk July 2010 58
<strong>Acute</strong> <strong>Multidimensional</strong> <strong>Poverty</strong>: A <strong>New</strong> <strong>Index</strong> <strong>for</strong> <strong>Developing</strong> CountriesAlkire & SantosIn terms of the different nutritional indicators, when stunting rather than underweight is used, MPItends to be higher (the average increment is 0.011) and it ranges from a negative difference of 0.015in Guinea and Senegal (the only two countries with a lower MPI when stunting is used), to adifference of 0.04 in Zambia, Kyrgyzstan, Malawi and the Central African Republic. Alternatively,when wasting is used rather than underweight, MPI tends to be lower, with an average reduction of0.008. This reduction is highest in Laos (0.065) and smallest in Serbia (0.0025).Despite the mentioned absolute differences in MPI, neither the change in the reference populationnor the change in the children´s nutritional indicators produces a significant change in the ranking ofthe countries. All correlation coefficients (Pearson, Spearman and Kendall Tau b) between thereported MPI, which uses the underweight indicator and the new reference population, and threealternative MPIs, one using stunting, another using wasting, and another using underweight but withthe old reference population, are above 0.96. (See Tables in Appendix 5)We also checked the sensitivity of our mortality indicator by estimating an alternative MPI, using theunder-5-years-of-age mortality indicator <strong>for</strong> those countries in which this is available. This does notchange the estimates significantly: the biggest difference in MPI values is 0.04, with MPI higherwhen the non-age-specific mortality indicator was used in the case of Somalia <strong>for</strong> a k value of 6, andthe opposite <strong>for</strong> the case of Liberia with k=5. The correlation between the rankings of the twomeasures is 0.97 or higher depending on the correlation coefficient. Also, because both ournutritional and mortality indicators differ from traditional ones, we calculated the correlationsbetween the censored headcounts on mortality and nutrition with a WHO indicator called the“Healthy Life Expectancy at Birth (HALE)”. This indicator is defined as the average number ofyears that a person can expect to live in "full health" by taking into account years lived in less thanfull health due to disease and/or injury. This indicator adds up life expectancy <strong>for</strong> different healthstates, adjusted by severity distribution making it sensitive to changes over time or differencesbetween countries in the severity distribution of health states. 74 We found Spearman correlationcoefficients of -0.78 with the censored headcount on mortality and -0.73 with the censoredheadcount on nutrition, and we found coefficient of -0.81 with the MPI. These correlations suggestthat, despite not being the conventional ones, our indicators on health deprivations are capturing illhealth as defined by these indicators quite accurately.Appendix 5 presents three sets of correlation coefficients between the estimates of the differentversions of the MPI regarding the poverty cutoffs, as enumerated (a) to (e) at the beginning of thissection. In sum, all Kendall’s Tau correlations are above 0.87, and all Spearman’s rank correlationsexceed 0.97, which suggest that the rankings are relatively robust.4.8 Robustness of country rankings to changes in the poverty cutoff 75Like the single dimensional cutoff vector z, the choice of the cross-dimensional cutoff k, that is, thesum of weighted indicators in which a household must be deprived to be identified as poor, isnormative. In the MPI k can vary from 0.56, which is the smallest indicator weight (correspondingto any of the living standard variables) to 10, the total number of indicators considered. Note that k=0.57 would require being deprived in merely one living standard indicator to be considered poor.74 For further in<strong>for</strong>mation and calculation methods please visithttp://www.who.int/whosis/indicators/2007HALE0/en/75 We are grateful to Yele Batana <strong>for</strong> per<strong>for</strong>ming the robustness analysis presented in this section.www.ophi.org.uk July 2010 59
<strong>Acute</strong> <strong>Multidimensional</strong> <strong>Poverty</strong>: A <strong>New</strong> <strong>Index</strong> <strong>for</strong> <strong>Developing</strong> CountriesAlkire & SantosEven k=1 seems a rather meager cutoff both empirically and normative: the deprivations in oneindicator of health or education or two of living standard may not represent poverty. The normativeargument is that while a household may have one shortfall by choice (<strong>for</strong> example cooking withwood or having a very trim figure), it is more likely that households with multiple deprivations inthese very primitive indicators have not chosen these. The empirical reason is that individually eachindicator may not be a perfect proxy <strong>for</strong> one aspect of poverty. On the other extreme, above k=4,poverty becomes zero in the less poor countries and there<strong>for</strong>e the estimates become irrelevant inthose countries. Thus, in the MPI, the range of plausible values <strong>for</strong> k is quite limited. It clearlyincludes k=2, and k=3, and might include k=4 <strong>for</strong> the poorest countries.An important empirical question is how sensitive the country rankings are to changes in this kcutoff, at least <strong>for</strong> the range of relevant values. Other studies (Batana, 2009) have found that manycomparisons are relatively robust to changes in k, especially over some subset of reasonable values.Following that study, we have per<strong>for</strong>med some basic dominance analysis. Given two countries, Aand B, we say that B dominates A if A’s MPI is greater or equal B’s MPI <strong>for</strong> all k values, and isstrictly greater <strong>for</strong> at least one k value. That is, B has lower poverty than A regardless of the k-cutoff.Such tests were per<strong>for</strong>med among countries grouped by UN region and then all countries together.Countries with less than 9 indicators (only a few) were excluded from this analysis.Within the Sub-Saharan African countries it was found that in 97 percent of the total possible pairsof African countries, there is a dominance relation when k varies from 2 to 4, meaning that onecountry is unambiguously less poor than another, independently of whether we require people to bedeprived in 20, 30 or 40 percent of the weighted indicators. To see some graphical examples, Figure31 plots the MPI value (vertical axis) <strong>for</strong> each possible k value (in the graph from k=1 to k=10,horizontal axis) <strong>for</strong> different countries in the UN regions. 76 In the first graph <strong>for</strong> Sub Saharan Africa,there are three sets of two countries: Ghana and Zimbabwe, which are among the least poor groupwithin the Sub-Saharan African set of countries; Niger and Burkina Faso, among the poorest in theregion (and in the overall ranking), and Nigeria and Senegal, with MPI values somewhere in betweenthese other two groups. The figure indicates that Ghana and Zimbabwe are unambiguously less poorthan Nigeria and Senegal <strong>for</strong> all k values, which in turn are unambiguously less poor than Niger andBurkina Faso. This is seen in that the curves lay one below the other indicating lower poverty.Moreover, <strong>for</strong> k
<strong>Acute</strong> <strong>Multidimensional</strong> <strong>Poverty</strong>: A <strong>New</strong> <strong>Index</strong> <strong>for</strong> <strong>Developing</strong> CountriesAlkire & Santospercent of the possible pairs of countries have a dominance relation when k varies from 1 to 10, and94 percent when we restrict it to k from 2 to 4. Somalia is undeniably the poorest country here,being dominated by all others. In East Asia and the Pacific, there is dominance in 73 percent of thepossible pairs of countries when k varies from 1 to 10, with Thailand dominating the otherconsidered countries, Cambodia and Lao being the unambiguously poorest (although between themthere are crossings) and China, Indonesia and Mongolia lying somewhere in the middle. In the LatinAmerica and Caribbean region, 80 percent of the possible country pairs have a dominance relationwhen k varies from 1 to 10, and 91.5 percent have a dominance relation when k varies from 2 to 4.In the examples in the graph of Figure 31 we see that Belize dominates Colombia, which dominatesthe Dominican Republic, which in turn dominates Peru, which dominates Bolivia which dominatesHaiti, all these <strong>for</strong> k
<strong>Acute</strong> <strong>Multidimensional</strong> <strong>Poverty</strong>: A <strong>New</strong> <strong>Index</strong> <strong>for</strong> <strong>Developing</strong> CountriesAlkire & SantosFigure 31: Examples of Robustness to the k-cutoff <strong>for</strong> countries by UN RegionsSub-Saharan AfricaSouth AsiaMPI20.1 0.2 0.3 0.4 0.5 0.6NigerNigeriaGhanaBurkinaSenegalZimbabweMPI20.05 0.10 0.15 0.20 0.25 0.30 0.35 0.40 0.45 0.50MauritaniaNigeriaComorosRwandaSenegalMalawiMPI20.05 0.10 0.15 0.20 0.25 0.30 0.35 0.40BangladeshNepalPakistanIndiaSri Lanka1 2 3 4 5 6 7 8 9 10Cutoff k1 2 3 4 5 6 7 8 9 10Cutoff k1 2 3 4 5 6 7 8 9 10Cutoff kArab States East Asia and the Pacific Latin America and the CaribbeanMPI20.1 0.2 0.3 0.4 0.5DjiboutiMoroccoSyrian Arab RepublicUnited Arab EmiratesTunisiaJordanIraqSomaliaEgyptMPI20.05 0.10 0.15 0.20 0.25 0.30ThailandMongoliaIndonesiaCambodiaChinaLaoMPI20.05 0.10 0.15 0.20 0.25 0.30 0.35BoliviaDominican RepublicPeruColombiaHaitiBelize1 2 3 4 5 6 7 8 9 10Cutoff kCentral and Eastern Europe and the CIS1 2 3 4 5 6 7 8 9 10Cutoff k1 2 3 4 5 6 7 8 9 10Cutoff kMPI20.025 0.050 0.075 0.100 0.125 0.150KyrgyzstanUzbekistanAzerbaijanTajikistanSerbia1 2 3 4 5 6 7 8 9 10Cutoff kwww.ophi.org.uk July 2010 62
<strong>Acute</strong> <strong>Multidimensional</strong> <strong>Poverty</strong>: A <strong>New</strong> <strong>Index</strong> <strong>for</strong> <strong>Developing</strong> CountriesAlkire & Santos4.9 Robustness of country rankings to changes in the indicators’weightsAs explained in Section 2.4, the MPI has a structure of nested weights in which each ofthe three dimensions receives an equal relative weight of 1/3 and each of the indicatorswithin each dimension receives an equal weight. Clearly, as the other normative choicesmade, the particular selection of weights requires a robustness check to see, in this case,whether the MPI is robust to a plausible range of weights. We have there<strong>for</strong>e estimatedthe MPI with other three alternative weighting structures giving 50 per cent of therelative weight to one of the three dimensions and 25 per cent to each of the other two. 77Changing the indicators’ weights changes the poverty estimates. However, the countryrankings generated are robust to such changes. We calculate the correlation coefficientsbetween each pair of rankings using three different methods: Pearson’s correlationcoefficient, Spearman’s rank correlation coefficient and Kendall’s rank correlationcoefficient (Tau-b). Results are presented in the last table of Appendix 5. There it can beseen that the correlation between the country rankings obtained with the baseline ofequal weights and that obtained with the other three alternatives is 0.90 (using KendallTaub) or higher. Interestingly, the correlation of the rankings obtained with the threealternative weighting systems is also high. For example the Kendall Tau b coefficientbetween the ranking obtained assigning 50 per cent of relative weight to education andthe one obtained assigning 50 per cent of weight to health is 0.83, and that is the lowestcorrelation coefficient. 78As a second – related – exercise we compared <strong>for</strong> all possible pairs of countries the MPIestimate across the four different weighting structures and found that in 88 per cent ofthe total possible pairs one country has higher poverty than the other regardless of theweighting system. 79In summary, we can say that while the weighting structure affects the magnitude of eachcountry poverty estimate, the relative position of each country with respect to others ishighly robust to changes in the indicators’ weights.77 In such way, in one of the alternative weightings each of the educational indicators weight 25 per cent,each of the health indicators 12.5 per cent and each of the living standard indicators 4.16 per cent. In theother, each of the health indicators weights 25 per cent, each of the two education indicators weights 12.5per cent and the living standard indicators the same as above. Finally, in the weighting structure that giveshigher weight to living standard, each of these indicators weights 8.33 per cent and each of the health andeducation indicators weights 12.5 per cent.78 Alkire et al (2010) estimate the same correlation coefficients <strong>for</strong> the different sub-groups of countries,namely, the bottom 75 countries and also classifying them by survey (only DHS countries, only MICScountries, only WHS countries). They find that the country estimates that are less robust are those obtainedusing the World Health Survey. Still, even in that case, the correlation of the MPI with the alternativeweights with that using the equal weighting is 0.63 or higher. They also look at measures of concordanceand per<strong>for</strong>m a test of rank independence, with favorable evidence towards the robustness of the MPI.79 Because they are 104 countries, there are 5356 possible pairs. Of that total, in 4740 pairs one country hasa dominant relation over the other independently of the weighting structure.www.ophi.org.uk July 2010 63
<strong>Acute</strong> <strong>Multidimensional</strong> <strong>Poverty</strong>: A <strong>New</strong> <strong>Index</strong> <strong>for</strong> <strong>Developing</strong> CountriesAlkire & Santos5. CONCLUDING REMARKSThe MPI represents significant progress in the measurement of poverty in aninternationally comparable way. It shifts attention from solely income to include otherintrinsically important dimensions. To measure these, the MPI makes the best use ofindicators of functionings available. When this has not been possible, the MPI includesindicators of means closely linked to essential functionings. By using micro-data, itidentifies people with coupled disadvantages, in other words, the 1,659 million poorestpoor of the developing world.The obtained results are intuitive. Sub-Saharan Africa has the highest poverty incidence;South Asia the highest number of people living in poverty. The Arab States and EastAsia and the Pacific follow after these two, both in incidence and number. Next are LatinAmerica and the Caribbean, and the least poor region, Europe and Eastern Europe andthe Commonwealth of Independent States (CIS). But even in the relatively less poorregions, there are several million people experiencing acute poverty.Coupled deprivations in the living standard indicators, namely access to safe water,improved sanitation, non-biomass cooking fuel, electricity, non-dirt floor, and a fewassets are, in general, the most widespread. However, this is only in relative terms: manycountries have unacceptably high proportions of poor people with health and educationdeprivations (as measured by malnutrition or mortality and years of education or childrennot attending school). These are very broad world-wide conclusions. Each countrydeserves an analysis that thoroughly scrutinizes the particular clustering of deprivationsas well as the geographical, religious, and ethnic distribution of poverty.We also have found evidence that indicates that the poor people identified by the MPIare not necessarily the same as the poor people identified by international incomepoverty criteria. The overlap is far from perfect, especially in the poorest countries. Thisreaffirms the need <strong>for</strong> an internationally comparable multidimensional poverty index tocomplement income poverty measures. This is a gap the MPI intends to fill.We have stated that developing countries in higher stages of development would need avariant of the MPI, with different indicators and/or cutoffs to reveal the type ofdeprivations experienced there. Including indicators on employment, quality ofeducation, empowerment, and using higher cutoffs <strong>for</strong> the living standard variables arepossibilities <strong>for</strong> such a variant version. This is not to say that these other dimensions arenot important in the less developed countries (there, it is a matter of missing data). Nor isit the case that we should change the cutoffs <strong>for</strong> the least developed countries. The MPIis an index of acute poverty, and that is what it reflects. Its possible variant would reflecta different type of poverty and would be relevant in medium and high humandevelopment countries.We are fully aware of the limitations of the MPI, and we advocate improving datacollection in the developing world to overcome these issues. The limitations areessentially in terms of cross-country/survey comparability, as was outlined in the datasection. Without intending to minimize these limitations, it is however important torealize that all internationally comparable empirical studies face similar challenges andthere<strong>for</strong>e require a number of assumptions. We have minimized truly ‘heroic’www.ophi.org.uk July 2010 64
<strong>Acute</strong> <strong>Multidimensional</strong> <strong>Poverty</strong>: A <strong>New</strong> <strong>Index</strong> <strong>for</strong> <strong>Developing</strong> CountriesAlkire & Santosassumptions and have been unusually explicit in articulating the limitations as well as thestrengths of the MPI. We understand these estimates as the first step in revealing a moreaccurate portrait of poverty in the world, highlighting the very high deprivation levels incore dimensions.We also wish to emphasise that, despite data limitations, the MPI is a robust measureboth axiomatically and empirically. Axiomatically its mathematical structure – that of theM 0 measure of the Alkire and Foster method – satisfies a number of properties that arewidely regarded as desirable in the poverty measurement literature. It also handles ordinalvariables in a technically sound way (although ordinal variables impede our ability toevaluate the depth of poverty using MPI). Its empirical robustness derives from the factthat the reported MPI has been chosen from a set of alternative versions that wereestimated using different dimensional cutoffs and indicators. The country rankings thatthese different versions produce are very highly correlated. Also, stochastic dominanceanalysis suggests that our results are also robust to changes in the cross-dimensionalcutoff k, that is, in the weighted number of deprivations we require a person to bedeprived in order to be considered poor. In the near future we will work onbootstrapping the results (although given the sample sizes we expect the confidenceintervals to be very small).The MPI has tremendous practical potential <strong>for</strong> tracking the MDGs. Eight of the tenindicators are directly linked to the MDGs. Two of them (water and cooking fuel) areexactly the same indicators proposed to monitor progress. Our sanitation indicator is abit more demanding as it requires the improved sanitation not to be shared. Theindicator on years of schooling, child school attendance, nutrition, and mortality areclosely related to those selected as MDG indicators. The only difference is that the basepopulation of the MPI is the household, so all members are counted as deprived or notin these indicators, depending on the achievements of the household members. Floorand electricity are the only indicators not explicitly listed as MDG indicators. However,they are closely related to MDG 7 – Achieve Environmental Sustainability. Hence,progress in the MPI means advancement towards the MDGs. Moreover, as exemplifiedin this paper, the MPI allows analysts to identify the high impact causal pathways bywhich such progress is made. For example, what dimensions or combinations ofdimensions reduce poverty the most? This in<strong>for</strong>mation will help to in<strong>for</strong>m the focus andsequencing of policies to reduce the MDGs.www.ophi.org.uk July 2010 65
<strong>Acute</strong> <strong>Multidimensional</strong> <strong>Poverty</strong>: A <strong>New</strong> <strong>Index</strong> <strong>for</strong> <strong>Developing</strong> CountriesAlkire & SantosReferencesAlkire, S. (2007). ‘The Missing Dimensions of <strong>Poverty</strong> Data: An Introduction’, Ox<strong>for</strong>dDevelopment Studies, 35(4), 347-359.Alkire, S. (2008). ‘Choosing Dimensions: The Capability Approach and <strong>Multidimensional</strong><strong>Poverty</strong>.’ In Kakwani, Nanak and Jaques Silber eds, The Many Dimensions of <strong>Poverty</strong>, p89−119. Basingstoke: Palgrave-MacMillanAlkire, S., & Eli, K.(2010). ‘<strong>Multidimensional</strong> poverty in developing countries: a measureusing existing international data’, mimeo, Ox<strong>for</strong>d <strong>Poverty</strong> and Human DevelopmentInitiative, Ox<strong>for</strong>d Department of International Development, University of Ox<strong>for</strong>d.Alkire, S., & Foster, J. (2007). ‘Counting and <strong>Multidimensional</strong> <strong>Poverty</strong> Measurement’, Ox<strong>for</strong>d<strong>Poverty</strong> and Human Development Initiative, Working Paper No. 7, Ox<strong>for</strong>d Department ofInternational Development, University of Ox<strong>for</strong>d.Alkire, S., & Foster, J. (2009). ‘Counting and <strong>Multidimensional</strong> <strong>Poverty</strong>’, In Von Braun J.(Ed.) The Poorest and Hungry: Assessment, Analysis and Actions. Washington D.C.:International Food Policy Research Institute.Alkire, S., & Ibrahim, S. (2007). ‘Agency & Empowerment: A Proposal <strong>for</strong> InternationallyComparable Indicators’, Ox<strong>for</strong>d Development Studies, 35(4), 379-403.Alkire, S. , Santos, M. E., Seth S. and Yalonetzky, G. (2010), ‘Is the <strong>Multidimensional</strong> <strong>Poverty</strong><strong>Index</strong> robust to different weights?’, <strong>OPHI</strong> RP. No 22a.Alkire, S., & Seth, S. (2008). ‘<strong>Multidimensional</strong> <strong>Poverty</strong> and BPL Measures in India: Acomparison of Methods’, Ox<strong>for</strong>d <strong>Poverty</strong> & Human Development Initiative (<strong>OPHI</strong>) WorkingPaper 15, Ox<strong>for</strong>d Department of International Development, University of Ox<strong>for</strong>d.Apablaza, M., Ocampo, J.P., & Yalonetzky, G. (2010). ‘Decomposing Changes in<strong>Multidimensional</strong> <strong>Poverty</strong> in 10 Countries’, mimeo, Ox<strong>for</strong>d <strong>Poverty</strong> and HumanDevelopment Initiative, Ox<strong>for</strong>d Department of International Development, Universityof Ox<strong>for</strong>d.Atkinson, A. 2003. ‘<strong>Multidimensional</strong> deprivation: Contrasting social welfare and countingapproaches’, Journal of Economic Inequality, 1(1), 51-65.Atkinson, A. B., Cantillon, B, Marlier, T., Nolan, B. (2002). Social indicators: The EU and socialinclusion. Ox<strong>for</strong>d: Ox<strong>for</strong>d University Press.Baker, J., Basu, R., Cropper, M., Lall, S., & Takeuchi, A. (2005). ‘Urban <strong>Poverty</strong> andTransport: The Case of Mumbai’, World Bank Policy Research Working Paper, 3693.Balakrishnan, K., Sambandam, S., Ramaswamy, P., Mehta, S., & Smith, K.R. (2004).‘Exposure Assessment <strong>for</strong> Respirable Particulates Associated with Household Fuel Usein Rural Districts of Andhra Pradesh, India’, Journal of Exposure Analysis and EnvironmentalEpidemiology, 14, S14-S25.Basu, K., & Foster, J. (1998). ‘On Measuring Literacy’, Economic Journal. 108(451), 1733–49.Batana, Y. (2009). ‘<strong>Multidimensional</strong> Measure of <strong>Poverty</strong> in Sub Saharan Africa’, Ox<strong>for</strong>d <strong>Poverty</strong>and Human Development Initiative (<strong>OPHI</strong>) Working Paper, No. 13, Ox<strong>for</strong>d Department ofInternational Development, University of Ox<strong>for</strong>d.Billig, P., Bendahmane, D., & Swindale, A. (1999). ‘Water and Sanitation IndicatorsMeasurement Guide’, Food and Nutrition Technical Assistance, USAID.Boadi, K.O., & Kuitunen, M. (2005). ‘Factors Affecting the Choice of Cooking Fuel, CookingPlace and Respiratory Health in the Accra Metropolitan Area, Ghana’, Journal of BiosocialScience, 38, 403-412.Bosch, C., Hommann, K.., Rubio, G.M., Sadoff, C., & Travers, L. (2001). ‘Water, Sanitationand <strong>Poverty</strong>: Draft <strong>for</strong> Comments’, <strong>Poverty</strong> Reduction Strategy Sourcebook. The World Bank:Washington, D.C.Boschi-Pinto, C., Velebit, L., & Shibuya, K. (2008). ‘Estimating Child Mortality Due toDiarrhoea in <strong>Developing</strong> Countries’, Bulletin of the World Health Organization, 86, 710-717.www.ophi.org.uk July 2010 66
<strong>Acute</strong> <strong>Multidimensional</strong> <strong>Poverty</strong>: A <strong>New</strong> <strong>Index</strong> <strong>for</strong> <strong>Developing</strong> CountriesAlkire & SantosBourguignon, F. & Chakravarty, S.R. (2003). ‘The measurement of multidimensionalpoverty’, Journal of Economic Inequality 1(2003), 5–49.Bradshaw, D., & Steyn, K. (2001). ‘<strong>Poverty</strong> and Chronic Diseases in South Africa’, TechnicalReport, MRC South Africa and World Health Organization.Brandolini, A., & D’Alessio, G. (2009).In Chiappero-Martinetti, Enrica ed. Debating GlobalSociety: Reach and Limits of the Capability Approach. Milan: Feltrinelli Foundation.Bruce, J., & Dwyer, D.H., (1988). ‘Introduction’. In A Home Divided: Women and Income in theThird World. Stan<strong>for</strong>d: Stan<strong>for</strong>d University Press, 1-19.Buvinic, M. (1997). ‘Women in <strong>Poverty</strong>: A <strong>New</strong> Global Underclass’, Foreign Policy, Fall, 38-53.Caballero, B. (2005). ‘A Nutrition Paradox – Underweight and Obesity in <strong>Developing</strong>Countries’, <strong>New</strong> England Journal of Medicine, 352(15), 1514-1516.Case, A., Paxson, C., & Ableidinger, J. (2004). ‘Orphans in Africa: Parental Death, <strong>Poverty</strong>and School Enrollment’, Demography, 41(3), 483-508.Caulfield, L.E., Richard, S.A., & Black R.E. (2004). ‘Undernutrition as an Underlying Cause ofMalaria Morbidity and Mortality in Children Less than Five Years Old’, American Journal ofTropical Medicine and Hygiene, 71(2), 55-63.Chen, M.A. (2001). ‘Women in the In<strong>for</strong>mal Sector: A Global View, the Global Movement’,SAIS Review, 21(1), 71-8Chen,S., & Ravallion, M. (2009). ‘Weakly Relative <strong>Poverty</strong>’, World Bank Policy Research WorkingPaper Series, 4844.Chopra, M. (2003). ‘Risk Factors <strong>for</strong> Undernutrition of Young Children in a Rural Area ofSouth Africa’, Public Health Nutrition, 6(7), 645-652.Chowdhury, S., & Squire, L. (2006), ‘Setting Weights <strong>for</strong> Aggregate Indices: An Application tothe Commitment to Development <strong>Index</strong> and Human Development <strong>Index</strong>’, Journal ofDevelopment Studies, 42(5), 761-771.Clarke, R. (2006). ‘Measuring Wealth Across Seven Thai Communities’, WeD Working Papers,ESRC Research Group on Wellbeing in <strong>Developing</strong> Countries, University of Bath.Coudouel, A., Hentschel, J. S., et al. (2002). ‘<strong>Poverty</strong> Measurement and Analysis’.PRFCSourcebook. The World Bank: Washington, D.C.Dasgupta, S., Huq, M., Khaliquzzaman, M., Pandey, K. & Wheeler, D. (2004). ‘Indoor AirQuality <strong>for</strong> Poor Families: <strong>New</strong> Evidence from Bangladesh’, World Bank Policy ResearchWorking Paper, 3393.Decanq, K.., & Lugo, M. A. (2010). ‘Weights in multidimensional indices of well-being:An overview’, CES Discussion Paper, 10.06, Katholieke Universiteit Leuven, Belgium.Deininger, K., & Okidi, J. (2002). Growth and <strong>Poverty</strong> Reduction in Uganda, 1992-2000: Panel DataEvidence. Washington, D.C & Kampala: The World Bank & Economic Research Council.Demographic Health Survey (DHS). (2010). http://www.measuredhs.com/start.cfm , Datasets accessed from January 2010.De Onis, M., Habicht, J.P. (1996). ‘Anthropometric reference data <strong>for</strong> international use:recommendations from a World Health Organization Expert Committee’, AmericanJournal of Clinical Nutrition, 64, 650–658.De Onis, M., Yip, R. (1996). ‘The WHO growth chart: historical considerations and currentscientificIssues’, Bibliotheca Nutritio et Dieta, 53, 74–89.Diprose, R. (2007). ‘Physical Safety and Security: A Proposal <strong>for</strong> Internationally ComparableIndicators of Violence’, Ox<strong>for</strong>d Development Studies. 35(4), 431-456.El-Zanaty, F., & Way, A. A. (2004). Egypt Interim Demographic and Health Survey. Egypt &Maryland: Cairo Ministry of Health and Population, El-Zanaty and Associates, NationalPopulation Council and ORC Macro.El-Zanaty, F. and Way, A.A. (2009). Egypt Demographic and Health Survey 2008. Egypt &Maryland: Cairo Ministry of Health and Population, El-Zanaty and Associates and MacroInternational.www.ophi.org.uk July 2010 67
<strong>Acute</strong> <strong>Multidimensional</strong> <strong>Poverty</strong>: A <strong>New</strong> <strong>Index</strong> <strong>for</strong> <strong>Developing</strong> CountriesAlkire & SantosEncuesta Nacional de Nutricion y Salud. (2005).National Survey on Health andNutrition.Goverment of Argentina.Esrey, S.A. (1996). ‘Water, Waste, and Well-Being: A Multicountry Study’, American Journal ofEpidemiology, 143(6), 608-623.Falkingham, J. & Namazie, C., (2002). Measuring Health and <strong>Poverty</strong>: A Review of Approaches toIdentifying the Poor. London: D. H. S. R. Centre, HSRC.Ferreira, F. H. G., Lanjouw, P., & Neri M. (2003). ‘A Robust <strong>Poverty</strong> Profile <strong>for</strong> Brazil UsingMultiple Data Sources’, Revista Brasileira de Economica, 57(1), 59-92.Ferguson, B., Tandon, A., Gakidou, E., & Murray, C. J. L. (2003). ‘Estimating permanentincome using indicator variables’. In C. J. L. Murray & D. B. Evans (Eds.), Health SystemsPer<strong>for</strong>mance Assessment: Debates, Methods and Empiricism. Geneva: World HealthOrganization.Fiadzo, E. D., Houston, J. E., & Godwin, D. D. (2001). ‘Estimating Housing Quality <strong>for</strong><strong>Poverty</strong> and Development Policy Analysis: CWIQ in Ghana’, Social Indicators Research, 53,137-162.Filmer, D. (2007). ‘If You Build It, Will They Come?: School Availability and SchoolEnrolment in 21 Poor Countries’, Journal of Development Studies, 43(5), 901-928.Filmer, D., & Pritchett, L. H. (2001). ‘Estimating Wealth Effects without Expenditure Data -or Tears: An Application to Educational Enrollment in States of India’, Demography,38(1), 115-132.Filmer, D., & Pritchett, L. (1998). ‘Educational Enrollment and Attainment in India:Household Wealth, Gender, Village, and State Effects’, Journal of Educational Planning andAdministration, 13(2), 135-164.Fotso, J.C. (2006). ‘Child Health Inequities in <strong>Developing</strong> Countries: Differences acrossUrban and Rural Areas’, International Journal <strong>for</strong> Equity in Health, 5(9).Foster, J. E., Greer, J., &Thorbecke, E. (1984). ‘A class of decomposable povertyindices’, Econometrica, 52 (3), 761-66.Foster, J. E., Greer, J., &Thorbecke, E. (2008). ‘Foster-Greer-Thorbecke (FGT) povertymeasures: Twenty five years later’, Journal of Economic Inequality.Foster, J., & Sen, A. (1997). On Economic Inequality with a substantial annexe. (2nd Edition ed.).Ox<strong>for</strong>d: Clarendon Press.Gadgil, A. (1998). ‘Drinking Water in <strong>Developing</strong> Countries’, Annual Review of Energy and theEnvironment, 23, 23-86.Gibson, J. (2001). ‘Literacy and Intrahousehold Externalities’, World Development, 29(1), 155-166.Gordon, D., Nandy, S., Pantazis, C., Pemberton, S., & Townsend, P. (2003). ‘Using MultipleIndicator Cluster Survey (MICS) and Demographic and Health Survey (DHS) Data toMeasure Child <strong>Poverty</strong>’, In UNICEF MICS conference. London School of Economics andUniversity of Bath.Gwatkin, D.R., & Guillot, M. (1999).The Burden of Disease among the Global Poor: CurrentSituation, Future Trends, and Implications <strong>for</strong> Strategy. Washington, D.C.: The World Bank andthe Global Forum <strong>for</strong> Health Research.Gwatkin, D.R., Rutstein, S., Johnson, K., Suliman, E., Wagstaff, A., & Amouzou, A. (2007).‘Socio-Economic Differences in Health, Nutrition, and Population within <strong>Developing</strong>Countries: An Overview’, Country Reports on HNP and <strong>Poverty</strong>. Washington, D.C. : TheWorld Bank.Hacettepe University Institute of Population Studies (HUIPS) (2004). Turkey Demographic andHealth Survey 2003. Ankara: Ministry of Health General Directorate of Mother and ChildHealth and Family Planning, State Planning Organization and European Union.Hahn, H.P., & Kibora, L. (2008). ‘The Domestication of the Mobile Phone: Oral Society andthe <strong>New</strong> ICT in Burkina Faso’, The Journal of Modern African Studies, 46, 87-109.www.ophi.org.uk July 2010 68
<strong>Acute</strong> <strong>Multidimensional</strong> <strong>Poverty</strong>: A <strong>New</strong> <strong>Index</strong> <strong>for</strong> <strong>Developing</strong> CountriesAlkire & SantosHenry, C., Sharma, M. et al. (2000). ‘Assessing the Relative <strong>Poverty</strong> of Microfinance Clients:A CGAP Operational Tool’, Food Consumption and Nutrition Division Working Paper, 111,International Food Policy Research Institute.Hong, R., Banta, J. E, et al. (2006). ‘Relationship between Household Wealth Inequality andChronic Childhood Under-nutrition in Bangladesh’, International Journal <strong>for</strong> Equity in Health,5(15).IDA (2003). ‘IDA Results Measurement System: Update Note’.Operations Policy and CountryServices. International Development Association.Instituto Nacional de Salud Publica. (2006) .National Survey of Health and Nutrition- ENSANUT2006. Government of Mexico.International Institute <strong>for</strong> Population Sciences (IIPS) and Macro International (2007). NationalFamily Health Survey (NFHS-3), 2005-06: India: Volume I. Mumbai: IIPS.Kain, J., Vio, F., & Albala, C., (2003). ‘Obesity Trends and Determinant Factors in LatinAmerica’, Cadernos de Saude Publica, 19(1), S77-S86.Khan, M.M., Hotchkiss, D.R., Berruti, A.A., & Hutchinson, P.L. (2005). ‘GeographicAspects of <strong>Poverty</strong> and Health in Tanzania: Does Living in a Poor Area Matter?’, HealthPolicy and Planning, 21, 110-122.Ki, J. B., Faye, S., et al. (2005). ‘<strong>Multidimensional</strong> <strong>Poverty</strong> in Senegal: A Non-monetary BasicNeeds Approach’, PMMA Working Paper, 2005-05.Klasen, S. (2008), ‘<strong>Poverty</strong>, Undernutrition and Child Mortality: Some Inter-Regional Puzzlesand their Implications <strong>for</strong> Research and Policy’, Journal of Economic Inequality, 6, 89-115.Lambrou, Y., & Piana, G. (2006). Energy and Gender: Issues in Rural Sustainable Development.Rome: Food and Agriculture Organization (FAO).Leng, C.H., Lin, K.G., & Siong, T.E. (1997). ‘Nutritional Assessment of Rural Villages andEstates in Peninsular Malaysia: I. Socio-Economic Profile of Households’, MalaysianJournal of Nutrition, 3, 1-19.Lugo, M.A. (2007). ‘Employment: A Proposal <strong>for</strong> Internationally Comparable Indicator’,Ox<strong>for</strong>d Development Studies, 35(4), 361-378.Marini, A., & Gragnolati, M. (2003). ‘Malnutrition and <strong>Poverty</strong> in Guatemala’, World BankPolicy Research Working Paper, 2967. Latin America and the Caribbean Region, HumanDevelopment Sector Unit, The World Bank.Marmot, M. (2005). ‘Social Determinants of Health Inequalities’, Lancet, 365, 1099-1104.Monteiro, C.A., Moura, E.C., Conde, W.L., & Popkin, B.M. (2004). ‘Socioeconomic Statusand Obesity in Adult Populations of <strong>Developing</strong> Countries: A Review’, Bulletin of theWorld Health Organization, 82(12), 940-946.Montgomery, M. R. (2009). ‘Urban <strong>Poverty</strong> and Health in <strong>Developing</strong> Countries’, PopulationBulletin, 64(2).Montgomery, M. R., Gragnolati, M., Burke, K., & Paredes, E. (2000). ‘Measuring LivingStandards with Proxy Variables’, Demography, 37(2), 155-174.Montgomery, M.R., & Hewett, P.C. (2005). ‘Urban <strong>Poverty</strong> and Health in <strong>Developing</strong>Countries: Household and Neighborhood Effects’, Demography. 42(3), 397-425.Muller, O., & Krawinkel, M. (2005). ‘Malnutrition and Health in <strong>Developing</strong> Countries’,Canadian Medical Association Journal, 173(3), 279-286.Multiple Cluster Indicator Survey (MICS). (2010). http://www.childinfo.org/mics.html , Datasets accessed from January 2010,NIS (National Institute of Statistics) Cambodia and ORC Macro (2006). Cambodia Demographicand Health Survey 2005. Phnom Penh, Cambodia, and Calverton, Maryland: NationalInstitute of Public Health, National Institute of Statistics and ORC Macro.NPC and ORC Macro (2004). Nigeria Demographic and Health Survey 2003. Calverton, Maryland:National Population Commission and ORC Macro.Nussbaum, M. (2003). ‘Capabilities as Fundamental Entitlements: Sen and Social Justice’,Feminist Economics, 9(2/3), 33-59.www.ophi.org.uk July 2010 69
<strong>Acute</strong> <strong>Multidimensional</strong> <strong>Poverty</strong>: A <strong>New</strong> <strong>Index</strong> <strong>for</strong> <strong>Developing</strong> CountriesAlkire & SantosOxaal, Z. (1997). ‘Education and <strong>Poverty</strong>: A Gender Analysis’, Report prepared <strong>for</strong> the GenderEquity Unit, Swedish International Development Cooperation Agency (Sida). No. 53, BRIDGE(Development – Gender), Institute of Development Studies, University of Sussex.Pade, C., Mallinson, B., & Lannon, J. (2005). ‘The Use of In<strong>for</strong>mation and CommunicationTechnologies <strong>for</strong> Rural Development and <strong>Poverty</strong> Alleviation in <strong>Developing</strong> Countries:An Investigation of Gender Specific Agricultural Development’, The Southern AfricanJournal of In<strong>for</strong>mation and Communication, 6, 4-21.Patrick, E. (2006). Beyond Firewood: Fuel Alternatives and Protection Strategies <strong>for</strong> Displaced Womenand Girls. <strong>New</strong> York: Women’s Commission <strong>for</strong> Refugee Women and Children.Pelletier, D.L., Frongillo, E.A. Jr., Schroeder, D.G., & Habicht, J.P. (1995). ‘The Effects ofMalnutrition on Child Mortality in <strong>Developing</strong> Countries’, Bulletin of the World HealthOrganization. 73(4), 443-448.Peña, R., Wall, S., & Persson, L.A. (2000). ‘The Effect of <strong>Poverty</strong>, Social Inequity, andMaternal Education on Infant Mortality in Nicarague, 1988-1993’ American Journal ofPublic Health, 90, 64-69.Rehfuess, E. (2006). Fuel <strong>for</strong> Life: Household Energy and Health. Geneva: World HealthOrganization.Rehfuess, E., Tzala, L., Best, N., Briggs, D.J., & Joffe, M. (2009). ‘Solid Fuel Use and CookingPractices as a Major Risk Factor <strong>for</strong> ALRI Mortality among African Children’, Journal ofEpidemiology and Community Health, 63(111), 887-892.Reyles, D.Z. (2007). ‘The Ability to go about Without Shame: A Proposal <strong>for</strong> InternationallyComparable Indicators of Shame and Humiliation’, Ox<strong>for</strong>d Development Studies, 35(4), 405-430.Rice, A.L., Sacco, L., Hyder, A., & Black, R.E. (2000). ‘Malnutrition as an Underlying Causeof Childhood Deaths Associated with Infectious Diseases in <strong>Developing</strong> Countries’,Bulletin of the World Health Organization, 78, 1207-1221.Rutstein, S. O. (2008), ‘The DHS Wealth <strong>Index</strong>: Approaches <strong>for</strong> Rural and Urban Areas’,DHS Working Papers, No.60, Available athttp://pdf.usaid.gov/pdf_docs/PNADN521.pdfRutstein, S.O., & Johnson, K. (2004). ‘The DHS Wealth <strong>Index</strong>’, DHS Comparative Reports, No.6, Calverton, Maryland: ORC Macro.Sahn, D. E., & Stiftel, D. (2003). ‘Exploring Alternative Measures of Welfare in the Absenceof Expenditure Data’, Review of Income and Wealth, 49(4), 463-489.Samman, E. (2007). ‘Psychological and Subjective Well-Being: A Proposal <strong>for</strong> InternationallyComparable Indicators’, Ox<strong>for</strong>d Development Studies, 35(4), 459-486.Santos, M. E. and Ura, K. (2008), ‘<strong>Multidimensional</strong> <strong>Poverty</strong> in Bhutan: Estimates and PolicyImplications’, Ox<strong>for</strong>d <strong>Poverty</strong> and Human Development Initiative (<strong>OPHI</strong>) Working Paper, No.14, Ox<strong>for</strong>d Department of International Development, University of Ox<strong>for</strong>d.Santos, M. E., Lugo, M. A., Lopez-Calva, L. F., Cruces, G., Battiston, D. (2010), ‘Refining theBasic Needs Approach: A <strong>Multidimensional</strong> Analysis of <strong>Poverty</strong> in Latin America’,Research on Economic Inequality, Chapter 1, Vol. 18, <strong>for</strong>thcoming.Scrimshaw, N.S. & SanGiovanni, J.P. (1997). ‘Synergism of Nutrition, Infection, andImmunity: An Overview’, American Journal of Clinical Nutrition, 66, 464S-477S.Sen, A. (1975). Employment, Technology and Development: A Study Prepared <strong>for</strong> the InternationalLabour Office within the Framework of the World Employment Programme. Ox<strong>for</strong>d: ClarendonPress.Sen, A. (1983). ‘Poor, Relatively Speaking’, Economic Papers, 35, 153-169.Sen, A. (1984). ‘The Living Standard’, Ox<strong>for</strong>d Economic Papers, 74-90.Sen, A. (1985). ‘Well-being, agency and freedom: the Dewey lectures 1984’, The Journal ofPhilosophy, 82(4), 169-221.Sen, A. (1987). ‘The standard of living’. In G. Hawthorn (Ed.), The Standard of Living.Cambridge: Cambridge University Press, 1-38.www.ophi.org.uk July 2010 70
<strong>Acute</strong> <strong>Multidimensional</strong> <strong>Poverty</strong>: A <strong>New</strong> <strong>Index</strong> <strong>for</strong> <strong>Developing</strong> CountriesAlkire & SantosSen, A. (1992). Inequality Re-examined. Ox<strong>for</strong>d: Clarendon Press.Sen, A. (1993). ‘Capability and Well-being’, In M. Nussbaum & A. Sen (Eds.), The Quality ofLife. Ox<strong>for</strong>d: Clarendon Press, 30-53.Sen, A. (1996). ‘On the foundations of welfare economics: utility, capability and practicalreason’, In F. Farina, F. Hahn & S. Vannucci (Eds.), Ethics, Rationality, and EconomicBehaviour. Ox<strong>for</strong>d: Clarendon Press, 50-65.Sen, A. (2000). ‘A Decade of Human Development’. Journal of Human Development, 1(1), 17-23.Sen, A. (2004a). ‘Capabilities, Lists, and Public Reason: Continuing the Conversation’, FeministEconomics, 10(3), 77-80.Sen, A. (2004b). ‘Elements of a theory of human rights’, Philosophy and Public Affairs, 234, 315-356.Sen, A. (2008). ‘The economics of happiness and capability’. In L. Bruni, F. Comim & M.Pugno (Eds.), Capability and Happiness. <strong>New</strong> York: Ox<strong>for</strong>d University Press.Smith, A. (1776). An Inquiry into the Nature and Causes of the Wealth of Nations. Ox<strong>for</strong>d:Clarendon.Stromquist, N.P. (1990). ‘Women and Illiteracy: The Interplay of Gender Subordination and<strong>Poverty</strong>’, Comparative Education Review, 34(1), 95-111.Sullivan, C. (2002). ‘Calculating a Water <strong>Poverty</strong> <strong>Index</strong>’, World Development, 30(7), 1195-1210.Sullivan, C.A., Meigh, J.R., Giacomello, A.M., et.al. (2002). ‘The Water <strong>Poverty</strong> <strong>Index</strong>:Development and application at the community scale’, Natural Resources Forum. 27, 189-199.Tronscoso, K., Castillo, A., Masera, O., & Merino, L. (2007). ‘Social Perceptions about aTechnological Innovation <strong>for</strong> Fuelwood Cooking: Case Study in Rural Mexico’, EnergyPolicy, 35, 2799-2810.Uauy, R., Albala, C., & Kain, J. (2001). ‘Obesity Trends in Latin America: Transiting fromUnder- to Overweight’, Journal of Nutrition, 131, 893S-899S.Uganda Bureau of Statistics (UBOS) and Macro International (2007). Uganda Demographic andHealth Survey 2006. Kampala & Calverton, Maryland: UBOS and Macro International.UNICEF (2009). ‘Statistics by Area: Child Survival and Health’. Available online athttp://www.childinfo.org/mortality.htmlUnited Nations (2003). Indicators <strong>for</strong> Monitoring the Millennium Development Goals, <strong>New</strong> York:United Nations.United Nations (2005). The Millennium Development Goals Report 2005. <strong>New</strong> York: UnitedNations.United Nations (2008). The Millennium Development Goals Report 2008. <strong>New</strong> York: UnitedNations.Wagstaff, A. (2000). ‘Socioeconomic Inequalities in Child Mortality: Comparisons AcrossNine <strong>Developing</strong> Countries’, Bulletin of the World Health Organization, 78(1), 19-29.White<strong>for</strong>d, L.M. (1997). ‘The Ethnoecology of Dengue Fever’, Medical Anthropology Quarterly,11(2), 202-223.Woolard, I. & Leibbrandt, M. (1999). Measuring <strong>Poverty</strong> in South Africa. Cape Town:Development Policy Research Unit (DPRU), University of Cape Town.World Bank (2004). World Development Indicators. Availableat: http://siteresources.worldbank.org/ICPINT/Resources/Table5_7.pdf.WHO Multicentre Growth Reference Study Group.(2006). WHO Child Growth Standards:Length/height-<strong>for</strong>-age, weight-<strong>for</strong>-age, weight-<strong>for</strong>-length, weight-<strong>for</strong>-height and body mass index-<strong>for</strong>-age:Methods and development. Geneva: World Health Organization, 312 pages.WHO Working Group on Infant Growth. (1994). An evaluation of infant growth. Geneva: WorldHealth Organization.World Health Survey. (2010). http://www.who.int/healthinfo/survey/en/index.html , Datasets accessed from January 2010,www.ophi.org.uk July 2010 71
<strong>Acute</strong> <strong>Multidimensional</strong> <strong>Poverty</strong>: A <strong>New</strong> <strong>Index</strong> <strong>for</strong> <strong>Developing</strong> CountriesAlkire & SantosWratten, E. (1995). ‘Conceptualizing Urban <strong>Poverty</strong>’, Environment and Urbanization, 7(11), 11-33.Yu, J. (2008). ‘<strong>Multidimensional</strong> <strong>Poverty</strong> in China: Findings based on CHNS’, Ox<strong>for</strong>d <strong>Poverty</strong>and Human Development Initiative, Working Paper No 16, Ox<strong>for</strong>d Department ofInternational Development, University of Ox<strong>for</strong>d.Zeller, M. & Alcaraz,G. V. (2005). <strong>Developing</strong> and Testing <strong>Poverty</strong> Assessment Tools: Results fromAccuracy Tests in Uganda. Maryland: The IRIS Center, University of Maryland.Zere, E. & McIntyre, D. (2003). ‘Inequities in Under-Five Child Malnutrition in South Africa’,International Journal <strong>for</strong> Equity in Health, 2(7).www.ophi.org.uk July 2010 72
<strong>Acute</strong> <strong>Multidimensional</strong> <strong>Poverty</strong>: A <strong>New</strong> <strong>Index</strong> <strong>for</strong> <strong>Developing</strong> CountriesAlkire & SantosAppendix 1: Tables of Estimation ResultsTable 1.1 MPI Ranks and Income comparisonsThe table ranks 104 countries from low poverty to high poverty, and gives income poverty figures. Please see Section 3.2 <strong>for</strong> countries with missing indicators and differences by surveys.Country Survey YearMPIValue<strong>Multidimensional</strong> <strong>Poverty</strong>MPIRankH(Proportionof poor)A(Averageintensity ofdeprivations)$1.25 a day(Proportion of poor)Income <strong>Poverty</strong>$2 a day(Proportion of poor)National poverty line(Proportion of poor)Value Rank Value Rank Value RankSlovakia † WHS 2003 0.000 1 0.000 0.000 0.168 8Slovenia † WHS 2003 0.000 1 0.000 0.000 0.020 1 0.020 1Czech Republic WHS 2003 0.000 3 0.000 0.467Belarus MICS 2005 0.000 4 0.000 0.351 0.020 1 0.020 1 0.174 9Latvia* WHS 2003 0.001 5 0.003 0.467 0.020 1 0.020 1 0.059 2United Arab Emirates WHS 2003 0.002 6 0.006 0.353Kazakhstan MICS 2006 0.002 7 0.006 0.369 0.020 1 0.020 1 0.154 5Occupied Palestinian Territories MICS 2006 0.003 8 0.007 0.382Georgia MICS 2005 0.003 9 0.008 0.352 0.134 37 0.304 39 0.545 52Hungary WHS 2003 0.003 10 0.008 0.389 0.020 1 0.020 1Bosnia and Herzegovina MICS 2006 0.003 11 0.008 0.372 0.020 1 0.020 1 0.195 11Serbia** MICS 2005 0.003 12 0.008 0.400 0.020 1 0.020 1Albania MICS 2005 0.004 13 0.010 0.381 0.020 1 0.078 18 0.185 10Russian Federation* WHS 2003 0.005 14 0.013 0.389 0.020 1 0.020 1 0.196 13Uruguay WHS 2003 0.006 15 0.017 0.347 0.020 1 0.042 15Thailand MICS 2005 0.006 16 0.016 0.385 0.020 1 0.115 21Montenegro MICS 2005 0.006 17 0.015 0.416 0.020 1 0.020 1Croatia WHS 2003 0.007 18 0.016 0.416 0.020 1 0.020 1 0.111 3Ukraine DHS 2007 0.008 19 0.022 0.357 0.020 1 0.020 1 0.195 12Macedonia MICS 2005 0.008 20 0.019 0.409 0.020 1 0.053 16 0.217 15Armenia DHS 2005 0.008 21 0.023 0.365 0.037 27 0.210 33 0.509 47Moldova DHS 2005 0.008 22 0.022 0.375 0.024 21 0.115 22 0.485 44Uzbekistan MICS 2006 0.008 23 0.023 0.362 0.463 66 0.767 69 0.272 19Ecuador WHS 2003 0.009 24 0.022 0.416 0.047 30 0.128 25 0.383 30Jordan DHS 2007 0.010 25 0.027 0.354 0.020 1 0.035 14 0.142 4Tunisia* WHS 2003 0.010 26 0.028 0.371 0.026 24 0.128 26Argentina ‡ ENNyS 2005 0.011 27 0.030 0.377 0.034 25 0.073 17www.ophi.org.uk July 2010 73
<strong>Acute</strong> <strong>Multidimensional</strong> <strong>Poverty</strong>: A <strong>New</strong> <strong>Index</strong> <strong>for</strong> <strong>Developing</strong> CountriesAlkire & SantosTable 1.1, ContinuedCountrySurveyYearMPIValue<strong>Multidimensional</strong> <strong>Poverty</strong>MPIRankH(Proportionof poor)A(Averageintensity ofdeprivations)$1.25 a day(Proportion of poor)Income <strong>Poverty</strong>$2 a day(Proportion of poor)National poverty line(Proportion of poor)Value Rank Value Rank Value RankSouth Africa* WHS 2003 0.014 28 0.031 0.467 0.262 53 0.429 45 0.220 16Mexico ENSANUT 2006 0.015 29 0.040 0.389 0.040 28 0.082 19 0.470 42Kyrgyzstan MICS 2006 0.019 30 0.049 0.388 0.034 26 0.275 36 0.431 35Trinidad and Tobago MICS 2006 0.020 31 0.056 0.351Sri Lanka* WHS 2003 0.021 32 0.053 0.387 0.140 38 0.397 42 0.227 17Azerbaijan DHS 2006 0.021 33 0.054 0.386 0.020 1 0.020 1 0.496 45Syrian Arab Republic † MICS 2006 0.021 34 0.055 0.375Belize MICS 2006 0.024 35 0.056 0.426Egypt DHS 2008 0.026 36 0.064 0.404 0.020 1 0.184 30 0.167 7Estonia WHS 2003 0.026 37 0.072 0.365 0.020 1 0.020 1Turkey § DHS 2003 0.039 38 0.085 0.459 0.026 23 0.082 20 0.270 18Brazil WHS 2003 0.039 39 0.085 0.460 0.052 32 0.127 24 0.215 14Colombia DHS 2005 0.041 40 0.092 0.441 0.160 41 0.279 37 0.451 37Suriname MICS 2000 0.044 41 0.075 0.588Dominican Republic MICS 2000 0.048 42 0.111 0.433 0.044 29 0.123 23 0.485 43Guyana DHS 2005 0.055 43 0.138 0.397China WHS 2003 0.056 44 0.125 0.449 0.159 40 0.363 41 0.028 1Iraq MICS 2006 0.059 45 0.142 0.413Paraguay WHS 2003 0.064 46 0.133 0.485 0.065 33 0.142 29Mongolia MICS 2005 0.065 47 0.158 0.410 0.022 20 0.136 27 0.361 28Philippines DHS 2003 0.067 48 0.126 0.535 0.226 49 0.450 47Tajikistan MICS 2005 0.068 49 0.171 0.400 0.215 48 0.508 51 0.535 51Viet Nam DHS 2002 0.075 50 0.143 0.525 0.215 47 0.484 50 0.289 22Peru DHS 2004 0.085 51 0.198 0.431 0.077 34 0.185 31 0.516 49Myanmar* MICS 2000 0.088 52 0.142 0.620 0.320 25Indonesia DHS 2007 0.095 53 0.208 0.459 0.294 55 0.600 57 0.167 6Guatemala* WHS 2003 0.127 54 0.259 0.491 0.117 36 0.243 35 0.510 48www.ophi.org.uk July 2010 74
<strong>Acute</strong> <strong>Multidimensional</strong> <strong>Poverty</strong>: A <strong>New</strong> <strong>Index</strong> <strong>for</strong> <strong>Developing</strong> CountriesAlkire & SantosTable 1.1, ContinuedCountry Survey YearMPIValue<strong>Multidimensional</strong> <strong>Poverty</strong>MPIRankH(Proportionof poor)A(Averageintensity ofdeprivations)$1.25 a day(Proportion of poor)Income <strong>Poverty</strong>$2 a day(Proportion of poor)National poverty line(Proportion of poor)Value Rank Value Rank Value RankDjibouti MICS 2006 0.139 55 0.293 0.473 0.188 44 0.412 44Morocco DHS 2004 0.139 56 0.285 0.488 0.025 22 0.140 28Ghana DHS 2008 0.140 57 0.301 0.464 0.300 56 0.536 52 0.285 20Honduras DHS 2006 0.160 58 0.326 0.489 0.182 43 0.297 38 0.507 46Gabon † § DHS 2000 0.161 59 0.354 0.455 0.048 31 0.196 32Zimbabwe DHS 2006 0.174 60 0.385 0.452Bolivia DHS 2003 0.175 61 0.363 0.483 0.117 35 0.219 34 0.377 29Swaziland DHS 2007 0.183 62 0.411 0.444 0.629 79 0.810 75 0.692 59Namibia DHS 2007 0.187 63 0.396 0.472Nicaragua DHS 2001 0.211 64 0.407 0.519 0.158 39 0.318 40 0.458 38Lesotho DHS 2004 0.220 65 0.481 0.458 0.434 63 0.622 60 0.563 54Sao Tome and Principe † MICS 2000 0.236 66 0.516 0.458 0.284 54 0.566 53Cambodia DHS 2005 0.263 67 0.539 0.489 0.258 52 0.578 56 0.301 23Lao MICS 2006 0.267 68 0.472 0.565 0.440 64 0.768 70 0.335 26Republic of Congo DHS 2005 0.270 69 0.559 0.484 0.541 71 0.744 65 0.423 34Pakistan* DHS 2007 0.275 70 0.510 0.540 0.226 50 0.603 59Yemen MICS 2006 0.283 71 0.525 0.539 0.175 42 0.466 48Togo MICS 2006 0.284 72 0.543 0.524 0.387 60 0.693 62Bangladesh DHS 2007 0.291 73 0.578 0.504 0.496 68 0.813 77 0.400 33India DHS 2005 0.296 74 0.554 0.535 0.416 62 0.756 67 0.286 21Cameroon DHS 2004 0.299 75 0.546 0.547 0.328 57 0.577 55 0.399 32Kenya DHS 2003 0.302 76 0.604 0.500 0.197 45 0.399 43 0.466 41Haiti DHS 2006 0.306 77 0.573 0.533 0.549 73 0.721 64Cote d'Ivoire DHS 2005 0.320 78 0.522 0.614 0.233 51 0.468 49Gambia MICS 2006 0.324 79 0.604 0.536 0.343 59 0.567 54 0.613 56Zambia DHS 2007 0.325 80 0.637 0.511 0.643 80 0.815 78 0.680 57Chad WHS 2003 0.344 81 0.629 0.547 0.619 77 0.833 80www.ophi.org.uk July 2010 75
<strong>Acute</strong> <strong>Multidimensional</strong> <strong>Poverty</strong>: A <strong>New</strong> <strong>Index</strong> <strong>for</strong> <strong>Developing</strong> CountriesAlkire & SantosTable 1.1, ContinuedCountry Survey YearMPIValue<strong>Multidimensional</strong> <strong>Poverty</strong>MPIRankH(Proportionof poor)A(Averageintensity ofdeprivations)$1.25 a day(Proportion of poor)Income <strong>Poverty</strong>$2 a day(Proportion of poor)National poverty line(Proportion of poor)Value Rank Value Rank Value RankNepal DHS 2006 0.350 82 0.647 0.540 0.551 74 0.776 73 0.309 24Mauritania* MICS 2007 0.352 83 0.617 0.571 0.212 46 0.441 46 0.463 39Tanzania DHS 2008 0.367 84 0.653 0.563 0.885 90 0.966 90 0.357 27Nigeria DHS 2003 0.368 85 0.635 0.579 0.644 81 0.839 81Senegal DHS 2005 0.384 86 0.669 0.574 0.335 58 0.603 58Malawi DHS 2004 0.384 87 0.723 0.532 0.739 85 0.904 87 0.524 50DR Congo DHS 2007 0.393 88 0.732 0.537 0.592 76 0.795 74 0.713 61Comoros † MICS 2000 0.408 89 0.739 0.552 0.461 65 0.650 61Benin DHS 2006 0.412 90 0.720 0.573 0.473 67 0.753 66 0.390 31Madagascar DHS 2004 0.413 91 0.705 0.585 0.678 83 0.896 84 0.687 58Rwanda DHS 2005 0.443 92 0.814 0.544 0.766 87 0.903 86 0.569 55Angola MICS 2001 0.452 93 0.774 0.584 0.543 72 0.702 63Mozambique DHS 2003 0.481 94 0.798 0.602 0.747 86 0.900 85 0.552 53Liberia DHS 2007 0.484 95 0.839 0.577 0.837 89 0.948 89Sierra Leone MICS 2005 0.489 96 0.815 0.600 0.534 70 0.761 68 0.702 60Guinea DHS 2005 0.505 97 0.824 0.613 0.701 84 0.872 83Central African Republic MICS 2000 0.512 98 0.864 0.593 0.624 78 0.819 79Somalia MICS 2006 0.514 99 0.812 0.633Burundi MICS 2005 0.530 100 0.845 0.627 0.813 88 0.934 88Burkina Faso MICS 2006 0.536 101 0.826 0.649 0.565 75 0.812 76 0.464 40Mali DHS 2006 0.564 102 0.871 0.647 0.514 69 0.771 71Ethiopia DHS 2005 0.582 103 0.900 0.647 0.390 61 0.775 72 0.442 36Niger DHS 2006 0.642 104 0.927 0.693 0.659 82 0.856 82Columns 7, 9 and 11: World Bank (2009). 'World Development Indicators '. Washington DC: World Bank. Income poverty figures correspond to the latest estimate available, of the year 2000 or later.* The poverty estimates <strong>for</strong> these countries should be interpreted as lower bound estimates, meaning that multidimensional poverty is at least as great as their MPI values indicates.†The poverty estimates <strong>for</strong> these countries should be interpreted as upper bound estimates, meaning that multidimensional poverty is less than or equal to their MPI values.‡ Estimates are not country representative.§In these countries we have in<strong>for</strong>mation on Body Mass <strong>Index</strong> only <strong>for</strong> the mothers of under five year old children.** Although there was in<strong>for</strong>mation on mortality <strong>for</strong> this country, the indicator had to be excluded from the estimates due to a very high percentage of missing values.www.ophi.org.uk July 2010 76
<strong>Acute</strong> <strong>Multidimensional</strong> <strong>Poverty</strong>: A <strong>New</strong> <strong>Index</strong> <strong>for</strong> <strong>Developing</strong> CountriesAlkire & SantosTable 1.1, Continued: MPI, HDI, and other income figures.Table gives the MPI value and rank, HDI value, rank and category, and shows GDP growth, GDP per capita, & Gini <strong>Index</strong>. The total population figures <strong>for</strong> each country are also reported.Human Development Indicators cCountry Survey YearMPI MPIGDP per capitaValue Rank HPI-1 2009 HDI 2009average growth2005-2008Other Income Indicators bGDP per capita2008 PPP(current international $)Gini <strong>Index</strong>(various years)Value Value CategorySlovakia † WHS 2003 0.000 1 0.88 High 6.57 22080.74 5.4Slovenia † WHS 2003 0.000 1 0.929 Very High 4.51 27604.59 31.15 2Czech Republic WHS 2003 0.000 3 1.5 0.903 Very High 5.03 24712.21 10.3Belarus MICS 2005 0.000 4 4.3 0.826 High 9.91 12260.85 27.92 9.7Latvia* WHS 2003 0.001 5 0.866 High 7.61 17100.45 35.73 2.3United Arab Emirates WHS 2003 0.002 6 7.7 0.903 Very High 3.03 4.4Kazakhstan MICS 2006 0.002 7 7.9 0.804 High 6.97 11314.58 33.85 15.4Occupied Palestinian Territories MICS 2006 0.003 8 6 0.737 Medium -3.03 4Georgia MICS 2005 0.003 9 4.7 0.778 Medium 9.29 4896.41 40.78 4.4Hungary WHS 2003 0.003 10 2.2 0.879 High 2.60 19329.54 30.04 10Bosnia and Herzegovina MICS 2006 0.003 11 2.8 0.812 High 6.07 8389.91 35.78 3.8Serbia** MICS 2005 0.003 12 3.1 0.826 High 6.30 11456.44 9.8Albania MICS 2005 0.004 13 4 0.818 High 5.25 7715.23 33.03 3.1Russian Federation* WHS 2003 0.005 14 7.4 0.817 High 8.15 16138.55 37.51 141.9Uruguay WHS 2003 0.006 15 3 0.865 High 4.98 12734.15 46.24 3.3Thailand MICS 2005 0.006 16 8.5 0.783 Medium 3.58 7702.58 43.53 67Montenegro MICS 2005 0.006 17 3.1 0.834 High 8.03 13950.66 0.6Croatia WHS 2003 0.007 18 1.9 0.871 High 4.23 19083.77 28.99 4.4Ukraine DHS 2007 0.008 19 5.8 0.796 Medium 5.93 7271.26 28.21 46.3Macedonia MICS 2005 0.008 20 3.2 0.817 High 4.54 10040.65 38.95 2Armenia DHS 2005 0.008 21 3.7 0.798 Medium 11.76 6070.09 33.8 3.1Moldova DHS 2005 0.008 22 5.9 0.72 Medium 6.95 2925.13 35.6 3.7Uzbekistan MICS 2006 0.008 23 8.5 0.71 Medium 5.94 2656.06 36.72 26.9Ecuador WHS 2003 0.009 24 7.9 0.806 High 3.61 8008.70 54.37 13.3Jordan DHS 2007 0.010 25 6.6 0.77 Medium 4.17 5282.73 37.72 5.9Tunisia* WHS 2003 0.010 26 15.6 0.769 Medium 4.10 7996.08 40.81 10.1Argentina ‡ ENNyS 2005 0.011 27 3.7 0.866 High 7.28 14332.81 50.03 39.5Population(millions,2007) cwww.ophi.org.uk July 2010 77
<strong>Acute</strong> <strong>Multidimensional</strong> <strong>Poverty</strong>: A <strong>New</strong> <strong>Index</strong> <strong>for</strong> <strong>Developing</strong> CountriesAlkire & SantosTable 1.1, ContinuedCountrySurveyYearMPIValueMPIRankHuman Development Indicators cHPI-1 2009HDI 2009GDP per capitaaverage growth2005-2008Other Income Indicators bGDP per capita2008 PPP(current international $)Gini <strong>Index</strong>(various years)Value Value CategorySouth Africa* WHS 2003 0.014 28 25.4 0.683 Medium 2.99 10108.56 57.77 49.2Mexico ENSANUT 2006 0.015 29 5.9 0.854 High 2.19 14495.33 48.11 107.5Kyrgyzstan MICS 2006 0.019 30 7.3 0.71 Medium 3.77 2188.17 32.93 5.3Trinidad and Tobago MICS 2006 0.020 31 6.4 0.837 High 6.28 24747.80 1.3Sri Lanka* WHS 2003 0.021 32 16.8 0.759 Medium 5.67 4560.45 41.06 19.9Azerbaijan DHS 2006 0.021 33 10.7 0.787 Medium 22.83 8765.21 36.5 8.6Population(millions,2007) cSyrian Arab Republic † MICS 2006 0.021 34 12.6 0.742 Medium 1.01 4439.78 20.5Belize MICS 2006 0.024 35 17.5 0.772 Medium 0.60 6940.62 0.3Egypt DHS 2008 0.026 36 23.4 0.703 Medium 4.42 5416.41 32.14 80.1Estonia WHS 2003 0.026 37 0.883 High 5.72 20662.32 36 1.3Turkey § DHS 2003 0.039 38 8.3 0.806 High 4.69 13920.15 43.23 73Brazil WHS 2003 0.039 39 8.6 0.813 High 3.35 10296.49 55.02 190.1Colombia DHS 2005 0.041 40 7.6 0.807 High 4.34 8884.51 58.49 44.4Suriname MICS 2000 0.044 41 10.1 0.769 Medium 2.99 7505.69 52.88 0.5Dominican Republic MICS 2000 0.048 42 9.1 0.777 Medium 6.98 8217.44 49.97 9.8Guyana DHS 2005 0.055 43 10.2 0.729 Medium -0.94 2541.58 44.58 0.8China WHS 2003 0.056 44 7.7 0.772 Medium 10.38 5961.83 41.53 1329.1Iraq MICS 2006 0.059 45 19.4 29.5Paraguay WHS 2003 0.064 46 10.5 0.761 Medium 1.36 4709.10 53.24 6.1Mongolia MICS 2005 0.065 47 12.7 0.727 Medium 7.49 3566.49 33.03 2.6Philippines DHS 2003 0.067 48 12.4 0.751 Medium 3.47 3509.86 44.04 88.7Tajikistan MICS 2005 0.068 49 18.2 0.688 Medium 6.05 1905.56 33.61 6.7Viet Nam DHS 2002 0.075 50 12.4 0.725 Medium 6.52 2784.95 37.77 86.1Peru DHS 2004 0.085 51 10.2 0.806 High 5.90 8507.04 49.55 28.5Myanmar* MICS 2000 0.088 52 20.4 0.586 Medium 12.19 49.1Indonesia DHS 2007 0.095 53 17 0.734 Medium 4.62 3974.89 39.41 224.7Guatemala* WHS 2003 0.127 54 19.7 0.704 Medium 2.19 4760.30 53.69 13.4www.ophi.org.uk July 2010 78
<strong>Acute</strong> <strong>Multidimensional</strong> <strong>Poverty</strong>: A <strong>New</strong> <strong>Index</strong> <strong>for</strong> <strong>Developing</strong> CountriesAlkire & SantosTable 1.1, ContinuedCountrySurveyYearMPIValueMPIRankHuman Development IndicatorsHPI-1 2009HDI 2009GDP per capitaaverage growth2005-2008Other income indicatorsGDP per capita2008 PPP(current international $)Gini <strong>Index</strong>(various years)Value Value CategoryDjibouti MICS 2006 0.139 55 25.6 0.52 Medium 2.05 2140.23 39.96 0.8Morocco DHS 2004 0.139 56 31.1 0.654 Medium 3.63 4388.50 40.88 31.2Ghana DHS 2008 0.140 57 28.1 0.526 Medium 3.90 1452.07 42.76 22.9Honduras DHS 2006 0.160 58 13.7 0.732 Medium 3.68 3964.55 55.31 7.2Population(millions,2007)Gabon † § DHS 2000 0.161 59 17.5 0.755 Medium 1.03 14526.53 41.45 1.4Zimbabwe DHS 2006 0.174 60 34 -6.85 12.4Bolivia DHS 2003 0.175 61 11.6 0.729 Medium 3.15 4278.20 58.19 9.5Swaziland DHS 2007 0.183 62 35.1 0.572 Medium 2.93 4928.21 50.68 1.2Namibia DHS 2007 0.187 63 17.1 0.686 Medium 2.59 6342.70 2.1Nicaragua DHS 2001 0.211 64 17 0.699 Medium 2.52 2682.20 52.33 5.6Lesotho DHS 2004 0.220 65 34.3 0.514 Medium 3.78 1587.84 52.5 2Sao Tome and Principe † MICS 2000 0.236 66 12.6 0.651 Medium 4.20 1738.48 0.2Cambodia DHS 2005 0.263 67 27.7 0.593 Medium 7.99 1904.59 40.69 14.3Lao MICS 2006 0.267 68 30.7 0.619 Medium 5.77 2134.09 32.63 6.1Republic of Congo DHS 2005 0.270 69 24.3 0.601 Medium 2.44 3945.88 47.32 3.6Pakistan* DHS 2007 0.275 70 33.4 0.572 Medium 3.67 2644.21 31.18 173.2Yemen MICS 2006 0.283 71 35.7 0.575 Medium 1.05 2400.07 37.69 22.3Togo MICS 2006 0.284 72 36.6 0.499 Low -1.18 829.48 34.41 6.3Bangladesh DHS 2007 0.291 73 36.1 0.543 Medium 4.73 1334.40 31.02 157.8India DHS 2005 0.296 74 28 0.612 Medium 7.33 2972.44 36.8 1164.7Cameroon DHS 2004 0.299 75 30.8 0.523 Medium 1.13 2215.06 44.56 18.7Kenya DHS 2003 0.302 76 29.5 0.541 Medium 2.94 1589.95 47.68 37.8Haiti DHS 2006 0.306 77 31.5 0.532 Medium 0.51 1176.82 59.5 9.7Cote d'Ivoire DHS 2005 0.320 78 37.4 0.484 Low -0.76 1651.24 48.39 20.1Gambia MICS 2006 0.324 79 40.9 0.456 Low 2.99 1362.77 47.28 1.6Zambia DHS 2007 0.325 80 35.5 0.481 Low 2.91 1355.77 50.74 12.3Chad WHS 2003 0.344 81 53.1 0.392 Low -1.06 1455.27 39.78 10.6www.ophi.org.uk July 2010 79
<strong>Acute</strong> <strong>Multidimensional</strong> <strong>Poverty</strong>: A <strong>New</strong> <strong>Index</strong> <strong>for</strong> <strong>Developing</strong> CountriesAlkire & SantosTable 1.1, ContinuedCountrySurveyYearMPIValueMPIRankHuman Development Indicators cHPI-1 2009HDI 2009GDP per capitaaverage growth2005-2008Other Income Indicators bGDP per capita2008 PPP(current international $)Gini <strong>Index</strong>(various years)Value Value CategoryNepal DHS 2006 0.350 82 32.1 0.553 Medium 2.36 1112.28 47.3 28.3Mauritania* MICS 2007 0.352 83 36.2 0.52 Medium 3.56 39.04 3.1Tanzania DHS 2008 0.367 84 30 0.53 Medium 3.85 1262.94 34.62 41.3Nigeria DHS 2003 0.368 85 36.2 0.511 Medium 3.27 2081.89 42.93 147.7Senegal DHS 2005 0.384 86 41.6 0.464 Low 0.98 1771.96 39.19 11.9Malawi DHS 2004 0.384 87 28.2 0.493 Low 4.56 836.79 39.02 14.4DR Congo DHS 2007 0.393 88 38 0.389 Low 3.32 321.44 44.43 62.5Comoros † MICS 2000 0.408 89 20.4 0.576 Medium -0.54 1169.01 64.3 0.6Benin DHS 2006 0.412 90 43.2 0.492 Low 0.79 1467.87 38.62 8.4Madagascar DHS 2004 0.413 91 36.1 0.543 Medium 2.84 1048.92 47.24 18.6Rwanda DHS 2005 0.443 92 32.9 0.46 Low 4.85 1021.93 46.68 9.5Angola MICS 2001 0.452 93 37.2 0.564 Medium 15.33 5898.54 58.64 17.6Mozambique DHS 2003 0.481 94 46.8 0.402 Low 5.47 855.35 47.11 21.9Liberia DHS 2007 0.484 95 35.2 0.442 Low 3.12 387.76 52.56 3.6Sierra Leone MICS 2005 0.489 96 47.7 0.365 Low 3.01 766.27 42.52 5.4Guinea DHS 2005 0.505 97 50.5 0.435 Low 1.69 1203.97 43.34 9.6Central African Republic MICS 2000 0.512 98 42.4 0.369 Low 1.55 735.67 43.57 4.3Somalia MICS 2006 0.514 99 8.7Burundi MICS 2005 0.530 100 36.4 0.394 Low 0.47 382.76 33.27 7.8Burkina Faso MICS 2006 0.536 101 51.8 0.389 Low 1.91 1161.34 39.6 14.7Mali DHS 2006 0.564 102 54.5 0.371 Low 1.68 1127.56 38.99 12.4Ethiopia DHS 2005 0.582 103 50.9 0.414 Low 8.42 868.11 29.76 78.6Niger DHS 2006 0.642 104 55.8 0.34 Low 1.38 684.00 43.89 14.1Source <strong>for</strong> columns with (a): Alkire & Santos (2010) calculations.Source <strong>for</strong> columns with (b): World Bank (2009). 'World Development Indicators '. Washington DC: World Bank.Source <strong>for</strong> columns with (c) : UNDP (2009). Human Development Report 2009: Overcoming barriers: Human mobility and development. <strong>New</strong> York: United Nations.* The poverty estimates <strong>for</strong> these countries should be interpreted as lower bound estimates, meaning that multidimensional poverty is at least as great as their MPI values indicates.†The poverty estimates <strong>for</strong> these countries should be interpreted as upper bound estimates, meaning that multidimensional poverty is less than or equal to their MPI values.‡ Estimates are not country representative.§ In these countries we have in<strong>for</strong>mation on Body Mass <strong>Index</strong> only <strong>for</strong> the mothers of under five year old children.** Although there was in<strong>for</strong>mation on mortality <strong>for</strong> this country, the indicator had to be excluded from the estimates due to a very high percentage of missing values.Population(millions,2007) cwww.ophi.org.uk July 2010 80
<strong>Acute</strong> <strong>Multidimensional</strong> <strong>Poverty</strong>: A <strong>New</strong> <strong>Index</strong> <strong>for</strong> <strong>Developing</strong> CountriesAlkire & SantosTable 1.2 Censored headcountsThe table shows the proportion of people who are MPI poor and experience deprivations in each of 10 indicators. We clarify that these are ‘MPI’ poor people because people who are deprived in lessthan 30% of weighted indicators are not considered in these headcounts, and also because data on single deprivations may be inaccurate. For their in<strong>for</strong>mation on the raw percent of people deprivedby dimension see Table 1.9.MPIValueMPIRankProportion of people who are poor and deprived in…Education Health Living StandardCountry Survey YearChild School MortalitySchoolingAttendance (any age) NutritionDrinkingElectricity Sanitation Floor Cooking AssetsWater FuelSlovakia † WHS 2003 0.000 1 0.000 0.000 0.000 0.000 0.000 0.000 0.000 0.000 0.000Slovenia † WHS 2003 0.000 1 0.000 0.000 0.000 0.000 0.000 0.000 0.000 0.000 0.000Czech Republic WHS 2003 0.000 3 0.000 0.000 0.000 0.000 0.000 0.000 0.000 0.000Belarus MICS 2005 0.000 4 0.000 0.000 0.000 0.000 0.000 0.000 0.000 0.000 0.000 0.000Latvia* WHS 2003 0.001 5 0.000 0.003 0.000 0.003 0.000 0.001 0.002United Arab Emirates WHS 2003 0.002 6 0.006 0.000 0.000 0.000 0.001 0.001 0.000 0.000 0.000Kazakhstan MICS 2006 0.002 7 0.000 0.002 0.005 0.002 0.000 0.001 0.003 0.000 0.005 0.003Occupied Palestinian Territories MICS 2006 0.003 8 0.004 0.006 0.000 0.003 0.000 0.000 0.000 0.005 0.000 0.002Georgia MICS 2005 0.003 9 0.001 0.003 0.004 0.001 0.001 0.003 0.004 0.001 0.008 0.005Hungary WHS 2003 0.003 10 0.000 0.008 0.000 0.000 0.000 0.006 0.000 0.002Bosnia and Herzegovina MICS 2006 0.003 11 0.004 0.002 0.005 0.001 0.001 0.001 0.000 0.005 0.002Serbia** MICS 2005 0.003 12 0.004 0.002 0.004 0.001 0.002 0.001 0.004 0.007 0.003Albania MICS 2005 0.004 13 0.001 0.006 0.007 0.003 0.000 0.002 0.002 0.001 0.008 0.002Russian Federation* WHS 2003 0.005 14 0.012 0.000 0.000 0.000 0.004 0.001 0.000 0.001 0.005Uruguay WHS 2003 0.006 15 0.017 0.000 0.000 0.000 0.000 0.000 0.000 0.003 0.000Thailand MICS 2005 0.006 16 0.011 0.004 0.007 0.005 0.001 0.005 0.005 0.003 0.012 0.005Montenegro MICS 2005 0.006 17 0.007 0.008 0.009 0.000 0.004 0.002 0.000 0.009 0.001Croatia WHS 2003 0.007 18 0.012 0.004 0.000 0.003 0.001 0.001 0.012 0.007Ukraine DHS 2007 0.008 19 0.001 0.002 0.021 0.000 0.001 0.001 0.000 0.003 0.001Macedonia MICS 2005 0.008 20 0.014 0.015 0.005 0.001 0.002 0.008 0.004 0.006 0.015 0.005Armenia DHS 2005 0.008 21 0.000 0.018 0.016 0.009 0.000 0.005 0.002 0.001 0.005 0.004Moldova DHS 2005 0.008 22 0.006 0.007 0.009 0.006 0.003 0.015 0.006 0.010 0.017 0.013Uzbekistan MICS 2006 0.008 23 0.000 0.012 0.019 0.009 0.001 0.001 0.006 0.007 0.009 0.009Ecuador WHS 2003 0.009 24 0.022 0.001 0.001 0.002 0.006 0.007 0.002 0.003 0.011Jordan DHS 2007 0.010 25 0.002 0.017 0.016 0.018 0.002 0.003 0.004 0.000 0.001 0.002Tunisia* WHS 2003 0.010 26 0.008 0.018 0.012 0.002 0.014 0.012 0.004 0.005 0.015Argentina ‡ ENNyS 2005 0.011 27 0.028 0.000 0.003 0.007 0.007 0.022 0.002 0.016 0.022 0.022www.ophi.org.uk July 2010 81
<strong>Acute</strong> <strong>Multidimensional</strong> <strong>Poverty</strong>: A <strong>New</strong> <strong>Index</strong> <strong>for</strong> <strong>Developing</strong> CountriesAlkire & SantosTable 1.2, ContinuedProportion of people who are poor and deprived in…MPI MPI Education Health Living StandardCountry Survey YearValue RankChild School MortalitySchoolingAttendance (any age) NutritionDrinkingElectricity Sanitation Floor Cooking AssetsWater FuelSouth Africa* WHS 2003 0.014 28 0.025 0.001 0.009 0.020 0.008 0.014 0.018 0.006Mexico ENSANUT 2006 0.015 29 0.021 0.015 0.015 0.007 0.006 0.021 0.006 0.022 0.028 0.022Kyrgyzstan MICS 2006 0.019 30 0.014 0.028 0.021 0.000 0.010 0.016 0.012 0.028 0.024Trinidad and Tobago MICS 2006 0.020 31 0.000 0.001 0.056 0.003 0.005 0.003 0.002 0.000 0.002Sri Lanka* WHS 2003 0.021 32 0.004 0.003 0.041 0.035 0.026 0.030 0.025 0.053 0.048Azerbaijan DHS 2006 0.021 33 0.001 0.028 0.033 0.028 0.001 0.024 0.031 0.008 0.014 0.023Syrian Arab Republic † MICS 2006 0.021 34 0.013 0.044 0.032 0.021 0.002 0.010 0.017 0.010 0.001 0.005Belize MICS 2006 0.024 35 0.009 0.023 0.031 0.020 0.039 0.025 0.019 0.025 0.041 0.027Egypt DHS 2008 0.026 36 0.027 0.049 0.040 0.018 0.002 0.011 0.004 0.024 0.015Estonia WHS 2003 0.026 37 0.072 0.000 0.002 0.000 0.006 0.003 0.000 0.024 0.004Turkey § DHS 2003 0.039 38 0.019 0.062 0.056 0.015 0.085 0.048 0.030 0.020 0.020Brazil WHS 2003 0.039 39 0.081 0.013 0.000 0.039 0.020 0.016 0.066 0.001Colombia DHS 2005 0.041 40 0.038 0.040 0.039 0.040 0.022 0.047 0.034 0.040 0.064 0.058Suriname MICS 2000 0.044 41 0.062 0.052 0.033 0.022 0.060 0.048 0.033Dominican Republic MICS 2000 0.048 42 0.080 0.036 0.042 0.010 0.040 0.100 0.036 0.034 0.071 0.074Guyana DHS 2005 0.055 43 0.006 0.005 0.125 0.052 0.050 0.028 0.012 0.029 0.033China WHS 2003 0.056 44 0.109 0.002 0.032 0.000 0.077 0.030 0.032 0.091 0.024Iraq MICS 2006 0.059 45 0.049 0.119 0.076 0.038 0.010 0.051 0.064 0.040 0.027 0.024Paraguay WHS 2003 0.064 46 0.068 0.046 0.027 0.045 0.112 0.088 0.075 0.124 0.087Mongolia MICS 2005 0.065 47 0.021 0.039 0.086 0.022 0.073 0.137 0.116 0.081 0.157 0.095Philippines DHS 2003 0.067 48 0.023 0.048 0.102 0.077 0.078 0.042 0.033 0.094Tajikistan MICS 2005 0.068 49 0.001 0.076 0.122 0.063 0.003 0.034 0.105 0.120 0.101 0.084Viet Nam DHS 2002 0.075 50 0.045 0.036 0.099 0.052 0.125 0.130 0.062 0.061Peru DHS 2004 0.085 51 0.048 0.032 0.083 0.015 0.155 0.192 0.139 0.174 0.191 0.155Myanmar* MICS 2000 0.088 52 0.082 0.087 0.089 0.098 0.121 0.028 0.114Indonesia DHS 2007 0.095 53 0.040 0.049 0.144 0.043 0.132 0.103 0.046 0.155 0.101Guatemala* WHS 2003 0.127 54 0.218 0.050 0.026 0.105 0.066 0.037 0.157 0.230 0.154Djibouti MICS 2006 0.139 55 0.135 0.183 0.098 0.106 0.204 0.163 0.067 0.178 0.088 0.226Morocco DHS 2004 0.139 56 0.176 0.147 0.130 0.096 0.161 0.159 0.159 0.142 0.080 0.156Ghana DHS 2008 0.140 57 0.156 0.107 0.103 0.065 0.237 0.289 0.122 0.110 0.300 0.166www.ophi.org.uk July 2010 82
<strong>Acute</strong> <strong>Multidimensional</strong> <strong>Poverty</strong>: A <strong>New</strong> <strong>Index</strong> <strong>for</strong> <strong>Developing</strong> CountriesAlkire & SantosTable 1.2, Continuedwww.ophi.org.uk July 2010 83
<strong>Acute</strong> <strong>Multidimensional</strong> <strong>Poverty</strong>: A <strong>New</strong> <strong>Index</strong> <strong>for</strong> <strong>Developing</strong> CountriesAlkire & SantosProportion of people who are poor and deprived in…MPI MPIEducation Health Living StandardCountry Survey YearValue RankChild School MortalitySchoolingAttendance (any age) NutritionDrinking CookingElectricity Sanitation FloorAssetsWaterFuelHonduras DHS 2006 0.160 58 0.135 0.228 0.106 0.070 0.232 0.119 0.198 0.297 0.198Gabon † § DHS 2000 0.161 59 0.090 0.084 0.184 0.120 0.212 0.326 0.194 0.198 0.269 0.265Zimbabwe DHS 2006 0.174 60 0.033 0.110 0.143 0.129 0.369 0.309 0.241 0.254 0.378 0.335Bolivia DHS 2003 0.175 61 0.089 0.231 0.194 0.046 0.234 0.355 0.160 0.252 0.281 0.191Swaziland DHS 2007 0.183 62 0.065 0.174 0.228 0.074 0.372 0.376 0.239 0.105 0.375 0.201Namibia DHS 2007 0.187 63 0.083 0.086 0.143 0.203 0.361 0.367 0.152 0.318 0.376 0.248Nicaragua DHS 2001 0.211 64 0.219 0.216 0.147 0.066 0.254 0.360 0.247 0.305 0.395 0.296Lesotho DHS 2004 0.220 65 0.133 0.180 0.158 0.058 0.480 0.448 0.255 0.317 0.428 0.448Sao Tome and Principe † MICS 2000 0.236 66 0.300 0.127 0.242 0.077 0.362 0.489 0.219 0.003 0.501 0.445Cambodia DHS 2005 0.263 67 0.237 0.258 0.234 0.145 0.504 0.502 0.297 0.048 0.535 0.230Lao MICS 2006 0.267 68 0.245 0.284 0.223 0.334 0.386 0.278 0.084 0.471 0.323Republic of Congo DHS 2005 0.270 69 0.061 0.161 0.295 0.209 0.467 0.543 0.350 0.349 0.538 0.442Pakistan* DHS 2007 0.275 70 0.193 0.344 0.300 0.089 0.333 0.081 0.363 0.419 0.260Yemen MICS 2006 0.283 71 0.125 0.335 0.344 0.312 0.257 0.319 0.208 0.284 0.274Togo MICS 2006 0.284 72 0.237 0.246 0.261 0.173 0.497 0.529 0.334 0.181 0.542 0.286Bangladesh DHS 2007 0.291 73 0.237 0.090 0.238 0.365 0.388 0.482 0.025 0.541 0.567 0.453India DHS 2005 0.296 74 0.176 0.250 0.228 0.389 0.287 0.493 0.121 0.400 0.522 0.381Cameroon DHS 2004 0.299 75 0.229 0.265 0.337 0.088 0.452 0.494 0.328 0.423 0.536 0.384Kenya DHS 2003 0.302 76 0.123 0.140 0.254 0.221 0.591 0.588 0.481 0.519 0.594 0.451Haiti DHS 2006 0.306 77 0.320 0.189 0.274 0.114 0.506 0.530 0.360 0.349 0.570 0.491Cote d'Ivoire DHS 2005 0.320 78 0.261 0.359 0.372 0.291 0.471 0.222 0.153 0.254Gambia MICS 2006 0.324 79 0.283 0.368 0.382 0.214 0.542 0.321 0.208 0.220 0.603 0.191Zambia DHS 2007 0.325 80 0.133 0.202 0.360 0.183 0.616 0.571 0.496 0.516 0.627 0.392Chad WHS 2003 0.344 81 0.423 0.024 0.070 0.619 0.584 0.429 0.600 0.613 0.531Nepal DHS 2006 0.350 82 0.292 0.156 0.300 0.403 0.434 0.563 0.144 0.601 0.634 0.467Mauritania* MICS 2007 0.352 83 0.360 0.315 0.266 0.190 0.530 0.545 0.454 0.449 0.534 0.432Tanzania DHS 2008 0.367 84 0.134 0.241 0.356 0.627 0.641 0.474 0.556 0.650 0.406Nigeria DHS 2003 0.368 85 0.254 0.305 0.415 0.302 0.418 0.622 0.499 0.323 0.605 0.323Senegal DHS 2005 0.384 86 0.385 0.502 0.440 0.125 0.490 0.514 0.317 0.326 0.532 0.381Malawi DHS 2004 0.384 87 0.291 0.249 0.336 0.191 0.712 0.718 0.442 0.643 0.721 0.483DR Congo DHS 2007 0.393 88 0.144 0.403 0.371 0.170 0.691 0.620 0.555 0.649 0.727 0.573www.ophi.org.uk July 2010 84
<strong>Acute</strong> <strong>Multidimensional</strong> <strong>Poverty</strong>: A <strong>New</strong> <strong>Index</strong> <strong>for</strong> <strong>Developing</strong> CountriesAlkire & SantosTable 1.2, ContinuedCountry Survey YearMPIValueMPIRankProportion of people who are poor and deprived in…Education Health Living StandardChild School MortalitySchoolingAttendance (any age) NutritionDrinkingElectricity Sanitation Floor Cooking AssetsWater FuelComoros † MICS 2000 0.408 89 0.308 0.479 0.270 0.272 0.543 0.728 0.450 0.283 0.723 0.637Benin DHS 2006 0.412 90 0.423 0.408 0.377 0.241 0.651 0.696 0.334 0.399 0.714 0.281Madagascar DHS 2004 0.413 91 0.427 0.322 0.266 0.337 0.679 0.609 0.588 0.158 0.705 0.634Rwanda DHS 2005 0.443 92 0.375 0.288 0.402 0.117 0.803 0.662 0.641 0.757 0.813 0.744Angola MICS 2001 0.452 93 0.433 0.304 0.445 0.233 0.671 0.685 0.513 0.612 0.710 0.697Mozambique DHS 2003 0.481 94 0.556 0.403 0.393 0.226 0.778 0.525 0.571 0.691 0.796 0.558Liberia DHS 2007 0.484 95 0.303 0.557 0.490 0.236 0.828 0.788 0.338 0.508 0.839 0.650Sierra Leone MICS 2005 0.489 96 0.464 0.335 0.494 0.220 0.779 0.775 0.523 0.625 0.815 0.748Guinea DHS 2005 0.505 97 0.542 0.532 0.527 0.169 0.741 0.754 0.376 0.521 0.823 0.559Central African Republic MICS 2000 0.512 98 0.357 0.627 0.471 0.245 0.820 0.533 0.536 0.861 0.687Somalia MICS 2006 0.514 99 0.618 0.435 0.274 0.300 0.758 0.691 0.700 0.644 0.810 0.762Burundi MICS 2005 0.530 100 0.529 0.473 0.356 0.835 0.631 0.516 0.812 0.843 0.756Burkina Faso MICS 2006 0.536 101 0.551 0.641 0.500 0.354 0.775 0.696 0.430 0.555 0.824 0.228Mali DHS 2006 0.564 102 0.608 0.577 0.516 0.362 0.788 0.799 0.437 0.714 0.870 0.354Ethiopia DHS 2005 0.582 103 0.615 0.649 0.376 0.209 0.857 0.876 0.543 0.875 0.896 0.887Niger DHS 2006 0.642 104 0.664 0.697 0.580 0.246 0.875 0.895 0.646 0.855 0.926 0.805* The poverty estimates <strong>for</strong> these countries should be interpreted as lower bound estimates, meaning that multidimensional poverty is at least as great as their MPI values indicates.†The poverty estimates <strong>for</strong> these countries should be interpreted as upper bound estimates, meaning that multidimensional poverty is less than or equal to their MPI values.‡ Estimates are not country representative.§ In these countries we have in<strong>for</strong>mation on Body Mass <strong>Index</strong> only <strong>for</strong> the mothers of under five year old children.** Although there was in<strong>for</strong>mation on mortality <strong>for</strong> this country, the indicator had to be excluded from the estimates due to a very high percentage of missing values.www.ophi.org.uk July 2010 85
<strong>Acute</strong> <strong>Multidimensional</strong> <strong>Poverty</strong>: A <strong>New</strong> <strong>Index</strong> <strong>for</strong> <strong>Developing</strong> CountriesAlkire & SantosTable 1.3 Contribution of deprivationsThe table shows which dimensions contribute more to MPICountry Survey YearMPIValueMPIRankPercent Contribution of Deprivations in…LivingEducation HealthStandardSlovakia † WHS 2003 0.000 1 0.00 0.00 0.00Slovenia † WHS 2003 0.000 1 0.00 0.00 0.00Czech Republic WHS 2003 0.000 3 0.00 71.43 28.57Belarus MICS 2005 0.000 4 16.58 61.75 21.67Latvia* WHS 2003 0.001 5 0.00 71.43 28.57United Arab Emirates WHS 2003 0.002 6 94.39 0.37 5.25Kazakhstan MICS 2006 0.002 7 14.55 56.78 28.67Occupied Palestinian Territories MICS 2006 0.003 8 62.14 20.93 16.93Georgia MICS 2005 0.003 9 23.16 33.82 43.02Hungary WHS 2003 0.003 10 0.00 85.71 14.29Bosnia and Herzegovina MICS 2006 0.003 11 29.20 51.78 19.02Serbia** MICS 2005 0.003 12 30.51 40.12 29.37Albania MICS 2005 0.004 13 33.44 43.86 22.70Russian Federation* WHS 2003 0.005 14 84.19 2.46 13.34Uruguay WHS 2003 0.006 15 96.05 0.58 3.38Thailand MICS 2005 0.006 16 40.72 31.15 28.13Montenegro MICS 2005 0.006 17 37.54 47.60 14.86Croatia WHS 2003 0.007 18 59.70 20.50 19.80Ukraine DHS 2007 0.008 19 5.82 89.86 4.32Macedonia MICS 2005 0.008 20 59.86 12.85 27.29Armenia DHS 2005 0.008 21 36.23 51.45 12.32Moldova DHS 2005 0.008 22 26.36 31.08 42.56Uzbekistan MICS 2006 0.008 23 23.18 55.69 21.13Ecuador WHS 2003 0.009 24 78.64 3.25 18.11Jordan DHS 2007 0.010 25 34.49 59.19 6.32Tunisia* WHS 2003 0.010 26 25.05 47.31 27.64Argentina ‡ ENNyS 2005 0.011 27 41.10 13.77 45.13South Africa* WHS 2003 0.014 28 57.84 11.72 30.44Mexico ENSANUT 2006 0.015 29 38.64 23.88 37.55Kyrgyzstan MICS 2006 0.019 30 36.65 36.94 26.41Trinidad and Tobago MICS 2006 0.020 31 1.29 94.29 4.42Sri Lanka* WHS 2003 0.021 32 6.26 35.40 58.34Azerbaijan DHS 2006 0.021 33 23.44 49.75 26.81Syrian Arab Republic † MICS 2006 0.021 34 45.43 42.73 11.84Belize MICS 2006 0.024 35 22.80 35.82 41.39Egypt DHS 2008 0.026 36 48.40 37.16 14.44Estonia WHS 2003 0.026 37 91.22 1.18 7.60Turkey § DHS 2003 0.039 38 34.83 30.25 34.92Brazil WHS 2003 0.039 39 69.13 10.83 20.04Colombia DHS 2005 0.041 40 31.74 32.07 36.19Suriname MICS 2000 0.044 41 43.16 21.04 35.80Dominican Republic MICS 2000 0.048 42 40.60 18.10 41.30Guyana DHS 2005 0.055 43 3.24 76.03 20.72China WHS 2003 0.056 44 64.85 9.90 25.25Iraq MICS 2006 0.059 45 47.53 32.12 20.35Paraguay WHS 2003 0.064 46 35.10 19.03 45.87Mongolia MICS 2005 0.065 47 15.45 27.91 56.64Philippines DHS 2003 0.067 48 17.49 50.39 32.13Tajikistan MICS 2005 0.068 49 18.71 45.03 36.27Viet Nam DHS 2002 0.075 50 17.97 43.75 38.29Peru DHS 2004 0.085 51 15.43 19.06 65.50Myanmar* MICS 2000 0.088 52 31.93 33.86 34.21Indonesia DHS 2007 0.095 53 15.67 50.52 33.82Guatemala* WHS 2003 0.127 54 57.22 9.98 32.79Djibouti MICS 2006 0.139 55 38.30 24.57 37.13www.ophi.org.uk July 2010 86
<strong>Acute</strong> <strong>Multidimensional</strong> <strong>Poverty</strong>: A <strong>New</strong> <strong>Index</strong> <strong>for</strong> <strong>Developing</strong> CountriesAlkire & SantosTable 1.3, ContinuedCountry Survey YearMPIValueMPIRankPercent Contribution of Deprivations in…LivingEducation HealthStandardMorocco DHS 2004 0.139 56 38.70 27.09 34.21Ghana DHS 2008 0.140 57 31.37 19.98 48.65Honduras DHS 2006 0.160 58 37.95 18.42 43.63Gabon † § DHS 2000 0.161 59 18.01 31.45 50.54Zimbabwe DHS 2006 0.174 60 13.70 26.06 60.24Bolivia DHS 2003 0.175 61 30.43 22.86 46.71Swaziland DHS 2007 0.183 62 21.83 27.51 50.67Namibia DHS 2007 0.187 63 15.03 30.84 54.12Nicaragua DHS 2001 0.211 64 34.37 16.79 48.84Lesotho DHS 2004 0.220 65 23.73 16.33 59.94Sao Tome and Principe † MICS 2000 0.236 66 30.08 22.49 47.43Cambodia DHS 2005 0.263 67 31.34 23.99 44.66Lao MICS 2006 0.267 68 33.08 27.87 39.05Republic of Congo DHS 2005 0.270 69 13.67 31.07 55.26Pakistan* DHS 2007 0.275 70 32.50 36.35 31.14Yemen MICS 2006 0.283 71 27.04 40.51 32.45Togo MICS 2006 0.284 72 28.31 25.40 46.29Bangladesh DHS 2007 0.291 73 18.70 34.50 46.81India DHS 2005 0.296 74 23.99 34.68 41.33Cameroon DHS 2004 0.299 75 27.55 23.75 48.70Kenya DHS 2003 0.302 76 14.54 26.17 59.28Haiti DHS 2006 0.306 77 27.79 21.18 51.03Cote d'Ivoire DHS 2005 0.320 78 32.29 38.73 28.98Gambia MICS 2006 0.324 79 33.53 30.69 35.78Zambia DHS 2007 0.325 80 17.21 27.85 54.95Chad WHS 2003 0.344 81 40.92 4.57 54.50Nepal DHS 2006 0.350 82 21.32 33.53 45.15Mauritania* MICS 2007 0.352 83 31.96 21.58 46.46Tanzania DHS 2008 0.367 84 17.00 32.29 50.71Nigeria DHS 2003 0.368 85 25.34 32.48 42.18Senegal DHS 2005 0.384 86 38.46 24.49 37.04Malawi DHS 2004 0.384 87 23.41 22.85 53.74DR Congo DHS 2007 0.393 88 23.18 22.93 53.89Comoros † MICS 2000 0.408 89 32.13 22.10 45.76Benin DHS 2006 0.412 90 33.60 24.96 41.44Madagascar DHS 2004 0.413 91 30.26 24.33 45.40Rwanda DHS 2005 0.443 92 24.95 19.55 55.50Angola MICS 2001 0.452 93 27.19 25.01 47.80Mozambique DHS 2003 0.481 94 33.26 21.45 45.29Liberia DHS 2007 0.484 95 29.60 25.02 45.37Sierra Leone MICS 2005 0.489 96 27.22 24.35 48.43Guinea DHS 2005 0.505 97 35.48 22.97 41.55Central African Republic MICS 2000 0.512 98 32.01 23.26 44.73Somalia MICS 2006 0.514 99 34.16 18.63 47.21Burundi MICS 2005 0.530 100 31.55 22.38 46.07Burkina Faso MICS 2006 0.536 101 37.07 26.55 36.38Mali DHS 2006 0.564 102 35.03 25.93 39.04Ethiopia DHS 2005 0.582 103 36.19 16.74 47.06Niger DHS 2006 0.642 104 35.31 21.44 43.25* The poverty estimates <strong>for</strong> these countries should be interpreted as lower bound estimates, meaning that multidimensional poverty is atleast as great as their MPI values indicates.†The poverty estimates <strong>for</strong> these countries should be interpreted as upper bound estimates, meaning that multidimensional poverty isless than or equal to their MPI values.‡ Estimates are not country representative.§In these countries we have in<strong>for</strong>mation on Body Mass <strong>Index</strong> only <strong>for</strong> the mothers of under five year old children.** Although there was in<strong>for</strong>mation on mortality <strong>for</strong> this country, the indicator had to be excluded from the estimates due to a very highpercentage of missing values.www.ophi.org.uk July 2010 87
<strong>Acute</strong> <strong>Multidimensional</strong> <strong>Poverty</strong>: A <strong>New</strong> <strong>Index</strong> <strong>for</strong> <strong>Developing</strong> CountriesAlkire & SantosTable 1.4 MPI by regionThe table sorts countries in each UN region by low to high multidimensional poverty & compares with income poverty. Estimates are the same as in Table 1.1, the only difference is that countriesare grouped by region here.<strong>Multidimensional</strong> <strong>Poverty</strong>Income <strong>Poverty</strong>AH$1.25 a day$2 a day National poverty lineRegion/CountrySurvey Year MPI MPI(Average(Proportion(Proportion of poor) (Proportion of poor) (Proportion of poor)Value Rankintensity ofof poor)deprivations) Value Rank Value Rank Value RankEurope and Commonwealth of Independent States (CIS)Slovakia † WHS 2003 0 1 0 0.168Slovenia † WHS 2003 0 1 0 0.020 1 0.020 8Czech Republic WHS 2003 0.000 3 0.000 0.467Belarus MICS 2005 0.000 4 0.000 0.351 0.020 1 0.020 1 0.174 9Latvia* WHS 2003 0.001 5 0.003 0.467 0.020 1 0.020 1 0.059 2Kazakhstan MICS 2006 0.002 7 0.006 0.369 0.020 1 0.020 1 0.154 5Georgia MICS 2005 0.003 9 0.008 0.352 0.134 37 0.304 39 0.545 52Hungary WHS 2003 0.003 10 0.008 0.389 0.020 1 0.020 1Bosnia and Herzegovina MICS 2006 0.003 11 0.008 0.372 0.020 1 0.020 1 0.195 12Serbia** MICS 2005 0.003 12 0.008 0.400 0.020 1 0.020 1Albania MICS 2005 0.004 13 0.010 0.381 0.020 1 0.078 18 0.185 10Russian Federation* WHS 2003 0.005 14 0.013 0.389 0.020 1 0.020 1 0.196 13Montenegro MICS 2005 0.006 17 0.015 0.416 0.020 1 0.020 1Croatia WHS 2003 0.007 18 0.016 0.416 0.020 11 0.020 1 0.111 3Ukraine DHS 2007 0.008 19 0.022 0.357 0.020 1 0.020 1 0.195 11Macedonia MICS 2005 0.008 20 0.019 0.409 0.020 1 0.053 16 0.217 15Armenia DHS 2005 0.008 21 0.023 0.365 0.037 27 0.210 33 0.509 47Moldova DHS 2005 0.008 22 0.022 0.375 0.024 21 0.115 22 0.485 44Uzbekistan MICS 2006 0.008 23 0.023 0.362 0.463 66 0.767 69 0.272 19Kyrgyzstan MICS 2006 0.019 30 0.049 0.388 0.034 25 0.275 36 0.431 35Azerbaijan DHS 2006 0.021 33 0.054 0.386 0.020 1 0.020 10 0.496 45Estonia WHS 2003 0.026 37 0.072 0.365 0.020 1 0.020 1Turkey § DHS 2003 0.039 38 0.085 0.459 0.026 23 0.082 20 0.270 18Tajikistan MICS 2005 0.068 49 0.171 0.400 0.215 48 0.508 51 0.535 51www.ophi.org.uk July 2010 88
<strong>Acute</strong> <strong>Multidimensional</strong> <strong>Poverty</strong>: A <strong>New</strong> <strong>Index</strong> <strong>for</strong> <strong>Developing</strong> CountriesAlkire & SantosTable 1.4, ContinuedRegion/CountrySurveyYearMPIValue<strong>Multidimensional</strong> <strong>Poverty</strong>MPIRankH(Proportionof poor)A(Averageintensity ofdeprivations)$1.25 a day(Proportion of poor)Income <strong>Poverty</strong>$2 a day(Proportion of poor)National poverty line(Proportion of poor)Value Rank Value Rank Value RankLatin America and CaribbeanUruguay WHS 2003 0.006 15 0.017 0.347 0.020 1 0.042 15Ecuador WHS 2003 0.009 24 0.022 0.416 0.047 30 0.128 26 0.383 30Argentina ‡ ENNyS 2005 0.011 27 0.030 0.377 0.034 26 0.073 17Mexico ENSANUT 2006 0.015 29 0.040 0.389 0.040 28 0.082 19 0.470 42Trinidad and Tobago MICS 2006 0.020 31 0.056 0.351Belize MICS 2006 0.024 35 0.056 0.426Brazil WHS 2003 0.039 39 0.085 0.460 0.052 32 0.127 24 0.215 14Colombia DHS 2005 0.041 40 0.092 0.441 0.160 41 0.279 37 0.451 37Suriname MICS 2000 0.044 41 0.075 0.588Dominican Republic MICS 2000 0.048 42 0.111 0.433 0.044 29 0.123 23 0.485 43Guyana DHS 2005 0.055 43 0.138 0.397Paraguay WHS 2003 0.064 46 0.133 0.485 0.065 33 0.142 29Peru DHS 2004 0.085 51 0.198 0.431 0.077 34 0.185 31 0.516 49Guatemala* WHS 2003 0.127 54 0.259 0.491 0.117 36 0.243 35 0.510 48Honduras DHS 2006 0.160 58 0.326 0.489 0.182 43 0.297 38 0.507 46Bolivia DHS 2003 0.175 61 0.363 0.483 0.117 35 0.219 34 0.377 29Nicaragua DHS 2001 0.211 64 0.407 0.519 0.158 39 0.318 40 0.458 38Haiti DHS 2006 0.306 77 0.573 0.533 0.549 73 0.721 64East Asia and the PacificThailand MICS 2005 0.006 16 0.016 0.385 0.020 1 0.115 21China WHS 2003 0.056 44 0.125 0.449 0.159 40 0.363 41 0.028 1Mongolia MICS 2005 0.065 47 0.158 0.410 0.022 20 0.136 27 0.361 28Philippines DHS 2003 0.067 48 0.126 0.535 0.226 49 0.450 47Viet Nam DHS 2002 0.075 50 0.143 0.525 0.215 47 0.484 50 0.289 22Myanmar* MICS 2000 0.088 52 0.142 0.620 0.320 25Indonesia DHS 2007 0.095 53 0.208 0.459 0.294 55 0.600 57 0.167 6Cambodia DHS 2005 0.263 67 0.539 0.489 0.258 52 0.578 56 0.301 23Lao MICS 2006 0.267 68 0.472 0.565 0.440 64 0.768 70 0.335 26www.ophi.org.uk July 2010 89
<strong>Acute</strong> <strong>Multidimensional</strong> <strong>Poverty</strong>: A <strong>New</strong> <strong>Index</strong> <strong>for</strong> <strong>Developing</strong> CountriesTable 1.4, ContinuedAlkire & SantosRegion/CountrySurveyYearMPIValue<strong>Multidimensional</strong> <strong>Poverty</strong>MPIRankH(Proportionof poor)A(Averageintensity ofdeprivations)$1.25 a day(Proportion of poor)Income <strong>Poverty</strong>$2 a day(Proportion of poor)National poverty line(Proportion of poor)Value Rank Value Rank Value RankArab StatesUnited Arab Emirates WHS 2003 0.002 6 0.006 0.353Occupied Palestinian Territories MICS 2006 0.003 8 0.007 0.382Jordan DHS 2007 0.010 25 0.027 0.354 0.020 1 0.035 14 0.142 4Tunisia* WHS 2003 0.010 26 0.028 0.371 0.026 24 0.128 25Syrian Arab Republic † MICS 2006 0.021 34 0.055 0.375Egypt DHS 2008 0.026 36 0.064 0.404 0.020 1 0.184 30 0.167 7Iraq MICS 2006 0.059 45 0.142 0.413Djibouti MICS 2006 0.139 55 0.293 0.473 0.188 44 0.412 44Morocco DHS 2004 0.139 56 0.285 0.488 0.025 22 0.140 28Yemen MICS 2006 0.283 71 0.525 0.539 0.175 42 0.466 48Somalia MICS 2006 0.514 99 0.812 0.633South AsiaSri Lanka* WHS 2003 0.021 32 0.053 0.387 0.140 38 0.397 42 0.227 17Pakistan* DHS 2007 0.275 70 0.510 0.540 0.226 50 0.603 58Bangladesh DHS 2007 0.291 73 0.578 0.504 0.496 68 0.813 77 0.400 33India DHS 2005 0.296 74 0.554 0.535 0.416 62 0.756 67 0.286 21Nepal DHS 2006 0.350 82 0.647 0.540 0.551 74 0.776 73 0.309 24www.ophi.org.uk July 2010 90
<strong>Acute</strong> <strong>Multidimensional</strong> <strong>Poverty</strong>: A <strong>New</strong> <strong>Index</strong> <strong>for</strong> <strong>Developing</strong> CountriesTable 1.4, ContinuedAlkire & SantosRegion/CountrySurveyYearMPIValue<strong>Multidimensional</strong> <strong>Poverty</strong>MPIRankH(Proportionof poor)A(Averageintensity ofdeprivations)$1.25 a day(Proportion of poor)Income <strong>Poverty</strong>$2 a day(Proportion of poor)National poverty line(Proportion of poor)Value Rank Value Rank Value RankSub-Saharan AfricaSouth Africa* WHS 2003 0.014 28 0.031 0.467 0.262 53 0.429 45 0.220 16Ghana DHS 2008 0.140 57 0.301 0.464 0.300 56 0.536 52 0.285 20Gabon † § DHS 2000 0.161 59 0.354 0.455 0.048 31 0.196 32Zimbabwe DHS 2006 0.174 60 0.385 0.452Swaziland DHS 2007 0.183 62 0.411 0.444 0.629 79 0.810 75 0.692 59Namibia DHS 2007 0.187 63 0.396 0.472Lesotho DHS 2004 0.220 65 0.481 0.458 0.434 63 0.622 60 0.563 54Sao Tome and Principe † MICS 2000 0.236 66 0.516 0.458 0.284 54 0.566 53Republic of Congo DHS 2005 0.270 69 0.559 0.484 0.541 71 0.744 65 0.423 34Togo MICS 2006 0.284 72 0.543 0.524 0.387 60 0.693 62Cameroon DHS 2004 0.299 75 0.546 0.547 0.328 57 0.577 55 0.399 32Kenya DHS 2003 0.302 76 0.604 0.500 0.197 45 0.399 43 0.466 41Cote d'Ivoire DHS 2005 0.320 78 0.522 0.614 0.233 51 0.468 49Gambia MICS 2006 0.324 79 0.604 0.536 0.343 59 0.567 54 0.613 56Zambia DHS 2007 0.325 80 0.637 0.511 0.643 80 0.815 78 0.680 57Chad WHS 2003 0.344 81 0.629 0.547 0.619 77 0.833 80Mauritania* MICS 2007 0.352 83 0.617 0.571 0.212 46 0.441 46 0.463 39Tanzania DHS 2008 0.367 84 0.653 0.563 0.885 90 0.966 90 0.357 27Nigeria DHS 2003 0.368 85 0.635 0.579 0.644 81 0.839 81Senegal DHS 2005 0.384 86 0.669 0.574 0.335 58 0.603 59Malawi DHS 2004 0.384 87 0.723 0.532 0.739 85 0.904 87 0.524 50DR Congo DHS 2007 0.393 88 0.732 0.537 0.592 76 0.795 74 0.713 61Comoros † MICS 2000 0.408 89 0.739 0.552 0.461 65 0.650 61Benin DHS 2006 0.412 90 0.720 0.573 0.473 67 0.753 66 0.390 31Madagascar DHS 2004 0.413 91 0.705 0.585 0.678 83 0.896 84 0.687 58Rwanda DHS 2005 0.443 92 0.814 0.544 0.766 87 0.903 86 0.569 55Angola MICS 2001 0.452 93 0.774 0.584 0.543 72 0.702 63www.ophi.org.uk July 2010 91
<strong>Acute</strong> <strong>Multidimensional</strong> <strong>Poverty</strong>: A <strong>New</strong> <strong>Index</strong> <strong>for</strong> <strong>Developing</strong> CountriesTable 1.4, ContinuedAlkire & SantosRegion/Country Survey YearMPIValue<strong>Multidimensional</strong> <strong>Poverty</strong>Value Rank Value Rank Value RankSub-Saharan Africa (cont.)Mozambique DHS 2003 0.481 94 0.798 0.602 0.747 86 0.900 85 0.552 53Liberia DHS 2007 0.484 95 0.839 0.577 0.837 89 0.948 89Sierra Leone MICS 2005 0.489 96 0.815 0.600 0.534 70 0.761 68 0.702 60Guinea DHS 2005 0.505 97 0.824 0.613 0.701 84 0.872 83Central African Republic MICS 2000 0.512 98 0.864 0.593 0.624 78 0.819 79Burundi MICS 2005 0.530 100 0.845 0.627 0.813 88 0.934 88Burkina Faso MICS 2006 0.536 101 0.826 0.649 0.565 75 0.812 76 0.464 40Mali DHS 2006 0.564 102 0.871 0.647 0.514 69 0.771 71Ethiopia DHS 2005 0.582 103 0.900 0.647 0.390 61 0.775 72 0.442 36Niger DHS 2006 0.642 104 0.927 0.693 0.659 82 0.856 82Columns 7, 9 and 11: World Bank (2009). 'World Development Indicators '. Washington DC: World Bank. Income poverty figures correspond to the latest estimate available, of the year 2000 or later.* The poverty estimates <strong>for</strong> these countries should be interpreted as lower bound estimates, meaning that multidimensional poverty is at least as great as their MPI values indicates.†The poverty estimates <strong>for</strong> these countries should be interpreted as upper bound estimates, meaning that multidimensional poverty is less than or equal to their MPI values.‡ Estimates are not country representative.§In these countries we have in<strong>for</strong>mation on Body Mass <strong>Index</strong> only <strong>for</strong> the mothers of under five year old children.** Although there was in<strong>for</strong>mation on mortality <strong>for</strong> this country, the indicator had to be excluded from the estimates due to a very high percentage of missing values.MPIRankH(Proportionof poor)A(Averageintensity ofdeprivations)$1.25 a day(Proportion of poor)Income <strong>Poverty</strong>$2 a day(Proportion of poor)National poverty line(Proportion of poor)www.ophi.org.uk July 2010 92
<strong>Acute</strong> <strong>Multidimensional</strong> <strong>Poverty</strong>: A <strong>New</strong> <strong>Index</strong> <strong>for</strong> <strong>Developing</strong> CountriesAlkire & SantosTable 1.4, Continued MPI by regionThe table provides the MPI, HPI and HDI and compares the number of MPI poor and the number of Income Poor <strong>for</strong> countries sorted by the UN RegionRegionCountry Survey YearMPIValueMPIRankHuman Development Indicators cHPI-1 2009HDI 2009MPI poorpopulation(millions)Population in poverty a$1.25 a daypoor population(millions)$2 a daypoor population(millions)Value Value CategoryEurope and Commonwealth of Independent States (CIS) 12.198 23.631 44.875 394.6Population(millions,2007) cSlovakia † WHS 2003 0.000 1 0.88 High 0.000 0.108 0.108 5.4Slovenia † WHS 2003 0.000 1 0.929 Very High 0.000 0.040 0.040 2.0Czech Republic WHS 2003 0.000 3 1.5 0.903 Very High 0.001 0.206 0.206 10.3Belarus MICS 2005 0.000 4 4.3 0.826 High 0.002 0.194 0.194 9.7Latvia* WHS 2003 0.001 5 0.866 High 0.007 0.046 0.046 2.3Kazakhstan MICS 2006 0.002 7 7.9 0.804 High 0.090 0.477 2.649 15.4Georgia MICS 2005 0.003 9 4.7 0.778 Medium 0.035 0.590 1.338 4.4Hungary WHS 2003 0.003 10 2.2 0.879 High 0.076 0.200 0.200 10.0Bosnia and Herzegovina MICS 2006 0.003 11 2.8 0.812 High 0.031 0.076 0.076 3.8Serbia** MICS 2005 0.003 12 3.1 0.826 High 0.081 9.8Albania MICS 2005 0.004 13 4.0 0.818 High 0.030 0.062 0.242 3.1Russian Federation* WHS 2003 0.005 14 7.4 0.817 High 1.795 2.838 2.838 141.9Montenegro MICS 2005 0.006 17 3.1 0.834 High 0.009 0.6Croatia WHS 2003 0.007 18 1.9 0.871 High 0.070 0.088 0.088 4.4Ukraine DHS 2007 0.008 19 5.8 0.796 Medium 1.014 0.926 0.926 46.3Macedonia MICS 2005 0.008 20 3.2 0.817 High 0.038 0.040 0.064 2.0Armenia DHS 2005 0.008 21 3.7 0.798 Medium 0.070 0.329 1.345 3.1Moldova DHS 2005 0.008 22 5.9 0.72 Medium 0.081 0.300 1.069 3.7Uzbekistan MICS 2006 0.008 23 8.5 0.71 Medium 0.625 12.455 20.632 26.9Kyrgyzstan MICS 2006 0.019 30 7.3 0.71 Medium 0.258 1.155 2.751 5.3Azerbaijan DHS 2006 0.021 33 10.7 0.787 Medium 0.461 0.172 0.172 8.6Estonia WHS 2003 0.026 37 0.883 High 0.094 0.026 0.026 1.3Turkey § DHS 2003 0.039 38 8.3 0.806 High 6.183 1.971 6.570 73.0Tajikistan MICS 2005 0.068 49 18.2 0.688 Medium 1.145 1.441 3.404 6.7www.ophi.org.uk July 2010 93
<strong>Acute</strong> <strong>Multidimensional</strong> <strong>Poverty</strong>: A <strong>New</strong> <strong>Index</strong> <strong>for</strong> <strong>Developing</strong> CountriesTable 1.4 ContinuedAlkire & SantosRegionCountrySurveyYearMPIValueMPIRankHuman Development Indicators cHPI-1 2009HDI 2009MPI poorpopulation(millions)Population in poverty a$1.25 a daypoor population(millions)$2 a daypoor population(millions)Value Value CategoryLatin America and Caribbean 50.919 35.824 72.968 487.5Uruguay WHS 2003 0.006 15 3.0 0.865 High 0.056 0.066 0.139 3.3Ecuador WHS 2003 0.009 24 7.9 0.806 High 0.294 0.625 1.702 13.3Argentina ‡ ENNyS 2005 0.011 27 3.7 0.866 High 1.181 1.778 4.464 39.5Mexico ENSANUT 2006 0.015 29 5.9 0.854 High 4.278 2.150 5.160 107.5Trinidad and Tobago MICS 2006 0.020 31 6.4 0.837 High 0.073 0.055 0.176 1.3Belize MICS 2006 0.024 35 17.5 0.772 Medium 0.017 0.3Brazil WHS 2003 0.039 39 8.6 0.813 High 16.205 9.885 24.143 190.1Colombia DHS 2005 0.041 40 7.6 0.807 High 4.090 7.104 12.388 44.4Suriname MICS 2000 0.044 41 10.1 0.769 Medium 0.037 0.078 0.136 0.5Dominican Republic MICS 2000 0.048 42 9.1 0.777 Medium 1.083 0.490 1.480 9.8Guyana DHS 2005 0.055 43 10.2 0.729 Medium 0.110 0.062 0.134 0.8Paraguay WHS 2003 0.064 46 10.5 0.761 Medium 0.809 0.397 0.866 6.1Peru DHS 2004 0.085 51 10.2 0.806 High 5.645 2.252 5.273 28.5Guatemala* WHS 2003 0.127 54 19.7 0.704 Medium 3.466 1.568 3.256 13.4Honduras DHS 2006 0.160 58 13.7 0.732 Medium 2.349 1.310 2.138 7.2Bolivia DHS 2003 0.175 61 11.6 0.729 Medium 3.446 1.862 2.879 9.5Nicaragua DHS 2001 0.211 64 17.0 0.699 Medium 2.281 0.885 1.781 5.6Haiti DHS 2006 0.306 77 31.5 0.532 Medium 5.556 5.325 6.994 9.7East Asia and the Pacific 254.994 277.092 697.570 1867.7Thailand MICS 2005 0.006 16 8.5 0.783 Medium 1.105 1.340 7.705 67.0China WHS 2003 0.056 44 7.7 0.772 Medium 165.787 211.327 482.463 1329.1Mongolia MICS 2005 0.065 47 12.7 0.727 Medium 0.410 0.582 1.274 2.6Philippines DHS 2003 0.067 48 12.4 0.751 Medium 11.159 20.046 39.915 88.7Viet Nam DHS 2002 0.075 50 12.4 0.725 Medium 12.313 18.512 41.672 86.1Myanmar MICS 2000 0.088 52 20.4 0.586 Medium 6.969 49.1Indonesia DHS 2007 0.095 53 17.0 0.734 Medium 46.666 16.853 110.103 224.7Cambodia DHS 2005 0.263 67 27.7 0.593 Medium 7.703 5.749 9.753 14.3Lao MICS 2006 0.267 68 30.7 0.619 Medium 2.882 2.684 4.685 6.1Population(millions,2007) cwww.ophi.org.uk July 2010 94
<strong>Acute</strong> <strong>Multidimensional</strong> <strong>Poverty</strong>: A <strong>New</strong> <strong>Index</strong> <strong>for</strong> <strong>Developing</strong> CountriesTable 1.4, ContinuedAlkire & SantosRegionCountrySurveyYearMPIValueMPIRankHuman Development IndicatorsHPI-1 2009HDI 2009MPI poorpopulation(millions)Population in poverty$1.25 a daypoor population(millions)$2 a daypoor population(millions)Value Value CategoryArab States 38.869 6.816 31.327 217.5United Arab Emirates WHS 2003 0.002 6 7.7 0.903 Very High 0.025 4.4Occupied Palestinian Territories MICS 2006 0.003 8 6.0 0.737 Medium 0.028 4.0Jordan DHS 2007 0.010 25 6.6 0.77 Medium 0.159 0.118 0.207 5.9Tunisia* WHS 2003 0.010 26 15.6 0.769 Medium 0.285 0.263 1.293 10.1Syrian Arab Republic † MICS 2006 0.021 34 12.6 0.742 Medium 1.134 20.5Egypt DHS 2008 0.026 36 23.4 0.703 Medium 5.138 1.602 14.738 80.1Iraq MICS 2006 0.059 45 19.4 4.203 29.5Djibouti MICS 2006 0.139 55 25.6 0.52 Medium 0.235 0.150 0.330 0.8Morocco DHS 2004 0.139 56 31.1 0.654 Medium 8.892 0.780 4.368 31.2Yemen MICS 2006 0.283 71 35.7 0.575 Medium 11.710 3.903 10.392 22.3Somalia MICS 2006 0.514 99 7.061 8.7South Asia 843.783 620.307 1143.105 1543.9Sri Lanka* WHS 2003 0.021 32 16.8 0.759 Medium 1.061 2.786 7.900 19.9Pakistan* DHS 2007 0.275 70 33.4 0.572 Medium 88.276 39.143 104.440 173.2Bangladesh DHS 2007 0.291 73 36.1 0.543 Medium 91.166 78.269 128.291 157.8India DHS 2005 0.296 74 28.0 0.612 Medium 644.958 484.515 880.513 1164.7Nepal DHS 2006 0.350 82 32.1 0.553 Medium 18.322 15.593 21.961 28.3Population(millions,2007)www.ophi.org.uk July 2010 95
<strong>Acute</strong> <strong>Multidimensional</strong> <strong>Poverty</strong>: A <strong>New</strong> <strong>Index</strong> <strong>for</strong> <strong>Developing</strong> CountriesTable 1.4, ContinuedAlkire & SantosRegionCountrySurveyYearMPIValueMPIRankHuman Development Indicators cHPI-1 2009HDI 2009Value Value CategoryMPI poorpopulation(millions)Population in poverty a$1.25 a daypoor population(millions)$2 a daypoor population(millions)Sub-Saharan Africa 458.068 370.434 519.533 710.4South Africa* WHS 2003 0.014 28 25.4 0.683 Medium 1.510 12.890 21.107 49.2Ghana DHS 2008 0.140 57 28.1 0.526 Medium 6.894 6.870 12.274 22.9Gabon † § DHS 2000 0.161 59 17.5 0.755 Medium 0.495 0.067 0.274 1.4Zimbabwe DHS 2006 0.174 60 34.0 4.769 12.4Swaziland DHS 2007 0.183 62 35.1 0.572 Medium 0.494 0.755 0.972 1.2Namibia DHS 2007 0.187 63 17.1 0.686 Medium 0.832 1.031 1.306 2.1Lesotho DHS 2004 0.220 65 34.3 0.514 Medium 0.961 0.868 1.244 2.0Sao Tome and Principe † MICS 2000 0.236 66 12.6 0.651 Medium 0.103 0.2Republic of Congo DHS 2005 0.270 69 24.3 0.601 Medium 2.012 1.948 2.678 3.6Togo MICS 2006 0.284 72 36.6 0.499 Low 3.418 2.438 4.366 6.3Cameroon DHS 2004 0.299 75 30.8 0.523 Medium 10.211 6.134 10.790 18.7Kenya DHS 2003 0.302 76 29.5 0.541 Medium 22.835 7.447 15.082 37.8Cote d'Ivoire DHS 2005 0.320 78 37.4 0.484 Low 10.484 4.683 9.407 20.1Gambia MICS 2006 0.324 79 40.9 0.456 Low 0.967 0.549 0.907 1.6Zambia DHS 2007 0.325 80 35.5 0.481 Low 7.830 7.909 10.025 12.3Chad WHS 2003 0.344 81 53.1 0.392 Low 6.667 6.561 8.830 10.6Mauritania* MICS 2007 0.352 83 36.2 0.52 Medium 1.912 0.657 1.367 3.1Tanzania DHS 2008 0.367 84 30.0 0.53 Medium 26.952 36.551 39.896 41.3Nigeria DHS 2003 0.368 85 36.2 0.511 Medium 93.832 95.119 123.920 147.7Senegal DHS 2005 0.384 86 41.6 0.464 Low 7.964 3.987 7.176 11.9Malawi DHS 2004 0.384 87 28.2 0.493 Low 10.406 10.642 13.018 14.4DR Congo DHS 2007 0.393 88 38.0 0.389 Low 45.740 37.000 49.688 62.5Comoros † MICS 2000 0.408 89 20.4 0.576 Medium 0.444 0.277 0.390 0.6Benin DHS 2006 0.412 90 43.2 0.492 Low 6.044 3.973 6.325 8.4Madagascar DHS 2004 0.413 91 36.1 0.543 Medium 13.114 12.611 16.666 18.6Rwanda DHS 2005 0.443 92 32.9 0.46 Low 7.730 7.277 8.579 9.5Angola MICS 2001 0.452 93 37.2 0.564 Medium 13.614 9.557 12.355 17.6Population(millions,2007) cwww.ophi.org.uk July 2010 96
<strong>Acute</strong> <strong>Multidimensional</strong> <strong>Poverty</strong>: A <strong>New</strong> <strong>Index</strong> <strong>for</strong> <strong>Developing</strong> CountriesTable 1.4, ContinuedAlkire & SantosRegion Country Survey YearMPIValueMPIRankHuman Development Indicators cHPI-1 2009HDI 2009Value Value CategoryMPI poorpopulation(millions)Population in poverty a$1.25 a daypoor population(millions)$2 a daypoor population(millions)Sub-Saharan Africa (cont.)Mozambique DHS 2003 0.481 94 46.8 0.402 Low 17.475 16.359 19.710 21.9Liberia DHS 2007 0.484 95 35.2 0.442 Low 3.022 3.013 3.413 3.6Sierra Leone MICS 2005 0.489 96 47.7 0.365 Low 4.399 2.884 4.109 5.4Guinea DHS 2005 0.505 97 50.5 0.435 Low 7.906 6.730 8.371 9.6Central African Republic MICS 2000 0.512 98 42.4 0.369 Low 3.716 2.683 3.522 4.3Burundi MICS 2005 0.530 100 36.4 0.394 Low 6.591 6.341 7.285 7.8Burkina Faso MICS 2006 0.536 101 51.8 0.389 Low 12.142 8.306 11.936 14.7Mali DHS 2006 0.564 102 54.5 0.371 Low 10.806 6.374 9.560 12.4Ethiopia DHS 2005 0.582 103 50.9 0.414 Low 70.709 30.654 60.915 78.6Niger DHS 2006 0.642 104 55.8 0.34 Low 13.070 9.292 12.070 14.1Source <strong>for</strong> columns with (a): Alkire & Santos (2010) calculations.Source <strong>for</strong> columns with (b): World Bank (2009). 'World Development Indicators '. Washington DC: World Bank.Source <strong>for</strong> columns with (c) : UNDP (2009). Human Development Report 2009: Overcoming barriers: Human mobility and development. <strong>New</strong> York: United Nations.* The poverty estimates <strong>for</strong> these countries should be interpreted as lower bound estimates, meaning that multidimensional poverty is at least as great as their MPI values indicates.†The poverty estimates <strong>for</strong> these countries should be interpreted as upper bound estimates, meaning that multidimensional poverty is less than or equal to their MPI values.‡ Estimates are not country representative.§ In these countries we have in<strong>for</strong>mation on Body Mass <strong>Index</strong> only <strong>for</strong> the mothers of under five year old children.** Although there was in<strong>for</strong>mation on mortality <strong>for</strong> this country, the indicator had to be excluded from the estimates due to a very high percentage of missing values.Population(millions,2007) cwww.ophi.org.uk July 2010 97
<strong>Acute</strong> <strong>Multidimensional</strong> <strong>Poverty</strong>: A <strong>New</strong> <strong>Index</strong> <strong>for</strong> <strong>Developing</strong> CountriesAlkire & SantosTable 1.5 Censored headcounts by regionThe table shows the proportion of people who are MPI poor and experience deprivations in each of 10 indicators. Estimates are the same as in Table 1.2. The only difference is that countries aregrouped by region here. We clarify that these are ‘MPI’ poor people because people who are deprived in less than 30% of weighted indicators are not considered in these headcounts, and also becausedata on single deprivations may be inaccurate. For their in<strong>for</strong>mation on the raw percent of people deprived by dimension see Table 1.9.Region/CountrySurveyYearMPIValueMPIRankSchoolingProportion of people who are poor and deprived in…Education Health Living StandardChild SchoolAttendanceMortality Nutrition(any age)Electricity Sanitation DrinkingWaterFloor CookingFuelEurope and Commonwealth of Independent States (CIS)Slovakia † WHS 2003 0.000 1 0.000 0.000 0.000 0.000 0.000 0.000 0.000 0.000 0.000Slovenia † WHS 2003 0.000 1 0.000 0.000 0.000 0.000 0.000 0.000 0.000 0.000 0.000Czech Republic WHS 2003 0.000 3 0.000 0.000 0.000 0.000 0.000 0.000 0.000 0.000Belarus MICS 2005 0.000 4 0.000 0.000 0.000 0.000 0.000 0.000 0.000 0.000 0.000 0.000Latvia* WHS 2003 0.001 5 0.000 0.003 0.000 0.003 0.000 0.001 0.002Kazakhstan MICS 2006 0.002 7 0.000 0.002 0.005 0.002 0.000 0.001 0.003 0.000 0.005 0.003Georgia MICS 2005 0.003 9 0.001 0.003 0.004 0.001 0.001 0.003 0.004 0.001 0.008 0.005Hungary WHS 2003 0.003 10 0.000 0.008 0.000 0.000 0.000 0.006 0.000 0.002Bosnia and Herzegovina MICS 2006 0.003 11 0.004 0.002 0.005 0.001 0.001 0.001 0.000 0.005 0.002Serbia** MICS 2005 0.003 12 0.004 0.002 0.004 0.001 0.002 0.001 0.004 0.007 0.003Albania MICS 2005 0.004 13 0.001 0.006 0.007 0.003 0.000 0.002 0.002 0.001 0.008 0.002Russian Federation* WHS 2003 0.005 14 0.012 0.000 0.000 0.000 0.004 0.001 0.000 0.001 0.005Montenegro MICS 2005 0.006 17 0.007 0.008 0.009 0.000 0.004 0.002 0.000 0.009 0.001Croatia WHS 2003 0.007 18 0.012 0.004 0.000 0.003 0.001 0.001 0.012 0.007Ukraine DHS 2007 0.008 19 0.001 0.002 0.021 0.000 0.001 0.001 0.000 0.003 0.001Macedonia MICS 2005 0.008 20 0.014 0.015 0.005 0.001 0.002 0.008 0.004 0.006 0.015 0.005Armenia DHS 2005 0.008 21 0.000 0.018 0.016 0.009 0.000 0.005 0.002 0.001 0.005 0.004Moldova DHS 2005 0.008 22 0.006 0.007 0.009 0.006 0.003 0.015 0.006 0.010 0.017 0.013Uzbekistan MICS 2006 0.008 23 0.000 0.012 0.019 0.009 0.001 0.001 0.006 0.007 0.009 0.009Kyrgyzstan MICS 2006 0.019 30 0.014 0.028 0.021 0.000 0.010 0.016 0.012 0.028 0.024Azerbaijan DHS 2006 0.021 33 0.001 0.028 0.033 0.028 0.001 0.024 0.031 0.008 0.014 0.023Estonia WHS 2003 0.026 37 0.072 0.000 0.002 0.000 0.006 0.003 0.000 0.024 0.004Turkey § DHS 2003 0.039 38 0.019 0.062 0.056 0.015 0.085 0.048 0.030 0.020 0.020Tajikistan MICS 2005 0.068 49 0.001 0.076 0.122 0.063 0.003 0.034 0.105 0.120 0.101 0.084Assetswww.ophi.org.uk July 2010 98
<strong>Acute</strong> <strong>Multidimensional</strong> <strong>Poverty</strong>: A <strong>New</strong> <strong>Index</strong> <strong>for</strong> <strong>Developing</strong> CountriesTable 1.5, ContinuedAlkire & SantosRegion/CountrySurveyYearMPIValueMPIRankSchoolingProportion of people who are poor and deprived in…Education Health Living StandardChild SchoolAttendanceMortality Nutrition(any age)Electricity Sanitation DrinkingWaterFloor CookingFuelLatin America and CaribbeanUruguay WHS 2003 0.006 15 0.017 0.000 0.000 0.000 0.000 0.000 0.000 0.003 0.000Ecuador WHS 2003 0.009 24 0.022 0.001 0.001 0.002 0.006 0.007 0.002 0.003 0.011Argentina ‡ ENNyS 2005 0.011 27 0.028 0.000 0.003 0.007 0.007 0.022 0.002 0.016 0.022 0.022Mexico ENSANUT 2006 0.015 29 0.021 0.015 0.015 0.007 0.006 0.021 0.006 0.022 0.028 0.022Trinidad and Tobago MICS 2006 0.020 31 0.000 0.001 0.056 0.003 0.005 0.003 0.002 0.000 0.002Belize MICS 2006 0.024 35 0.009 0.023 0.031 0.020 0.039 0.025 0.019 0.025 0.041 0.027Brazil WHS 2003 0.039 39 0.081 0.013 0.000 0.039 0.020 0.016 0.066 0.001Colombia DHS 2005 0.041 40 0.038 0.040 0.039 0.040 0.022 0.047 0.034 0.040 0.064 0.058Suriname MICS 2000 0.044 41 0.062 0.052 0.033 0.022 0.060 0.048 0.033Dominican Republic MICS 2000 0.048 42 0.080 0.036 0.042 0.010 0.040 0.100 0.036 0.034 0.071 0.074Guyana DHS 2005 0.055 43 0.006 0.005 0.125 0.052 0.050 0.028 0.012 0.029 0.033Paraguay WHS 2003 0.064 46 0.068 0.046 0.027 0.045 0.112 0.088 0.075 0.124 0.087Peru DHS 2004 0.085 51 0.048 0.032 0.083 0.015 0.155 0.192 0.139 0.174 0.191 0.155Guatemala* WHS 2003 0.127 54 0.218 0.050 0.026 0.105 0.066 0.037 0.157 0.230 0.154Honduras DHS 2006 0.160 58 0.135 0.228 0.106 0.070 0.232 0.119 0.198 0.297 0.198Bolivia DHS 2003 0.175 61 0.089 0.231 0.194 0.046 0.234 0.355 0.160 0.252 0.281 0.191Nicaragua DHS 2001 0.211 64 0.219 0.216 0.147 0.066 0.254 0.360 0.247 0.305 0.395 0.296Haiti DHS 2006 0.306 77 0.320 0.189 0.274 0.114 0.506 0.530 0.360 0.349 0.570 0.491East Asia and the PacificThailand MICS 2005 0.006 16 0.011 0.004 0.007 0.005 0.001 0.005 0.005 0.003 0.012 0.005China WHS 2003 0.056 44 0.109 0.002 0.032 0.000 0.077 0.030 0.032 0.091 0.024Mongolia MICS 2005 0.065 47 0.021 0.039 0.086 0.022 0.073 0.137 0.116 0.081 0.157 0.095Philippines DHS 2003 0.067 48 0.023 0.048 0.102 0.077 0.078 0.042 0.033 0.094Viet Nam DHS 2002 0.075 50 0.045 0.036 0.099 0.052 0.125 0.130 0.062 0.061Myanmar* MICS 2000 0.088 52 0.082 0.087 0.089 0.098 0.121 0.028 0.114Indonesia DHS 2007 0.095 53 0.040 0.049 0.144 0.043 0.132 0.103 0.046 0.155 0.101Cambodia DHS 2005 0.263 67 0.237 0.258 0.234 0.145 0.504 0.502 0.297 0.048 0.535 0.230Lao MICS 2006 0.267 68 0.245 0.284 0.223 0.334 0.386 0.278 0.084 0.471 0.323Assetswww.ophi.org.uk July 2010 99
<strong>Acute</strong> <strong>Multidimensional</strong> <strong>Poverty</strong>: A <strong>New</strong> <strong>Index</strong> <strong>for</strong> <strong>Developing</strong> CountriesAlkire & SantosTable 1.5, ContinuedProportion of people who are poor and deprived in…MPI MPI Education Health Living StandardRegion/CountrySurvey YearValue RankChild School MortalitySchoolingAttendance (any age) NutritionDrinking CookingElectricity Sanitation FloorAssetsWaterFuelArab StatesUnited Arab Emirates WHS 2003 0.002 6 0.006 0.000 0.000 0.000 0.001 0.001 0.000 0.000 0.000Occupied Palestinian Territories MICS 2006 0.0027 8 0.004 0.006 0.000 0.003 0.000 0.000 0.000 0.005 0.000 0.002Jordan DHS 2007 0.0096 25 0.002 0.017 0.016 0.018 0.002 0.003 0.004 0.000 0.001 0.002Tunisia* WHS 2003 0.0105 26 0.008 0.018 0.012 0.002 0.014 0.012 0.004 0.005 0.015Syrian Arab Republic † MICS 2006 0.0207 34 0.013 0.044 0.032 0.021 0.002 0.010 0.017 0.010 0.001 0.005Egypt DHS 2008 0.0259 36 0.027 0.049 0.040 0.018 0.002 0.011 0.004 0.024 0.015Iraq MICS 2006 0.0588 45 0.049 0.119 0.076 0.038 0.010 0.051 0.064 0.040 0.027 0.024Djibouti MICS 2006 0.1385 55 0.135 0.183 0.098 0.106 0.204 0.163 0.067 0.178 0.088 0.226Morocco DHS 2004 0.1392 56 0.176 0.147 0.130 0.096 0.161 0.159 0.159 0.142 0.080 0.156Yemen MICS 2006 0.2832 71 0.125 0.335 0.344 0.312 0.257 0.319 0.208 0.284 0.274Somalia MICS 2006 0.5137 99 0.618 0.435 0.274 0.300 0.758 0.691 0.700 0.644 0.810 0.762South AsiaSri Lanka* WHS 2003 0.0206 32 0.004 0.003 0.041 0.035 0.026 0.030 0.025 0.053 0.048Pakistan* DHS 2007 0.2754 70 0.193 0.344 0.300 0.089 0.333 0.081 0.363 0.419 0.260Bangladesh DHS 2007 0.2914 73 0.237 0.090 0.238 0.365 0.388 0.482 0.025 0.541 0.567 0.453India DHS 2005 0.2962 74 0.176 0.250 0.228 0.389 0.287 0.493 0.121 0.400 0.522 0.381Nepal DHS 2006 0.3499 82 0.292 0.156 0.300 0.403 0.434 0.563 0.144 0.601 0.634 0.467www.ophi.org.uk July 2010 100
<strong>Acute</strong> <strong>Multidimensional</strong> <strong>Poverty</strong>: A <strong>New</strong> <strong>Index</strong> <strong>for</strong> <strong>Developing</strong> CountriesTable 1.5, ContinuedAlkire & SantosRegion/CountrySurveyYearMPIValueMPIRankSchoolingEducationChild SchoolAttendanceProportion of people who are poor and deprived in…HealthLiving StandardMortality Nutrition(any age)Electricity Sanitation DrinkingWaterFloor CookingFuelSub-Saharan AfricaSouth Africa* WHS 2003 0.0143 28 0.025 0.001 0.009 0.020 0.008 0.014 0.018 0.006Ghana DHS 2008 0.1397 57 0.156 0.107 0.103 0.065 0.237 0.289 0.122 0.110 0.300 0.166Gabon † § DHS 2000 0.1609 59 0.090 0.084 0.184 0.120 0.212 0.326 0.194 0.198 0.269 0.265Zimbabwe DHS 2006 0.1739 60 0.033 0.110 0.143 0.129 0.369 0.309 0.241 0.254 0.378 0.335Swaziland DHS 2007 0.1828 62 0.065 0.174 0.228 0.074 0.372 0.376 0.239 0.105 0.375 0.201Namibia DHS 2007 0.187 63 0.083 0.086 0.143 0.203 0.361 0.367 0.152 0.318 0.376 0.248Lesotho DHS 2004 0.2201 65 0.133 0.180 0.158 0.058 0.480 0.448 0.255 0.317 0.428 0.448Sao Tome and Principe † MICS 2000 0.2364 66 0.300 0.127 0.242 0.077 0.362 0.489 0.219 0.003 0.501 0.445Republic of Congo DHS 2005 0.2703 69 0.061 0.161 0.295 0.209 0.467 0.543 0.350 0.349 0.538 0.442Togo MICS 2006 0.2844 72 0.237 0.246 0.261 0.173 0.497 0.529 0.334 0.181 0.542 0.286Cameroon DHS 2004 0.2985 75 0.229 0.265 0.337 0.088 0.452 0.494 0.328 0.423 0.536 0.384Kenya DHS 2003 0.3021 76 0.123 0.140 0.254 0.221 0.591 0.588 0.481 0.519 0.594 0.451Cote d'Ivoire DHS 2005 0.3202 78 0.261 0.359 0.372 0.291 0.471 0.222 0.153 0.254Gambia MICS 2006 0.3236 79 0.283 0.368 0.382 0.214 0.542 0.321 0.208 0.220 0.603 0.191Zambia DHS 2007 0.3253 80 0.133 0.202 0.360 0.183 0.616 0.571 0.496 0.516 0.627 0.392Chad WHS 2003 0.3442 81 0.423 0.024 0.070 0.619 0.584 0.429 0.600 0.613 0.531Mauritania* MICS 2007 0.352 83 0.360 0.315 0.266 0.190 0.530 0.545 0.454 0.449 0.534 0.432Tanzania DHS 2008 0.3673 84 0.134 0.241 0.356 0.627 0.641 0.474 0.556 0.650 0.406Nigeria DHS 2003 0.3676 85 0.254 0.305 0.415 0.302 0.418 0.622 0.499 0.323 0.605 0.323Senegal DHS 2005 0.3842 86 0.385 0.502 0.440 0.125 0.490 0.514 0.317 0.326 0.532 0.381Malawi DHS 2004 0.3844 87 0.291 0.249 0.336 0.191 0.712 0.718 0.442 0.643 0.721 0.483DR Congo DHS 2007 0.3932 88 0.144 0.403 0.371 0.170 0.691 0.620 0.555 0.649 0.727 0.573Comoros † MICS 2000 0.4085 89 0.308 0.479 0.270 0.272 0.543 0.728 0.450 0.283 0.723 0.637Benin DHS 2006 0.4123 90 0.423 0.408 0.377 0.241 0.651 0.696 0.334 0.399 0.714 0.281Madagascar DHS 2004 0.4128 91 0.427 0.322 0.266 0.337 0.679 0.609 0.588 0.158 0.705 0.634Rwanda DHS 2005 0.4426 92 0.375 0.288 0.402 0.117 0.803 0.662 0.641 0.757 0.813 0.744Angola MICS 2001 0.452 93 0.433 0.304 0.445 0.233 0.671 0.685 0.513 0.612 0.710 0.697Assetswww.ophi.org.uk July 2010 101
<strong>Acute</strong> <strong>Multidimensional</strong> <strong>Poverty</strong>: A <strong>New</strong> <strong>Index</strong> <strong>for</strong> <strong>Developing</strong> CountriesTable 1.5, ContinuedAlkire & SantosRegion/Country Survey YearMPIValueMPIRankProportion of people who are poor and deprived in…Education Health Living StandardChild SchoolAttendanceSchooling Mortality NutritionAssets(any age)Mozambique DHS 2003 0.4807 94 0.556 0.403 0.393 0.226 0.778 0.525 0.571 0.691 0.796 0.558Liberia DHS 2007 0.4839 95 0.303 0.557 0.490 0.236 0.828 0.788 0.338 0.508 0.839 0.650Sierra Leone MICS 2005 0.4891 96 0.464 0.335 0.494 0.220 0.779 0.775 0.523 0.625 0.815 0.748Guinea DHS 2005 0.5047 97 0.542 0.532 0.527 0.169 0.741 0.754 0.376 0.521 0.823 0.559Central African Republic MICS 2000 0.5123 98 0.357 0.627 0.471 0.245 0.820 0.533 0.536 0.861 0.687Burundi MICS 2005 0.5298 100 0.529 0.473 0.356 0.835 0.631 0.516 0.812 0.843 0.756Burkina Faso MICS 2006 0.5358 101 0.551 0.641 0.500 0.354 0.775 0.696 0.430 0.555 0.824 0.228Mali DHS 2006 0.5639 102 0.608 0.577 0.516 0.362 0.788 0.799 0.437 0.714 0.870 0.354Ethiopia DHS 2005 0.5824 103 0.615 0.649 0.376 0.209 0.857 0.876 0.543 0.875 0.896 0.887Niger DHS 2006 0.6425 104 0.664 0.697 0.580 0.246 0.875 0.895 0.646 0.855 0.926 0.805* The poverty estimates <strong>for</strong> these countries should be interpreted as lower bound estimates, meaning that multidimensional poverty is at least as great as their MPI values indicates.†The poverty estimates <strong>for</strong> these countries should be interpreted as upper bound estimates, meaning that multidimensional poverty is less than or equal to their MPI values.Electricity Sanitation DrinkingWater‡ Estimates are not country representative.§ In these countries we have in<strong>for</strong>mation on Body Mass <strong>Index</strong> only <strong>for</strong> the mothers of under five year old children.** Although there was in<strong>for</strong>mation on mortality <strong>for</strong> this country, the indicator had to be excluded from the estimates due to a very high percentage of missing values.Floor CookingFuelwww.ophi.org.uk July 2010 102
<strong>Acute</strong> <strong>Multidimensional</strong> <strong>Poverty</strong>: A <strong>New</strong> <strong>Index</strong> <strong>for</strong> <strong>Developing</strong> CountriesAlkire & SantosTable 1.6 Contribution of deprivations by regionThe table shows which dimensions contribute more to MPI. Estimates are the same as in Table 1.3, the only difference is thatcountries are grouped by region hereRegion/Country Survey YearMPIValueMPIRankPercent Contribution of Deprivations in…LivingEducation HealthStandardEurope and Commonwealth of Independent States (CIS)Slovakia † WHS 2003 0.000 1 0.00 0.00 0.00Slovenia † WHS 2003 0.000 1 0.00 0.00 0.00Czech Republic WHS 2003 0.000 3 0.00 71.43 28.57Belarus MICS 2005 0.000 4 16.58 61.75 21.67Latvia* WHS 2003 0.001 5 0.00 71.43 28.57Kazakhstan MICS 2006 0.002 7 14.55 56.78 28.67Georgia MICS 2005 0.003 9 23.16 33.82 43.02Hungary WHS 2003 0.003 10 0.00 85.71 14.29Bosnia and Herzegovina MICS 2006 0.003 11 29.20 51.78 19.02Serbia** MICS 2005 0.003 12 30.51 40.12 29.37Albania MICS 2005 0.004 13 33.44 43.86 22.70Russian Federation* WHS 2003 0.005 14 84.19 2.46 13.34Montenegro MICS 2005 0.006 17 37.54 47.60 14.86Croatia WHS 2003 0.007 18 59.70 20.50 19.80Ukraine DHS 2007 0.008 19 5.82 89.86 4.32Macedonia MICS 2005 0.008 20 59.86 12.85 27.29Armenia DHS 2005 0.008 21 36.23 51.45 12.32Moldova DHS 2005 0.008 22 26.36 31.08 42.56Uzbekistan MICS 2006 0.008 23 23.18 55.69 21.13Kyrgyzstan MICS 2006 0.019 30 36.65 36.94 26.41Azerbaijan DHS 2006 0.021 33 23.44 49.75 26.81Estonia WHS 2003 0.026 37 91.22 1.18 7.60Turkey § DHS 2003 0.039 38 34.83 30.25 34.92Tajikistan MICS 2005 0.068 49 18.71 45.03 36.27Latin America and CaribbeanUruguay WHS 2003 0.006 15 96.05 0.58 3.38Ecuador WHS 2003 0.009 24 78.64 3.25 18.11Argentina ‡ ENNyS 2005 0.011 27 41.10 13.77 45.13Mexico ENSANUT 2006 0.015 29 38.64 23.88 37.55Trinidad and Tobago MICS 2006 0.020 31 1.29 94.29 4.42Belize MICS 2006 0.024 35 22.80 35.82 41.39Brazil WHS 2003 0.039 39 69.13 10.83 20.04Colombia DHS 2005 0.041 40 31.74 32.07 36.19Suriname MICS 2000 0.044 41 43.16 21.04 35.80Dominican Republic MICS 2000 0.048 42 40.60 18.10 41.30Guyana DHS 2005 0.055 43 3.24 76.03 20.72Paraguay WHS 2003 0.064 46 35.10 19.03 45.87Peru DHS 2004 0.085 51 15.43 19.06 65.50Guatemala* WHS 2003 0.127 54 57.22 9.98 32.79Honduras DHS 2006 0.160 58 37.95 18.42 43.63Bolivia DHS 2003 0.175 61 30.43 22.86 46.71Nicaragua DHS 2001 0.211 64 34.37 16.79 48.84Haiti DHS 2006 0.306 77 27.79 21.18 51.03East Asia and the PacificThailand MICS 2005 0.006 16 40.72 31.15 28.13China WHS 2003 0.056 44 64.85 9.90 25.25Mongolia MICS 2005 0.065 47 15.45 27.91 56.64Philippines DHS 2003 0.067 48 17.49 50.39 32.13Viet Nam DHS 2002 0.075 50 17.97 43.75 38.29Myanmar* MICS 2000 0.088 52 31.93 33.86 34.21Indonesia DHS 2007 0.095 53 15.67 50.52 33.82Cambodia DHS 2005 0.263 67 31.34 23.99 44.66Lao MICS 2006 0.267 68 33.08 27.87 39.05www.ophi.org.uk July 2010 103
<strong>Acute</strong> <strong>Multidimensional</strong> <strong>Poverty</strong>: A <strong>New</strong> <strong>Index</strong> <strong>for</strong> <strong>Developing</strong> CountriesAlkire & SantosTable 1.6, ContinuedRegion/CountrySurveyYearMPIRankPercent Contribution of Deprivations in…LivingEducation HealthStandardArab StatesUnited Arab Emirates WHS 2003 0.002 6 94.39 0.37 5.25Occupied Palestinian Territories MICS 2006 0.003 8 62.14 20.93 16.93Jordan DHS 2007 0.010 25 34.49 59.19 6.32Tunisia* WHS 2003 0.010 26 25.05 47.31 27.64Syrian Arab Republic † MICS 2006 0.021 34 45.43 42.73 11.84Egypt DHS 2008 0.026 36 48.40 37.16 14.44Iraq MICS 2006 0.059 45 47.53 32.12 20.35Djibouti MICS 2006 0.139 55 38.30 24.57 37.13Morocco DHS 2004 0.139 56 38.70 27.09 34.21Yemen MICS 2006 0.283 71 27.04 40.51 32.45Somalia MICS 2006 0.514 99 34.16 18.63 47.21South AsiaSri Lanka* WHS 2003 0.021 32 6.26 35.40 58.34Pakistan* DHS 2007 0.275 70 32.50 36.35 31.14Bangladesh DHS 2007 0.291 73 18.70 34.50 46.81India DHS 2005 0.296 74 23.99 34.68 41.33Nepal DHS 2006 0.350 82 21.32 33.53 45.15Sub-Saharan AfricaSouth Africa* WHS 2003 0.014 28 57.84 11.72 30.44Ghana DHS 2008 0.140 57 31.37 19.98 48.65Gabon † § DHS 2000 0.161 59 18.01 31.45 50.54Zimbabwe DHS 2006 0.174 60 13.70 26.06 60.24Swaziland DHS 2007 0.183 62 21.83 27.51 50.67Namibia DHS 2007 0.187 63 15.03 30.84 54.12Lesotho DHS 2004 0.220 65 23.73 16.33 59.94Sao Tome and Principe † MICS 2000 0.236 66 30.08 22.49 47.43Republic of Congo DHS 2005 0.270 69 13.67 31.07 55.26Togo MICS 2006 0.284 72 28.31 25.40 46.29Cameroon DHS 2004 0.299 75 27.55 23.75 48.70Kenya DHS 2003 0.302 76 14.54 26.17 59.28Cote d'Ivoire DHS 2005 0.320 78 32.29 38.73 28.98Gambia MICS 2006 0.324 79 33.53 30.69 35.78Zambia DHS 2007 0.325 80 17.21 27.85 54.95Chad WHS 2003 0.344 81 40.92 4.57 54.50Mauritania* MICS 2007 0.352 83 31.96 21.58 46.46Tanzania DHS 2008 0.367 84 17.00 32.29 50.71Nigeria DHS 2003 0.368 85 25.34 32.48 42.18Senegal DHS 2005 0.384 86 38.46 24.49 37.04Malawi DHS 2004 0.384 87 23.41 22.85 53.74DR Congo DHS 2007 0.393 88 23.18 22.93 53.89Comoros † MICS 2000 0.408 89 32.13 22.10 45.76Benin DHS 2006 0.412 90 33.60 24.96 41.44Madagascar DHS 2004 0.413 91 30.26 24.33 45.40Rwanda DHS 2005 0.443 92 24.95 19.55 55.50Angola MICS 2001 0.452 93 27.19 25.01 47.80MPIwww.ophi.org.uk July 2010 104
<strong>Acute</strong> <strong>Multidimensional</strong> <strong>Poverty</strong>: A <strong>New</strong> <strong>Index</strong> <strong>for</strong> <strong>Developing</strong> CountriesAlkire & SantosTable 1.6 ContinuedRegion/CountrySurveyYearPercent Contribution of Deprivations in…LivingEducation HealthStandardMozambique DHS 2003 0.481 94 33.26 21.45 45.29Liberia DHS 2007 0.484 95 29.60 25.02 45.37Sierra Leone MICS 2005 0.489 96 27.22 24.35 48.43Guinea DHS 2005 0.505 97 35.48 22.97 41.55Central African Republic MICS 2000 0.512 98 32.01 23.26 44.73Burundi MICS 2005 0.530 100 31.55 22.38 46.07Burkina Faso MICS 2006 0.536 101 37.07 26.55 36.38Mali DHS 2006 0.564 102 35.03 25.93 39.04Ethiopia DHS 2005 0.582 103 36.19 16.74 47.06Niger DHS 2006 0.642 104 35.31 21.44 43.25* The poverty estimates <strong>for</strong> these countries should be interpreted as lower bound estimates, meaning that multidimensionalpoverty is at least as great as their MPI values indicates.†The poverty estimates <strong>for</strong> these countries should be interpreted as upper bound estimates, meaning that multidimensional povertyis less than or equal to their MPI values.‡ Estimates are not country representative.§ In these countries we have in<strong>for</strong>mation on Body Mass <strong>Index</strong> only <strong>for</strong> the mothers of under five year old children.** Although there was in<strong>for</strong>mation on mortality <strong>for</strong> this country, the indicator had to be excluded from the estimates due to a veryhigh percentage of missing values.MPIMPIRankwww.ophi.org.uk July 2010 105
<strong>Acute</strong> <strong>Multidimensional</strong> <strong>Poverty</strong>: A <strong>New</strong> <strong>Index</strong> <strong>for</strong> <strong>Developing</strong> CountriesAlkire & SantosTable 1.7 MPI Ranks with k=2 as the cross-dimensional cutoffThe table ranks 104 countries from low poverty to high poverty, when we require households to be deprived in at least 20 % of theweighted indicators (two to four indicators) to be considered poor (rather than requiring 30%). It also gives income poverty figuresCountry Survey YearMPIValue<strong>Multidimensional</strong> <strong>Poverty</strong>H(Proportionof poor)MPIRankA(Average intensity ofdeprivations)Slovakia † WHS 2003 0.000 1 0.000 0.222Slovenia † WHS 2003 0.001 2 0.004 0.222Belarus MICS 2005 0.002 3 0.008 0.231Uruguay WHS 2003 0.006 4 0.018 0.342Latvia* WHS 2003 0.006 5 0.016 0.379United Arab Emirates WHS 2003 0.007 6 0.026 0.252Russian Federation* WHS 2003 0.007 7 0.020 0.325Czech Republic WHS 2003 0.010 8 0.031 0.334Ukraine DHS 2007 0.011 9 0.033 0.314Montenegro MICS 2005 0.011 10 0.034 0.317Serbia** MICS 2005 0.012 11 0.045 0.266Jordan DHS 2007 0.013 12 0.043 0.307Kazakhstan MICS 2006 0.014 13 0.056 0.249Ecuador WHS 2003 0.014 14 0.043 0.328Georgia MICS 2005 0.016 15 0.061 0.256Hungary WHS 2003 0.016 16 0.046 0.343Croatia WHS 2003 0.016 17 0.044 0.363Bosnia and Herzegovina MICS 2006 0.019 18 0.078 0.244Trinidad and Tobago MICS 2006 0.021 19 0.060 0.343Armenia DHS 2005 0.021 20 0.078 0.270Tunisia* WHS 2003 0.022 21 0.077 0.288Macedonia MICS 2005 0.024 22 0.087 0.274Argentina ‡ ENNyS 2005 0.025 23 0.087 0.287Albania MICS 2005 0.026 24 0.104 0.246Moldova DHS 2005 0.026 25 0.094 0.273South Africa* WHS 2003 0.027 26 0.070 0.384Uzbekistan MICS 2006 0.028 27 0.104 0.265Thailand MICS 2005 0.029 28 0.115 0.254Estonia WHS 2003 0.029 29 0.086 0.343Mexico ENSANUT 2006 0.029 30 0.098 0.301Occupied Palestinian Territories MICS 2006 0.032 31 0.134 0.239Syrian Arab Republic † MICS 2006 0.037 32 0.126 0.294Kyrgyzstan MICS 2006 0.041 33 0.141 0.290Belize MICS 2006 0.042 34 0.132 0.321Egypt DHS 2008 0.043 35 0.133 0.324Azerbaijan DHS 2006 0.050 36 0.177 0.283Sri Lanka* WHS 2003 0.056 37 0.197 0.285Colombia DHS 2005 0.061 38 0.175 0.346Suriname MICS 2000 0.063 39 0.126 0.497Guyana DHS 2005 0.070 40 0.203 0.347China WHS 2003 0.071 41 0.187 0.381Dominican Republic MICS 2000 0.080 42 0.242 0.331Brazil WHS 2003 0.083 43 0.216 0.383Turkey § DHS 2003 0.087 44 0.275 0.315Iraq MICS 2006 0.093 45 0.286 0.325Paraguay WHS 2003 0.101 46 0.282 0.357Philippines DHS 2003 0.102 47 0.237 0.432Viet Nam DHS 2002 0.112 48 0.263 0.425Mongolia MICS 2005 0.116 49 0.364 0.317Indonesia DHS 2007 0.125 50 0.330 0.380Tajikistan MICS 2005 0.125 51 0.401 0.313Peru DHS 2004 0.129 52 0.369 0.349Guatemala* WHS 2003 0.151 53 0.357 0.422Myanmar* MICS 2000 0.154 54 0.318 0.483www.ophi.org.uk July 2010 106
<strong>Acute</strong> <strong>Multidimensional</strong> <strong>Poverty</strong>: A <strong>New</strong> <strong>Index</strong> <strong>for</strong> <strong>Developing</strong> CountriesAlkire & SantosTable 1.7, Continuedwww.ophi.org.uk July 2010 107
<strong>Acute</strong> <strong>Multidimensional</strong> <strong>Poverty</strong>: A <strong>New</strong> <strong>Index</strong> <strong>for</strong> <strong>Developing</strong> CountriesAlkire & SantosCountry Survey YearMPIValue<strong>Multidimensional</strong> <strong>Poverty</strong>MPIRankH(ProportionA(Average intensity ofdeprivations)of poor)Morocco DHS 2004 0.167 55 0.399 0.419Djibouti MICS 2006 0.177 56 0.454 0.391Ghana DHS 2008 0.193 57 0.515 0.374Honduras DHS 2006 0.207 58 0.504 0.410Gabon † § DHS 2000 0.216 59 0.577 0.373Bolivia DHS 2003 0.227 60 0.579 0.392Zimbabwe DHS 2006 0.235 61 0.630 0.374Swaziland DHS 2007 0.244 62 0.656 0.371Namibia DHS 2007 0.246 63 0.631 0.390Nicaragua DHS 2001 0.250 64 0.564 0.443Lesotho DHS 2004 0.289 65 0.755 0.383Sao Tome and Principe † MICS 2000 0.295 66 0.756 0.390Lao MICS 2006 0.302 67 0.614 0.492Pakistan* DHS 2007 0.304 68 0.627 0.485Cambodia DHS 2005 0.312 69 0.740 0.421Yemen MICS 2006 0.315 70 0.655 0.481Republic of Congo DHS 2005 0.327 71 0.784 0.417India DHS 2005 0.337 72 0.715 0.471Togo MICS 2006 0.338 73 0.758 0.446Cameroon DHS 2004 0.344 74 0.729 0.473Bangladesh DHS 2007 0.345 75 0.790 0.436Haiti DHS 2006 0.352 76 0.757 0.464Kenya DHS 2003 0.361 77 0.836 0.432Gambia MICS 2006 0.368 78 0.780 0.472Zambia DHS 2007 0.370 79 0.814 0.455Cote d'Ivoire DHS 2005 0.373 80 0.685 0.545Nepal DHS 2006 0.389 81 0.804 0.484Mauritania* MICS 2007 0.389 82 0.767 0.508Nigeria DHS 2003 0.407 83 0.792 0.513Senegal DHS 2005 0.412 84 0.785 0.526Chad WHS 2003 0.417 85 0.911 0.458Tanzania DHS 2008 0.426 86 0.883 0.483DR Congo DHS 2007 0.434 87 0.893 0.486Malawi DHS 2004 0.435 88 0.921 0.472Benin DHS 2006 0.446 89 0.852 0.524Comoros † MICS 2000 0.449 90 0.899 0.499Madagascar DHS 2004 0.451 91 0.853 0.528Rwanda DHS 2005 0.479 92 0.954 0.502Angola MICS 2001 0.479 93 0.880 0.544Mozambique DHS 2003 0.505 94 0.896 0.564Liberia DHS 2007 0.508 95 0.934 0.544Sierra Leone MICS 2005 0.517 96 0.926 0.558Guinea DHS 2005 0.529 97 0.918 0.576Central African Republic MICS 2000 0.533 98 0.940 0.567Somalia MICS 2006 0.538 99 0.906 0.593Burkina Faso MICS 2006 0.557 100 0.912 0.611Burundi MICS 2005 0.562 101 0.967 0.580Mali DHS 2006 0.583 102 0.944 0.617Ethiopia DHS 2005 0.595 103 0.951 0.626Niger DHS 2006 0.653 104 0.967 0.675* The poverty estimates <strong>for</strong> these countries should be interpreted as lower bound estimates, meaning thatmultidimensional poverty is at least as great as their MPI values indicates.†The poverty estimates <strong>for</strong> these countries should be interpreted as upper bound estimates, meaning that multidimensionalpoverty is less than or equal to their MPI values.‡ Estimates are not country representative.§In these countries we have in<strong>for</strong>mation on Body Mass <strong>Index</strong> only <strong>for</strong> the mothers of under five year old children.** Although there was in<strong>for</strong>mation on mortality <strong>for</strong> this country, the indicator had to be excluded from the estimates dueto a very high percentage of missing values.www.ophi.org.uk July 2010 108
<strong>Acute</strong> <strong>Multidimensional</strong> <strong>Poverty</strong>: A <strong>New</strong> <strong>Index</strong> <strong>for</strong> <strong>Developing</strong> CountriesAlkire & SantosTable 1.8 Censored Headcounts and Contribution of deprivations to MPI with k=2.The table shows the proportion of people who are MPI poor (using a cutoff of being deprived in 20% or more of the weighted indicators) and experience deprivations in each of 10indicators. It also shows which dimensions contribute more to MPI with k=2Country Survey YearMPI MPIValue RankSchoolingProportion of people who are poor and deprived in…Percent Contribution ofEducationHealthLiving StandardDeprivations in…Child School MortalityDrinkingNutrition Electricity Sanitation Floor Cooking Assets Education Health LivingAttendance (any age) Water FuelStandardSlovakia † WHS 2003 0.000 1 0.000 0.000 0.000 0.000 0.000 0.000 0.000 0.000 0.000 0.00 75.00 25.00Slovenia † WHS 2003 0.001 2 0.000 0.000 0.004 0.000 0.000 0.001 0.000 0.004 0.000 0.00 75.00 25.00Belarus MICS 2005 0.002 3 0.004 0.000 0.004 0.001 0.000 0.003 0.000 0.000 0.004 0.002 36.25 37.34 26.41Uruguay WHS 2003 0.006 4 0.017 0.001 0.000 0.000 0.000 0.000 0.000 0.003 0.001 93.58 2.49 3.93Latvia* WHS 2003 0.006 5 0.000 0.016 0.000 0.008 0.000 0.001 0.002 0.00 88.00 12.00United Arab Emirates WHS 2003 0.007 6 0.006 0.002 0.018 0.000 0.003 0.020 0.000 0.000 0.000 29.17 51.60 19.23Russian Federation* WHS 2003 0.007 7 0.012 0.004 0.005 0.000 0.005 0.001 0.000 0.004 0.009 62.16 21.45 16.39Czech Republic WHS 2003 0.010 8 0.000 0.031 0.000 0.000 0.000 0.000 0.000 0.000 0.00 99.86 0.14Ukraine DHS 2007 0.011 9 0.007 0.007 0.021 0.000 0.005 0.003 0.001 0.007 0.004 22.43 66.95 10.62Montenegro MICS 2005 0.011 10 0.021 0.012 0.009 0.000 0.009 0.004 0.001 0.026 0.003 50.41 27.76 21.83Serbia** MICS 2005 0.012 11 0.036 0.005 0.004 0.001 0.004 0.003 0.007 0.041 0.009 58.26 11.26 30.48Jordan DHS 2007 0.013 12 0.007 0.020 0.020 0.023 0.004 0.009 0.008 0.000 0.001 0.006 33.75 54.05 12.19Kazakhstan MICS 2006 0.014 13 0.002 0.004 0.042 0.011 0.000 0.004 0.014 0.000 0.043 0.013 8.08 62.55 29.37Ecuador WHS 2003 0.014 14 0.022 0.005 0.013 0.005 0.014 0.012 0.008 0.006 0.027 50.84 20.68 28.48Georgia MICS 2005 0.016 15 0.006 0.012 0.036 0.004 0.004 0.010 0.010 0.001 0.056 0.024 19.95 42.27 37.78Hungary WHS 2003 0.016 16 0.001 0.045 0.000 0.000 0.000 0.006 0.000 0.002 1.76 95.57 2.68Croatia WHS 2003 0.016 17 0.021 0.022 0.000 0.003 0.001 0.001 0.012 0.007 45.02 46.69 8.29Bosnia and Herzegovina MICS 2006 0.019 18 0.053 0.022 0.005 0.001 0.005 0.003 0.001 0.074 0.007 65.37 8.20 26.43Trinidad and Tobago MICS 2006 0.021 19 0.002 0.002 0.056 0.005 0.007 0.005 0.002 0.001 0.003 3.57 89.96 6.47Armenia DHS 2005 0.021 20 0.002 0.041 0.036 0.019 0.000 0.025 0.014 0.003 0.017 0.025 34.14 43.44 22.43Tunisia* WHS 2003 0.022 21 0.008 0.047 0.026 0.006 0.036 0.030 0.012 0.014 0.040 11.76 54.09 34.15Macedonia MICS 2005 0.024 22 0.027 0.024 0.046 0.005 0.002 0.031 0.010 0.010 0.064 0.007 35.61 35.46 28.93Argentina ‡ ENNyS 2005 0.025 23 0.071 0.000 0.004 0.011 0.011 0.048 0.005 0.030 0.045 0.052 47.57 10.00 42.44Albania MICS 2005 0.026 24 0.021 0.030 0.042 0.017 0.000 0.006 0.007 0.006 0.100 0.010 33.20 38.70 28.10Moldova DHS 2005 0.026 25 0.021 0.016 0.029 0.024 0.005 0.059 0.022 0.020 0.047 0.037 24.27 34.33 41.40South Africa* WHS 2003 0.027 26 0.031 0.009 0.027 0.041 0.026 0.032 0.043 0.017 38.43 22.33 39.24Uzbekistan MICS 2006 0.028 27 0.000 0.026 0.074 0.018 0.002 0.005 0.030 0.021 0.049 0.031 16.02 56.06 27.92www.ophi.org.uk July 2010 109
<strong>Acute</strong> <strong>Multidimensional</strong> <strong>Poverty</strong>: A <strong>New</strong> <strong>Index</strong> <strong>for</strong> <strong>Developing</strong> CountriesAlkire & SantosTable 1.8, ContinuedCountry Survey YearMPIValueMPIRankProportion of people who are poor and deprived in…Education Health Living StandardChild School MortalitySchoolingAttendance (any age) NutritionDrinkingElectricity Sanitation Floor Cooking AssetsWater FuelPercent Contribution ofDeprivations in…Education Health LivingStandardThailand MICS 2005 0.029 28 0.078 0.009 0.020 0.016 0.003 0.016 0.016 0.005 0.100 0.014 49.86 20.88 29.25Estonia WHS 2003 0.029 29 0.072 0.003 0.013 0.000 0.008 0.003 0.000 0.035 0.004 81.84 8.68 9.48Mexico ENSANUT 2006 0.029 30 0.034 0.028 0.026 0.014 0.011 0.046 0.013 0.045 0.065 0.047 34.70 22.40 42.90Occupied Palestinian Territories MICS 2006 0.032 31 0.036 0.081 0.000 0.024 0.002 0.005 0.016 0.122 0.001 0.010 60.69 12.21 27.10Syrian Arab Republic † MICS 2006 0.037 32 0.021 0.076 0.046 0.036 0.003 0.032 0.060 0.021 0.002 0.009 43.76 37.05 19.18Kyrgyzstan MICS 2006 0.041 33 0.041 0.082 0.021 0.001 0.023 0.037 0.027 0.094 0.061 50.05 17.02 32.93Belize MICS 2006 0.042 34 0.016 0.042 0.056 0.026 0.070 0.053 0.037 0.039 0.089 0.051 22.81 32.59 44.61Egypt DHS 2008 0.043 35 0.044 0.069 0.064 0.025 0.003 0.027 0.013 0.064 0.036 43.79 34.14 22.07Azerbaijan DHS 2006 0.050 36 0.004 0.061 0.085 0.062 0.002 0.077 0.094 0.013 0.039 0.044 21.56 48.76 29.68Sri Lanka* WHS 2003 0.056 37 0.004 0.006 0.099 0.103 0.075 0.088 0.075 0.191 0.143 2.30 30.90 66.80Colombia DHS 2005 0.061 38 0.050 0.053 0.055 0.063 0.031 0.074 0.055 0.062 0.109 0.100 28.30 32.20 39.50Suriname MICS 2000 0.063 39 0.093 0.065 0.050 0.031 0.090 0.078 0.038 42.00 21.51 36.49Guyana DHS 2005 0.070 40 0.016 0.011 0.125 0.106 0.080 0.065 0.028 0.073 0.082 6.62 59.02 34.36China WHS 2003 0.071 41 0.109 0.002 0.073 0.001 0.121 0.047 0.052 0.151 0.037 50.80 17.45 31.75Dominican Republic MICS 2000 0.080 42 0.125 0.051 0.086 0.019 0.054 0.219 0.054 0.047 0.106 0.121 36.66 21.80 41.54Brazil WHS 2003 0.083 43 0.174 0.051 0.000 0.039 0.020 0.016 0.066 0.001 69.97 20.54 9.49Turkey § DHS 2003 0.087 44 0.045 0.119 0.152 0.020 0.275 0.077 0.049 0.028 0.030 31.65 33.08 35.27Iraq MICS 2006 0.093 45 0.067 0.195 0.104 0.055 0.017 0.121 0.135 0.060 0.038 0.040 47.03 28.42 24.55Paraguay WHS 2003 0.101 46 0.068 0.074 0.040 0.065 0.228 0.183 0.159 0.266 0.161 22.44 18.99 58.57Philippines DHS 2003 0.102 47 0.034 0.075 0.142 0.136 0.130 0.073 0.056 0.162 17.70 46.06 36.24Viet Nam DHS 2002 0.112 48 0.068 0.057 0.108 0.097 0.233 0.233 0.128 0.134 18.60 32.18 49.22Mongolia MICS 2005 0.116 49 0.024 0.049 0.152 0.029 0.130 0.274 0.229 0.152 0.359 0.176 10.42 26.11 63.48Indonesia DHS 2007 0.125 50 0.051 0.070 0.144 0.078 0.231 0.183 0.083 0.267 0.183 16.04 38.49 45.47Tajikistan MICS 2005 0.125 51 0.002 0.125 0.233 0.102 0.004 0.057 0.203 0.242 0.212 0.153 16.87 44.54 38.58Peru DHS 2004 0.129 52 0.051 0.035 0.108 0.018 0.253 0.345 0.215 0.294 0.334 0.239 11.15 16.28 72.57Guatemala* WHS 2003 0.151 53 0.218 0.077 0.038 0.143 0.101 0.054 0.225 0.320 0.216 48.24 12.73 39.03Myanmar* MICS 2000 0.154 54 0.155 0.163 0.119 0.191 0.252 0.054 0.237 34.48 25.73 39.79www.ophi.org.uk July 2010 110
<strong>Acute</strong> <strong>Multidimensional</strong> <strong>Poverty</strong>: A <strong>New</strong> <strong>Index</strong> <strong>for</strong> <strong>Developing</strong> CountriesAlkire & SantosTable 1.8, ContinuedCountry Survey YearMPIValueMPIRankSchoolingProportion of people who are poor and deprived in…Education Health Living StandardChild SchoolAttendanceMortality(any age) NutritionDrinkingElectricity Sanitation Floor CookingWater FuelAssetsPercent Contribution ofDeprivations in…Education Health LivingStandardMorocco DHS 2004 0.167 55 0.215 0.165 0.155 0.112 0.202 0.201 0.207 0.170 0.093 0.193 37.98 26.57 35.46Djibouti MICS 2006 0.177 56 0.158 0.239 0.122 0.128 0.259 0.256 0.083 0.230 0.107 0.317 37.32 23.45 39.23Ghana DHS 2008 0.193 57 0.168 0.121 0.132 0.077 0.368 0.488 0.185 0.154 0.507 0.273 25.03 18.07 56.91Honduras DHS 2006 0.207 58 0.158 0.325 0.127 0.086 0.316 0.139 0.231 0.439 0.235 38.95 17.17 43.88Gabon † § DHS 2000 0.216 59 0.113 0.100 0.267 0.142 0.274 0.537 0.246 0.239 0.360 0.360 16.47 31.60 51.93Bolivia DHS 2003 0.227 60 0.100 0.304 0.267 0.059 0.275 0.565 0.191 0.304 0.342 0.225 29.62 23.87 46.51Zimbabwe DHS 2006 0.235 61 0.034 0.120 0.164 0.143 0.575 0.484 0.329 0.343 0.596 0.523 10.97 21.75 67.28Swaziland DHS 2007 0.244 62 0.072 0.195 0.272 0.080 0.567 0.581 0.364 0.122 0.580 0.311 18.28 24.14 57.58Namibia DHS 2007 0.246 63 0.087 0.091 0.159 0.227 0.556 0.573 0.204 0.485 0.581 0.340 12.05 26.11 61.84Nicaragua DHS 2001 0.250 64 0.229 0.237 0.178 0.083 0.294 0.484 0.297 0.381 0.514 0.357 31.01 17.34 51.65Lesotho DHS 2004 0.289 65 0.136 0.191 0.177 0.062 0.749 0.680 0.342 0.418 0.645 0.677 18.84 13.76 67.40Sao Tome and Principe † MICS 2000 0.295 66 0.315 0.134 0.277 0.080 0.518 0.718 0.299 0.003 0.720 0.628 25.38 20.20 54.41Lao MICS 2006 0.302 67 0.258 0.322 0.223 0.414 0.483 0.351 0.099 0.612 0.396 32.01 24.65 43.34Pakistan* DHS 2007 0.304 68 0.203 0.417 0.300 0.099 0.386 0.095 0.421 0.513 0.303 33.95 32.89 33.17Cambodia DHS 2005 0.312 69 0.241 0.270 0.253 0.158 0.666 0.662 0.422 0.072 0.730 0.294 27.34 21.97 50.69Yemen MICS 2006 0.315 70 0.131 0.420 0.344 0.369 0.302 0.398 0.237 0.327 0.322 29.16 36.39 34.45Republic of Congo DHS 2005 0.327 71 0.062 0.168 0.339 0.236 0.603 0.745 0.414 0.412 0.730 0.561 11.77 29.32 58.91India DHS 2005 0.337 72 0.182 0.269 0.247 0.448 0.322 0.605 0.142 0.459 0.644 0.446 22.33 34.43 43.24Togo MICS 2006 0.338 73 0.242 0.269 0.285 0.186 0.644 0.715 0.435 0.204 0.756 0.386 25.18 23.24 51.57Cameroon DHS 2004 0.344 74 0.233 0.276 0.391 0.095 0.532 0.628 0.382 0.498 0.699 0.476 24.63 23.54 51.83Bangladesh DHS 2007 0.345 75 0.241 0.096 0.260 0.399 0.499 0.627 0.029 0.711 0.767 0.584 16.29 31.88 51.83Haiti DHS 2006 0.352 76 0.325 0.201 0.301 0.130 0.622 0.674 0.434 0.385 0.747 0.595 24.91 20.45 54.63Kenya DHS 2003 0.361 77 0.125 0.143 0.269 0.227 0.803 0.801 0.604 0.657 0.804 0.536 12.37 22.90 64.73Gambia MICS 2006 0.368 78 0.301 0.401 0.436 0.232 0.642 0.391 0.236 0.245 0.777 0.219 31.81 30.28 37.90Zambia DHS 2007 0.370 79 0.134 0.210 0.390 0.192 0.754 0.706 0.591 0.607 0.780 0.447 15.48 26.23 58.28Cote d'Ivoire DHS 2005 0.373 80 0.313 0.419 0.409 0.368 0.588 0.275 0.176 0.316 32.71 36.54 30.75Nepal DHS 2006 0.389 81 0.302 0.158 0.321 0.433 0.496 0.671 0.162 0.705 0.768 0.558 19.74 32.28 47.98www.ophi.org.uk July 2010 111
<strong>Acute</strong> <strong>Multidimensional</strong> <strong>Poverty</strong>: A <strong>New</strong> <strong>Index</strong> <strong>for</strong> <strong>Developing</strong> CountriesAlkire & SantosTable 1.8, ContinuedCountry Survey YearMPI MPIValue RankSchoolingProportion of people who are poor and deprived in…Education Health Living StandardChild SchoolAttendancePercent Contribution ofDeprivations in…MortalityDrinkingNutrition Electricity Sanitation Floor Cooking Assets Education Health Living(any age) Water FuelStandardMauritania* MICS 2007 0.389 82 0.376 0.336 0.311 0.201 0.597 0.630 0.545 0.494 0.600 0.471 30.47 21.93 47.60Nigeria DHS 2003 0.407 83 0.258 0.313 0.455 0.332 0.475 0.766 0.583 0.347 0.706 0.368 23.41 32.25 44.34Senegal DHS 2005 0.412 84 0.397 0.540 0.467 0.134 0.524 0.596 0.340 0.347 0.586 0.414 37.85 24.32 37.82Chad WHS 2003 0.417 85 0.423 0.027 0.074 0.889 0.828 0.509 0.850 0.890 0.700 33.78 4.05 62.17Tanzania DHS 2008 0.426 86 0.135 0.247 0.356 0.848 0.867 0.574 0.728 0.880 0.497 14.93 27.82 57.26DR Congo DHS 2007 0.434 87 0.144 0.415 0.399 0.177 0.803 0.742 0.619 0.737 0.877 0.633 21.45 22.12 56.43Malawi DHS 2004 0.435 88 0.291 0.253 0.344 0.194 0.893 0.909 0.504 0.782 0.918 0.580 20.84 20.60 58.56Benin DHS 2006 0.446 89 0.433 0.429 0.406 0.253 0.712 0.806 0.365 0.426 0.840 0.314 32.22 24.64 43.14Comoros † MICS 2000 0.449 90 0.315 0.493 0.276 0.281 0.638 0.878 0.540 0.315 0.855 0.755 30.02 20.69 49.29Madagascar DHS 2004 0.451 91 0.430 0.331 0.280 0.357 0.783 0.719 0.669 0.170 0.852 0.724 28.12 23.56 48.31Rwanda DHS 2005 0.479 92 0.375 0.295 0.409 0.118 0.928 0.730 0.713 0.855 0.953 0.844 23.36 18.35 58.30Angola MICS 2001 0.479 93 0.437 0.311 0.478 0.240 0.726 0.748 0.560 0.656 0.773 0.764 26.03 24.96 49.01Mozambique DHS 2003 0.505 94 0.559 0.414 0.418 0.232 0.845 0.554 0.600 0.733 0.892 0.596 32.12 21.45 46.42Liberia DHS 2007 0.508 95 0.304 0.572 0.503 0.240 0.911 0.854 0.353 0.538 0.934 0.701 28.71 24.36 46.93Sierra Leone MICS 2005 0.517 96 0.465 0.339 0.513 0.224 0.865 0.867 0.548 0.652 0.925 0.825 25.92 23.76 50.31Guinea DHS 2005 0.529 97 0.549 0.549 0.557 0.174 0.777 0.821 0.389 0.539 0.917 0.589 34.59 23.05 42.36Central African Republic MICS 2000 0.533 98 0.359 0.639 0.481 0.247 0.878 0.567 0.571 0.936 0.731 31.18 22.76 46.05Somalia MICS 2006 0.538 99 0.624 0.450 0.299 0.305 0.802 0.733 0.738 0.661 0.905 0.806 33.29 18.73 47.98Burkina Faso MICS 2006 0.557 100 0.557 0.668 0.523 0.362 0.810 0.734 0.451 0.565 0.908 0.234 36.63 26.48 36.89Burundi MICS 2005 0.562 101 0.530 0.476 0.356 0.953 0.713 0.557 0.912 0.965 0.855 29.86 21.11 49.02Mali DHS 2006 0.583 102 0.616 0.588 0.532 0.372 0.817 0.851 0.449 0.738 0.943 0.365 34.45 25.86 39.69Ethiopia DHS 2005 0.595 103 0.617 0.657 0.381 0.212 0.879 0.922 0.547 0.908 0.941 0.924 35.64 16.59 47.78Niger DHS 2006 0.653 104 0.667 0.702 0.589 0.251 0.894 0.925 0.650 0.871 0.966 0.819 34.94 21.44 43.61* The poverty estimates <strong>for</strong> these countries should be interpreted as lower bound estimates, meaning that multidimensional poverty is at least as great as their MPI values indicates.†The poverty estimates <strong>for</strong> these countries should be interpreted as upper bound estimates, meaning that multidimensional poverty is less than or equal to their MPI values.‡ Estimates are not country representative.§In these countries we have in<strong>for</strong>mation on Body Mass <strong>Index</strong> only <strong>for</strong> the mothers of under five year old children.** Although there was in<strong>for</strong>mation on mortality <strong>for</strong> this country, the indicator had to be excluded from the estimates due to a very high percentage of missing values.www.ophi.org.uk July 2010 112
<strong>Acute</strong> <strong>Multidimensional</strong> <strong>Poverty</strong>: A <strong>New</strong> <strong>Index</strong> <strong>for</strong> <strong>Developing</strong> CountriesAlkire & Santos1.9 Raw Headcounts by DimensionThe table presents the raw proportion of people who are deprived in one or more educational indicators, the proportion whoare deprived in one or more the health indicators and the proportion deprived in three or more living standard indicators.Please note that among these people not everyone is MPI poor (as they may be deprived in less than 30% of the weightedindicators). This is only complementary in<strong>for</strong>mation.Country Survey YearMPIValueMPIRankRaw Proportion of Population Deprived in…LivingEducation HealthStandardSlovakia † WHS 2003 0.000 1 0.0 3.8 0.0Slovenia † WHS 2003 0.000 1 0.0 3.1 0.0Czech Republic WHS 2003 0.000 3 0.0 3.1 0.0Belarus MICS 2005 0.000 4 2.0 3.1 0.1Latvia* WHS 2003 0.001 5 0.1 1.6 1.1United Arab Emirates WHS 2003 0.002 6 0.6 5.4 0.0Kazakhstan MICS 2006 0.002 7 1.3 9.8 1.1Occupied Palestinian Territories MICS 2006 0.003 8 14.6 2.8 0.8Georgia MICS 2005 0.003 9 2.4 5.9 4.6Hungary WHS 2003 0.003 10 0.1 4.5 0.0Bosnia and Herzegovina MICS 2006 0.003 11 11.1 0.4 0.8Serbia** MICS 2005 0.003 12 5.2 0.4 0.8Albania MICS 2005 0.004 13 6.6 7.2 0.9Russian Federation* WHS 2003 0.005 14 1.6 3.5 0.4Uruguay WHS 2003 0.006 15 1.7 5.1 0.0Thailand MICS 2005 0.006 16 12.6 5.6 1.5Montenegro MICS 2005 0.006 17 4.2 0.8 0.7Croatia WHS 2003 0.007 18 2.3 2.4 0.4Ukraine DHS 2007 0.008 19 6.2 2.1 0.2Macedonia MICS 2005 0.008 20 5.9 7.2 0.9Armenia DHS 2005 0.008 21 9.5 14.6 0.8Moldova DHS 2005 0.008 22 5.1 10.1 5.3Uzbekistan MICS 2006 0.008 23 4.4 17.4 2.3Ecuador WHS 2003 0.009 24 2.3 4.6 3.9Jordan DHS 2007 0.010 25 10.6 11.9 0.2Tunisia* WHS 2003 0.010 26 1.1 13.1 6.9Argentina ‡ ENNyS 2005 0.011 27 15.4 3.8 4.7South Africa* WHS 2003 0.014 28 3.2 8.1 10.8Mexico ENSANUT 2006 0.015 29 10.1 9.2 6.7Kyrgyzstan MICS 2006 0.019 30 18.7 2.1 8.3Trinidad and Tobago MICS 2006 0.020 31 1.5 5.6 0.8Sri Lanka* WHS 2003 0.021 32 0.5 9.8 26.4Azerbaijan DHS 2006 0.021 33 10.2 20.3 4.2Syrian Arab Republic † MICS 2006 0.021 34 20.4 13.6 1.3www.ophi.org.uk July 2010 113
<strong>Acute</strong> <strong>Multidimensional</strong> <strong>Poverty</strong>: A <strong>New</strong> <strong>Index</strong> <strong>for</strong> <strong>Developing</strong> CountriesAlkire & SantosTable 1.9, ContinuedCountry Survey YearRaw Proportion of Population Deprived in…MPI MPILivingValue Rank Education HealthStandardBelize MICS 2006 0.024 35 8.5 13.3 7.0Egypt DHS 2008 0.026 36 18.0 16.9 0.9Estonia WHS 2003 0.026 37 7.3 5.1 0.1Turkey § DHS 2003 0.039 38 15.4 16.0 7.3Brazil WHS 2003 0.039 39 20.2 5.2 2.8Colombia DHS 2005 0.041 40 13.2 17.5 9.7Suriname MICS 2000 0.044 41 18.8 15.9 2.3Dominican Republic MICS 2000 0.048 42 17.5 13.1 13.2Guyana DHS 2005 0.055 43 4.7 12.4 10.8China WHS 2003 0.056 44 10.9 11.3 12.4Iraq MICS 2006 0.059 45 32.0 20.0 5.2Paraguay WHS 2003 0.064 46 7.5 13.1 32.4Mongolia MICS 2005 0.065 47 6.8 19.0 39.6Philippines DHS 2003 0.067 48 13.6 14.2 18.2Tajikistan MICS 2005 0.068 49 14.3 35.6 21.9Viet Nam DHS 2002 0.075 50 12.3 10.8 30.1Peru DHS 2004 0.085 51 8.5 14.6 38.2Myanmar* MICS 2000 0.088 52 32.7 11.7 22.8Indonesia DHS 2007 0.095 53 12.6 14.4 31.2Guatemala* WHS 2003 0.127 54 26.8 15.0 40.5Djibouti MICS 2006 0.139 55 39.3 25.6 28.1Morocco DHS 2004 0.139 56 36.3 31.5 21.4Ghana DHS 2008 0.140 57 24.1 17.9 57.5Honduras DHS 2006 0.160 58 46.6 21.1 30.8Gabon † § DHS 2000 0.161 59 19.2 35.4 34.8Zimbabwe DHS 2006 0.174 60 15.1 29.6 64.5Bolivia DHS 2003 0.175 61 37.8 31.4 38.0Swaziland DHS 2007 0.183 62 25.9 33.5 66.3Namibia DHS 2007 0.187 63 16.0 37.2 60.8Nicaragua DHS 2001 0.211 64 36.4 25.9 54.1Lesotho DHS 2004 0.220 65 29.7 22.1 82.4Sao Tome and Principe † MICS 2000 0.236 66 36.7 26.6 74.3Cambodia DHS 2005 0.263 67 40.9 36.0 78.4Lao MICS 2006 0.267 68 43.9 22.3 59.7Republic of Congo DHS 2005 0.270 69 21.7 47.6 73.8www.ophi.org.uk July 2010 114
<strong>Acute</strong> <strong>Multidimensional</strong> <strong>Poverty</strong>: A <strong>New</strong> <strong>Index</strong> <strong>for</strong> <strong>Developing</strong> CountriesAlkire & SantosTable 1.9, ContinuedCountry Survey YearMPIValueMPIRankRaw Proportion of Population Deprived in…LivingEducation HealthStandardPakistan* DHS 2007 0.275 70 51.2 29.2 42.9Yemen MICS 2006 0.283 71 54.5 34.4 38.2Togo MICS 2006 0.284 72 39.9 38.0 75.5Bangladesh DHS 2007 0.291 73 31.4 53.1 76.3India DHS 2005 0.296 74 37.5 56.5 58.5Cameroon DHS 2004 0.299 75 37.4 42.6 67.9Kenya DHS 2003 0.302 76 21.9 41.4 86.2Haiti DHS 2006 0.306 77 41.0 37.3 76.0Cote d'Ivoire DHS 2005 0.320 78 62.7 40.6 37.7Gambia MICS 2006 0.324 79 53.4 52.1 60.1Zambia DHS 2007 0.325 80 30.1 51.3 78.3Chad WHS 2003 0.344 81 39.4 8.2 95.2Nepal DHS 2006 0.350 82 38.0 58.3 77.2Mauritania* MICS 2007 0.352 83 55.3 44.1 66.8Tanzania DHS 2008 0.367 84 34.0 35.5 90.6Nigeria DHS 2003 0.368 85 42.4 59.5 72.1Senegal DHS 2005 0.384 86 66.9 54.3 54.9Malawi DHS 2004 0.384 87 43.6 45.2 93.9DR Congo DHS 2007 0.393 88 48.4 48.2 85.5Comoros † MICS 2000 0.408 89 60.1 45.7 90.3Benin DHS 2006 0.412 90 62.8 51.7 79.1Madagascar DHS 2004 0.413 91 55.4 49.6 83.7Rwanda DHS 2005 0.443 92 53.6 46.1 95.3Angola MICS 2001 0.452 93 56.9 60.8 82.0Mozambique DHS 2003 0.481 94 69.1 52.7 86.4Liberia DHS 2007 0.484 95 68.9 59.6 91.6Sierra Leone MICS 2005 0.489 96 60.6 58.2 92.4Guinea DHS 2005 0.505 97 74.8 60.8 84.4Central African Republic MICS 2000 0.512 98 72.7 56.2 92.3Somalia MICS 2006 0.514 99 74.5 47.6 86.7Burundi MICS 2005 0.530 100 71.6 35.5 97.3Burkina Faso MICS 2006 0.536 101 80.4 62.9 81.6Mali DHS 2006 0.564 102 81.1 65.8 86.8Ethiopia DHS 2005 0.582 103 83.93 48.22 94.15Niger DHS 2006 0.642 104 87.09 64.91 93.03* The poverty estimates <strong>for</strong> these countries should be interpreted as lower bound estimates, meaning that multidimensional poverty is atleast as great as their MPI values indicates.†The poverty estimates <strong>for</strong> these countries should be interpreted as upper bound estimates, meaning that multidimensional poverty isless than or equal to their MPI values.‡ Estimates are not country representative.§In these countries we have in<strong>for</strong>mation on Body Mass <strong>Index</strong> only <strong>for</strong> the mothers of under five year old children.** Although there was in<strong>for</strong>mation on mortality <strong>for</strong> this country, the indicator had to be excluded from the estimates due to a very highpercentage of missing values.www.ophi.org.uk July 2010 115
<strong>Acute</strong> <strong>Multidimensional</strong> <strong>Poverty</strong>: A <strong>New</strong> <strong>Index</strong> <strong>for</strong> <strong>Developing</strong> CountriesAlkire & SantosAppendix 2: Sample Sizes and Non Response RateTable 2.1 Sample sizesThe table reports the sample sizes from each survey that were used to compute MPI and gives the rural-urban breakdownReductions in sample sizes were due to missing data, which is detailed by indicator in Table 2.2Country Survey YearTotalSampleSizeUrbanSampleSizeRuralSampleSizePercent ofTotal SampleUsed tocompute MPI(Unweighted)Percent ofTotal SampleUsed tocompute MPI(Weighted)Percent ofUrban SampleUsed tocompute MPI(Unweighted)Percent ofUrban SampleUsed tocompute MPI(Weighted)Percent ofRural SampleUsed tocompute MPI(Unweighted)Percent ofRural SampleUsed tocompute MPI(Weighted)United Arab Emirates WHS 2003 6411 4465 1946 56.89% 50.73% 49.59% 48.05% 73.64% 63.44%South Africa WHS 2003 10633 5944 4689 57.39% 57.93% 57.17% 59.65% 57.67% 56.21%Ecuador WHS 2003 22667 14840 7827 59.03% 74.08% 59.15% 74.52% 58.81% 73.40%Jordan DHS 2007 80539 54077 26462 60.97% 59.51% 60.14% 58.81% 62.66% 62.93%Sao Tome and Principe MICS 2000 14251 7262 6989 63.75% 64.02% 59.29% 59.35% 68.38% 68.33%Guatemala WHS 2003 25820 9647 16173 63.92% 63.92% 76.59% 76.59% 56.37% 56.37%Chad WHS 2003 24524 5944 18580 63.98% 67.24% 65.17% 70.27% 63.60% 66.13%Sri Lanka WHS 2003 28847 4401 24446 66.98% 76.18% 72.23% 81.28% 66.03% 74.86%Gabon DHS 2000 30736 18678 12058 73.39% 69.61% 69.26% 66.20% 79.78% 79.30%Comoros MICS 2000 27060 8403 18657 74.62% 74.11% 76.89% 77.18% 73.60% 73.27%Slovenia WHS 2003 2166 2166 0 76.82% 76.82% 76.82% 76.82% 0.00% 0.00%Tunisia WHS 2003 25290 14895 10395 78.66% 80.90% 82.67% 85.37% 72.92% 74.24%Myanmar MICS 2000 132534 30000 102534 79.07% 80.45% 81.92% 83.53% 78.24% 79.46%Latvia WHS 2003 2283 1526 757 79.59% 88.81% 82.04% 90.07% 74.64% 86.61%Russian Federation WHS 2003 11079 10269 810 81.77% 83.60% 81.97% 83.73% 79.26% 82.65%Syrian Arab Republic MICS 2006 107369 56902 50467 81.83% 81.83% 82.70% 82.70% 80.84% 80.84%Slovakia WHS 2003 6838 6131 707 84.13% 87.84% 83.54% 87.66% 89.25% 88.05%Colombia DHS 2005 153749 112455 41294 84.48% 82.37% 84.91% 82.21% 83.32% 82.81%Mauritania MICS 2007 58646 24828 33818 85.71% 84.63% 87.70% 86.85% 84.25% 82.79%Paraguay WHS 2003 24771 10950 13821 87.51% 91.32% 89.81% 93.40% 85.68% 88.85%Brazil WHS 2003 18085 14720 3365 87.80% 88.85% 89.42% 90.23% 80.71% 82.54%Djibouti MICS 2006 28014 24809 3205 88.12% 89.79% 88.89% 90.07% 82.18% 83.01%Iraq MICS 2006 116106 75482 40624 88.76% 88.40% 88.47% 87.64% 89.31% 89.72%Angola MICS 2001 29817 19571 10246 90.28% 90.01% 88.38% 88.30% 93.91% 93.97%Kyrgyzstan MICS 2006 24731 12888 11843 90.70% 90.38% 86.29% 81.77% 95.51% 95.56%Somalia MICS 2006 33557 13265 20292 90.82% 90.81% 91.04% 91.43% 90.67% 90.43%Sierra Leone MICS 2005 42693 12076 30617 91.46% 91.47% 95.41% 95.42% 89.91% 89.91%Central African Republic MICS 2000 92466 36388 56078 91.61% 91.41% 92.21% 91.87% 91.22% 91.10%Suriname MICS 2000 17071 9034 8037 92.14% 91.95% 92.21% 92.21% 92.07% 91.67%Belize MICS 2006 7673 3681 3992 92.66% 92.58% 92.04% 92.04% 93.24% 93.09%www.ophi.org.uk July 2010 116
<strong>Acute</strong> <strong>Multidimensional</strong> <strong>Poverty</strong>: A <strong>New</strong> <strong>Index</strong> <strong>for</strong> <strong>Developing</strong> CountriesAlkire & SantosTable 2.1, ContinuedCountry Survey YearTotalSampleSizeUrbanSampleSizeRuralSampleSizePercent ofTotal SampleUsed tocompute MPI(Unweighted)Percent ofTotal SampleUsed tocompute MPI(Weighted)Percent ofUrban SampleUsed tocompute MPI(Unweighted)Percent ofUrban SampleUsed tocompute MPI(Weighted)Percent ofRural SampleUsed tocompute MPI(Unweighted)Percent ofRural SampleUsed tocompute MPI(Weighted)Burkina Faso MICS 2006 38504 5691 32813 93.64% 93.78% 95.31% 95.65% 93.35% 93.17%Georgia MICS 2005 44265 21460 22805 93.68% 93.83% 94.69% 95.21% 92.73% 92.55%Montenegro MICS 2005 9602 5908 3694 93.89% 95.89% 94.13% 95.95% 93.50% 95.80%Bangladesh DHS 2007 50215 18641 31574 94.09% 94.29% 93.83% 93.45% 94.24% 94.53%Senegal DHS 2005 67485 26162 41323 94.38% 94.54% 94.42% 94.66% 94.35% 94.46%Morocco DHS 2004 62891 31699 31192 94.58% 94.40% 92.35% 92.59% 96.86% 96.81%Mozambique DHS 2003 62262 26028 36234 95.14% 95.45% 94.02% 94.54% 95.95% 95.91%Dominican Republic MICS 2000 17759 9554 8205 95.15% 94.98% 94.69% 94.44% 95.69% 95.74%Guyana DHS 2005 10898 5287 5611 95.25% 95.42% 94.38% 94.30% 96.06% 95.89%Nicaragua DHS 2001 60889 30381 30508 95.63% 95.74% 95.83% 96.07% 95.43% 95.31%Zimbabwe DHS 2006 41749 12489 29260 95.68% 95.67% 93.38% 93.78% 96.67% 96.55%Mongolia MICS 2005 26718 15141 11577 95.76% 95.75% 95.12% 95.11% 96.60% 96.60%India DHS 2005 516251 229391 286860 95.88% 96.21% 94.63% 94.65% 96.87% 96.91%Honduras DHS 2006 92183 33312 58871 95.91% 95.34% 94.34% 93.79% 96.80% 96.71%Czech Republic WHS 2003 2712 1851 861 95.94% 97.76% 96.06% 97.78% 95.70% 97.72%Nigeria DHS 2003 35269 13931 21338 96.04% 95.85% 97.02% 96.31% 95.40% 95.62%Togo MICS 2006 32326 10220 22106 96.12% 95.86% 94.58% 94.49% 96.83% 96.70%Moldova DHS 2005 31297 17153 14144 96.35% 96.61% 95.52% 95.40% 97.36% 97.39%Cote d'Ivoire DHS 2005 23747 9832 13915 96.37% 95.65% 96.25% 95.59% 96.46% 95.70%Serbia MICS 2005 33273 18956 14317 96.40% 98.19% 96.27% 98.18% 96.58% 98.20%Ukraine DHS 2007 33598 19962 13636 96.48% 96.23% 96.20% 95.85% 96.88% 97.05%Liberia DHS 2007 34344 13924 20420 96.52% 96.58% 96.55% 97.03% 96.50% 96.31%Pakistan DHS 2007 109148 38210 70938 96.64% 96.67% 96.05% 95.32% 96.96% 97.36%Lesotho DHS 2004 34091 7105 26986 96.70% 96.46% 97.09% 96.43% 96.59% 96.46%Bolivia DHS 2003 80546 48193 32353 96.93% 96.66% 96.45% 96.11% 97.64% 97.55%Benin DHS 2006 89371 34743 54628 96.95% 96.93% 96.99% 97.01% 96.93% 96.88%Indonesia DHS 2007 175142 69810 105332 97.05% 97.84% 97.24% 97.71% 96.93% 97.93%Madagascar DHS 2004 37446 22469 14977 97.13% 96.91% 97.37% 97.42% 96.78% 96.78%Armenia DHS 2005 24888 17020 7868 97.18% 97.32% 97.10% 97.14% 97.37% 97.63%www.ophi.org.uk July 2010 117
<strong>Acute</strong> <strong>Multidimensional</strong> <strong>Poverty</strong>: A <strong>New</strong> <strong>Index</strong> <strong>for</strong> <strong>Developing</strong> CountriesAlkire & SantosTable 2.1, ContinuedCountry Survey YearTotalSampleSizeUrbanSampleSizeRuralSampleSizePercent ofTotal SampleUsed tocompute MPI(Unweighted)Percent ofTotal SampleUsed tocompute MPI(Weighted)Percent ofUrban SampleUsed tocompute MPI(Unweighted)Percent ofUrban SampleUsed tocompute MPI(Weighted)Percent ofRural SampleUsed tocompute MPI(Unweighted)Percent ofRural SampleUsed tocompute MPI(Weighted)Estonia WHS 2003 2750 1747 1003 97.20% 97.89% 96.74% 97.22% 98.01% 99.28%Turkey DHS 2003 46233 32164 14069 97.26% 97.04% 97.09% 96.74% 97.63% 97.64%Macedonia MICS 2005 26423 14707 11716 97.31% 98.79% 97.04% 98.37% 97.64% 99.34%Argentina ENNyS 2005 196320 196320 0 97.33% 97.33% 97.33% 97.33% 0.00% 0.00%Mali DHS 2006 73045 23429 49616 97.35% 97.46% 97.62% 97.92% 97.23% 97.26%Namibia DHS 2007 40794 15657 25137 97.41% 97.14% 96.21% 95.87% 98.15% 98.03%Trinidad and Tobago MICS 2006 18680 3040 15640 97.45% 97.39% 98.09% 98.06% 97.32% 97.26%Ethiopia DHS 2005 66388 15262 51126 97.52% 98.30% 97.92% 98.22% 97.40% 98.31%Malawi DHS 2004 59714 7403 52311 97.54% 97.37% 97.57% 97.34% 97.54% 97.38%Republic of Congo DHS 2005 29868 19716 10152 97.62% 97.46% 97.99% 97.89% 96.91% 96.99%Cameroon DHS 2004 49478 21891 27587 97.63% 97.71% 97.36% 97.29% 97.84% 98.12%Tajikistan MICS 2005 40340 13785 26555 97.65% 98.00% 97.27% 97.33% 97.85% 98.25%Niger DHS 2006 47420 15415 32005 97.70% 98.00% 97.07% 96.95% 98.00% 98.22%Kenya DHS 2003 36687 10404 26283 97.78% 97.94% 97.34% 97.48% 97.96% 98.05%Lao MICS 2006 33551 7395 26156 97.90% 97.64% 96.74% 96.29% 98.23% 98.10%Guinea DHS 2005 37589 10785 26804 98.01% 98.10% 97.35% 97.38% 98.28% 98.40%Swaziland DHS 2007 21523 5529 15994 98.11% 98.11% 97.67% 97.49% 98.27% 98.28%Gambia MICS 2006 45720 17303 28417 98.19% 98.15% 98.20% 98.12% 98.19% 98.16%Peru DHS 2004 54843 30055 24788 98.21% 98.00% 98.11% 97.63% 98.35% 98.64%Azerbaijan DHS 2006 30114 15547 14567 98.40% 98.50% 98.24% 98.32% 98.58% 98.71%Burundi MICS 2005 41301 6338 34963 98.41% 98.36% 98.99% 98.87% 98.30% 98.33%Croatia WHS 2003 2948 1896 1052 98.44% 98.26% 98.00% 97.78% 99.24% 99.15%DR Congo DHS 2005 47602 21529 26073 98.45% 98.65% 98.30% 98.22% 98.58% 98.96%Uzbekistan MICS 2006 52018 21390 30628 98.45% 98.26% 98.56% 98.25% 98.38% 98.27%Hungary WHS 2003 4298 2551 1747 98.60% 98.52% 98.71% 98.52% 98.45% 98.53%Uruguay WHS 2003 8389 6882 1507 98.81% 98.86% 98.76% 98.82% 99.00% 99.25%Thailand MICS 2005 137006 74985 62021 98.83% 98.72% 98.74% 98.30% 98.94% 98.90%Tanzania DHS 2008 43493 8464 35029 98.96% 98.89% 99.11% 99.05% 98.92% 98.84%Occupied Palestinian Territories MICS 2006 29126 22359 6767 98.99% 98.99% 98.93% 98.93% 99.19% 99.19%Rwanda DHS 2005 47163 10056 37107 99.06% 99.07% 98.38% 98.19% 99.24% 99.23%www.ophi.org.uk July 2010 118
<strong>Acute</strong> <strong>Multidimensional</strong> <strong>Poverty</strong>: A <strong>New</strong> <strong>Index</strong> <strong>for</strong> <strong>Developing</strong> CountriesAlkire & SantosTable 2.1, ContinuedCountry Survey YearTotalSampleSizeUrbanSampleSizeRuralSampleSizePercent ofTotal SampleUsed tocompute MPI(Unweighted)Percent ofTotal SampleUsed tocompute MPI(Weighted)Percent ofUrban SampleUsed tocompute MPI(Unweighted)Percent ofUrban SampleUsed tocompute MPI(Weighted)Percent ofRural SampleUsed tocompute MPI(Unweighted)Percent ofRural SampleUsed tocompute MPI(Weighted)Philippines DHS 2003 60866 29474 31392 99.11% 99.12% 99.20% 99.15% 99.04% 99.08%Zambia DHS 2007 34909 13427 21482 99.16% 99.16% 99.19% 99.22% 99.14% 99.13%Cambodia DHS 2005 72342 16218 56124 99.18% 99.24% 99.03% 99.22% 99.23% 99.25%Yemen MICS 2006 26082 7406 18676 99.19% 99.23% 99.38% 99.47% 99.11% 99.12%Nepal DHS 2006 42271 11084 31187 99.21% 99.09% 98.85% 98.08% 99.34% 99.27%Bosnia and Herzegovina MICS 2006 21063 6889 14174 99.28% 99.70% 99.23% 99.66% 99.31% 99.72%Haiti DHS 2006 46678 18529 28149 99.30% 99.28% 99.38% 99.24% 99.25% 99.30%Kazakhstan MICS 2006 54121 26645 27476 99.43% 99.39% 99.53% 99.53% 99.32% 99.20%Ghana DHS 2008 46061 18073 27988 99.43% 99.39% 99.35% 99.30% 99.48% 99.46%Viet Nam DHS 2002 31279 7218 24061 99.46% 99.53% 99.29% 99.35% 99.51% 99.57%China WHS 2003 13986 4843 9143 99.61% 99.59% 98.86% 98.41% 100.00% 100.00%Belarus MICS 2005 20475 13242 7233 99.61% 99.80% 99.56% 99.75% 99.71% 99.90%Albania MICS 2005 20233 9629 10604 99.70% 99.61% 99.93% 99.91% 99.50% 99.40%Egypt DHS 2008 90118 29233 60885 99.83% 99.85% 99.80% 99.85% 99.85% 99.85%Mexico ENSANUT 2006 206700 151196 55504 99.86% 99.86% 99.86% 99.86% 99.85% 99.85%Minimum % of total sample size 56.89%Maximum 99.86%www.ophi.org.uk July 2010 119
<strong>Acute</strong> <strong>Multidimensional</strong> <strong>Poverty</strong>: A <strong>New</strong> <strong>Index</strong> <strong>for</strong> <strong>Developing</strong> CountriesAlkire & SantosTable 2.2 Missing and non-response percentagesPercent ofPercent of non response rate by indicator (Unweighted)Total SampleHealthEducationLiving StandardUsed toNutritionCountry Survey YearcomputeChildWomen/Child NutritionMPI Schooling School Mortality Adult'sElectricity Cooking Floor Sanitation Drinking Assets(Weight-<strong>for</strong>-age)fuelWater(Unweighted)AttendanceBMIUnited Arab Emirates WHS 2003 56.89% 0.08% NA 0.00% 15.49% NA 0.00% 0.80% 0.70% 0.50% 31.96% 0.53%South Africa WHS 2003 57.39% 0.38% NA 0.00% 38.43% NA NA 12.07% 12.90% 10.95% 12.41% 0.36%Ecuador WHS 2003 59.03% 0.07% NA 0.04% 30.94% NA 22.33% 27.60% 28.91% 27.26% 28.56% 20.49%Jordan DHS 2007 60.97% 0.00% 0.01% 0.96% 38.62% 77.38% 0.00% 0.00% 0.00% 0.00% 0.00% 0.00%Sao Tome and Principe MICS 2000 63.75% 2.27% 4.20% 23.11% NA 13.36% 0.00% 0.08% 0.04% 0.36% 0.00% 0.00%Guatemala WHS 2003 63.92% 0.00% NA 0.12% 33.64% NA 1.45% 1.03% 1.05% 1.17% 1.24% 0.25%Chad WHS 2003 63.98% 0.04% NA 0.13% 24.60% NA 1.25% 6.65% 21.41% 6.68% 7.28% 0.27%Sri Lanka WHS 2003 66.98% 0.08% NA 0.00% 30.82% NA 2.41% 1.34% 1.53% 1.40% 0.00% 0.26%Gabon DHS 2000 73.39% 0.17% 0.03% 1.56% 26.43% 47.02% 0.11% 0.01% 0.13% 0.29% 0.10% 0.05%Comoros MICS 2000 74.62% 4.87% 4.36% 0.50% NA 9.85% 0.00% 8.71% 1.90% 0.09% 0.00% 0.00%Slovenia WHS 2003 76.82% 0.28% NA 0.00% 18.37% NA 0.00% 16.90% 17.31% 16.53% 19.76% 3.28%Tunisia WHS 2003 78.66% 0.11% NA 0.00% 18.65% NA 1.17% 3.31% 3.67% 2.63% 0.00% 0.52%Myanmar MICS 2000 79.07% 0.03% 0.52% NA NA 20.34% NA NA 0.07% 0.01% 0.01% 0.04%Latvia WHS 2003 79.59% 0.00% NA NA 19.89% NA 0.00% 8.28% NA 8.50% 8.28% 1.23%Russian Federation WHS 2003 81.77% 0.01% NA 0.00% 17.71% NA 0.00% 0.41% 0.29% 0.35% 0.35% 0.50%Syrian Arab Republic MICS 2006 81.83% 0.01% 0.00% 17.17% NA 1.23% 0.00% 0.00% 0.00% 0.00% 0.00% 0.00%Slovakia WHS 2003 84.13% 10.47% NA 0.00% 11.60% NA 0.00% 11.67% 11.63% 11.29% 13.29% 10.63%Colombia DHS 2005 84.48% 0.14% 0.01% 14.53% 6.22% 7.31% 0.00% 0.00% 0.00% 0.00% 0.00% 0.00%Mauritania MICS 2007 85.71% 0.21% 9.03% 2.52% NA 3.42% 0.15% 0.15% 0.46% 0.27% 0.06% 0.02%Paraguay WHS 2003 87.51% 0.00% NA 0.00% 11.82% NA 0.40% 3.23% 3.19% 3.25% 3.23% 0.09%Brazil WHS 2003 87.80% 0.00% NA NA 11.13% NA 0.00% 0.00% 1.23% 0.01% 0.00% 0.00%Djibouti MICS 2006 88.12% 0.30% 0.72% 7.98% NA 4.01% 0.21% 0.30% 0.47% 0.75% 0.00% 0.15%Iraq MICS 2006 88.76% 0.00% 0.00% 10.83% NA 0.60% 0.00% 0.00% 0.00% 0.00% 0.00% 0.00%Angola MICS 2001 90.28% 0.00% 0.19% 0.17% NA 2.07% 0.00% 0.14% 0.00% 7.38% 0.00% 0.00%Kyrgyzstan MICS 2006 90.70% 7.34% 0.10% 0.00% NA 1.24% 0.12% 0.23% 0.13% 0.32% 0.00% 0.01%Somalia MICS 2006 90.82% 0.37% 1.21% 2.45% NA 4.22% 0.27% 0.15% 1.00% 0.19% 0.00% 0.08%Sierra Leone MICS 2005 91.46% 0.01% 0.00% 5.53% NA 4.80% 0.00% 0.00% 0.00% 0.02% 0.00% 0.00%Central African Republic MICS 2000 91.61% 0.27% 0.57% 3.77% NA 4.76% 0.09% 0.40% NA 0.04% 0.00% 0.07%Suriname MICS 2000 92.14% 2.51% 0.91% 4.06% NA 0.28% NA NA 0.53% 0.30% 0.00% NABelize MICS 2006 92.66% 0.10% 0.00% 3.26% NA 4.76% 0.00% 0.00% 0.00% 0.00% 0.00% 0.00%www.ophi.org.uk July 2010 120
<strong>Acute</strong> <strong>Multidimensional</strong> <strong>Poverty</strong>: A <strong>New</strong> <strong>Index</strong> <strong>for</strong> <strong>Developing</strong> CountriesAlkire & SantosTable 2.2, ContinuedCountry Survey YearPercent ofTotal SampleUsed tocomputeMPI(Unweighted)SchoolingEducationChildSchoolAttendanceMortalityPercent of non response rate by indicator (Unweighted)HealthLiving StandardNutritionWomen/Adult'sBMIChild Nutrition(Weight-<strong>for</strong>-age)Electricity CookingfuelFloorSanitation DrinkingWaterBurkina Faso MICS 2006 93.64% 0.09% 0.10% 3.23% NA 4.12% 0.17% 0.03% 0.12% 0.32% 0.00% 0.03%Georgia MICS 2005 93.68% 0.00% 0.09% 4.33% NA 2.64% 0.00% 0.06% 0.14% 0.06% 0.00% 0.00%Montenegro MICS 2005 93.89% 0.00% 0.08% NA NA 6.03% 0.00% 0.00% 0.00% 0.00% 0.00% 0.00%Bangladesh DHS 2007 94.09% 0.00% 3.30% 2.66% 0.00% 5.99% 0.00% 0.00% 0.06% 0.01% 0.00% 0.00%Senegal DHS 2005 94.38% 0.15% 0.05% 0.94% 65.89% 3.96% 0.05% 0.13% 0.75% 0.25% 1.93% 0.01%Morocco DHS 2004 94.58% 0.05% 0.04% 1.00% 1.28% 4.06% 0.08% 0.33% 3.97% 0.03% 0.01% 0.00%Mozambique DHS 2003 95.14% 0.11% 0.09% 2.70% 5.39% 12.26% 0.13% 0.09% 0.05% 0.05% 0.06% 0.03%Dominican Republic MICS 2000 95.15% 0.60% 0.18% 2.13% NA 2.41% 0.04% 0.07% 0.00% 0.00% 0.00% 0.00%Guyana DHS 2005 95.25% 0.25% 0.16% 4.14% NA NA 0.15% 0.04% 0.07% 0.04% 0.00% 0.00%Nicaragua DHS 2001 95.63% 0.02% 0.10% 2.72% 5.02% 9.74% 0.10% 0.07% 0.30% 0.14% 0.02% 0.01%Zimbabwe DHS 2006 95.68% 0.12% 0.05% 2.68% 4.28% 14.59% 0.13% 0.04% 0.08% 0.15% 0.01% 0.04%Mongolia MICS 2005 95.76% 0.00% 0.00% 1.82% NA 2.55% 0.00% 0.00% 0.02% 0.00% 0.00% 0.00%India DHS 2005 95.88% 0.03% 0.10% 1.91% 6.21% 8.20% 0.02% 0.02% 0.02% 0.09% 0.01% 0.00%Honduras DHS 2006 95.91% 0.02% 0.02% 3.15% 4.74% 9.65% NA 0.01% 0.01% 0.00% 0.01% 0.01%Czech Republic WHS 2003 95.94% 0.37% NA NA 3.02% NA 0.00% 1.95% 1.73% 1.73% 1.73% 1.62%Nigeria DHS 2003 96.04% 0.45% 0.11% 1.45% 2.85% 8.30% 0.18% 0.21% 0.67% 0.09% 0.16% 0.03%Togo MICS 2006 96.12% 0.07% 0.02% 2.63% NA 1.79% 0.01% 0.00% 0.00% 0.03% 0.00% 0.00%Moldova DHS 2005 96.35% 0.81% 0.10% 2.39% 0.00% 4.13% 0.10% 0.02% 0.17% 0.09% 0.05% 0.01%Cote d'Ivoire DHS 2005 96.37% 0.37% 0.88% 1.80% NA NA 0.49% NA 0.32% 0.32% 0.23% 0.24%Serbia MICS 2005 96.40% 0.03% 0.08% NA NA 3.41% 0.00% 0.08% 0.00% 0.00% 0.00% 0.00%Ukraine DHS 2007 96.48% 0.05% 0.27% 2.83% NA NA 0.06% 0.07% 0.26% 0.09% 0.07% 0.04%Liberia DHS 2007 96.52% 0.33% 0.69% 0.83% 2.38% 13.88% 0.16% 0.16% 0.36% 0.22% 0.10% 0.03%Pakistan DHS 2007 96.64% 0.04% 0.11% 1.64% NA NA 1.29% 1.29% 1.25% 1.33% 1.40% 1.22%Lesotho DHS 2004 96.70% 0.04% 0.08% 2.05% 40.50% 6.95% 0.27% 0.02% 0.06% 0.08% 0.07% 0.01%Bolivia DHS 2003 96.93% 0.10% 0.17% 1.79% 2.81% 6.03% 0.15% 0.04% 0.09% 0.11% 0.10% 0.01%Benin DHS 2006 96.95% 0.31% 0.18% 1.90% 0.00% 10.72% 0.00% 0.42% 0.07% 0.12% 0.14% 0.01%Indonesia DHS 2007 97.05% 0.12% 0.26% 2.00% NA NA 0.14% 0.11% 0.33% 0.17% 0.07% 0.04%Madagascar DHS 2004 97.13% 0.19% 0.14% 1.70% 2.42% 9.54% 0.08% 0.13% 0.00% 0.01% 0.01% 0.00%Armenia DHS 2005 97.18% 0.06% 0.04% 1.35% 3.75% 2.29% 0.09% 0.10% 0.61% 0.06% 0.05% 0.08%Assetswww.ophi.org.uk July 2010 121
<strong>Acute</strong> <strong>Multidimensional</strong> <strong>Poverty</strong>: A <strong>New</strong> <strong>Index</strong> <strong>for</strong> <strong>Developing</strong> CountriesAlkire & SantosTable 2.2, ContinuedCountry Survey YearPercent ofTotal SampleUsed tocomputeMPI(Unweighted)SchoolingEducationChildSchoolAttendanceMortalityPercent of non response rate by indicator (Unweighted)HealthLiving StandardNutritionWomen/Adult'sBMIChild Nutrition(Weight-<strong>for</strong>-age)Electricity CookingfuelFloorSanitation DrinkingWaterEstonia WHS 2003 97.20% 0.00% NA 0.00% 1.42% NA 0.00% 1.49% 0.98% 0.95% 1.75% 0.18%Turkey DHS 2003 97.26% 0.04% 0.02% 2.51% 80.84% 0.06% 0.00% NA 0.08% 0.06% 0.03% 0.01%Macedonia MICS 2005 97.31% 0.00% 0.00% 0.33% NA 2.51% 0.00% 0.03% 0.03% 0.00% 0.00% 0.00%Argentina ENNyS 2005 97.33% 0.12% 0.00% 0.00% NA 0.00% 0.01% 0.80% 0.00% 1.76% 0.00% 0.01%Mali DHS 2006 97.35% 0.40% 0.10% 1.12% 0.00% 8.07% 0.29% 0.20% 0.37% 0.25% 0.06% 0.02%Namibia DHS 2007 97.41% 0.41% 0.31% 1.69% 0.00% 15.32% 0.12% 0.04% 0.05% 0.04% 0.00% 0.00%Trinidad and Tobago MICS 2006 97.45% 0.20% 0.06% 2.20% NA NA 0.05% 0.00% 0.00% 0.03% 0.00% 0.04%Ethiopia DHS 2005 97.52% 0.17% 0.11% 1.41% 46.87% 3.76% 0.08% 0.07% 0.08% 0.05% 0.01% 0.00%Malawi DHS 2004 97.54% 0.05% 0.05% 1.75% 2.05% 11.15% 0.16% 0.01% 0.07% 0.04% 0.02% 0.01%Republic of Congo DHS 2005 97.62% 0.17% 0.10% 1.24% 0.00% 9.65% 0.03% 0.73% 0.06% 0.10% 0.00% 0.00%Cameroon DHS 2004 97.63% 0.12% 0.10% 1.57% 42.09% 6.18% 0.05% 0.34% 0.16% 0.11% 0.08% 0.04%Tajikistan MICS 2005 97.65% 0.00% 0.02% 1.23% NA 1.57% 0.00% 0.00% 0.00% 0.00% 0.00% 0.00%Niger DHS 2006 97.70% 0.23% 0.43% 1.34% 45.73% 4.77% 0.07% 0.12% 0.08% 0.05% 0.04% 0.00%Kenya DHS 2003 97.78% 0.13% 0.02% 1.71% 0.00% 7.87% 0.11% 0.08% 0.14% 0.16% 0.10% 0.04%Lao MICS 2006 97.90% 0.02% 0.00% NA NA 2.06% 0.00% 0.00% 0.02% 0.00% 0.00% 0.00%Guinea DHS 2005 98.01% 0.15% 0.06% 0.74% 45.09% 4.19% 0.31% 0.12% 0.27% 0.29% 0.18% 0.03%Swaziland DHS 2007 98.11% 0.12% 0.04% 1.56% 0.00% 14.55% 0.00% 0.06% 0.07% 0.04% 0.00% 0.00%Gambia MICS 2006 98.19% 0.03% 0.02% 0.34% NA 1.03% 0.26% 0.03% 0.12% 0.07% 0.00% 0.00%Peru DHS 2004 98.21% 0.02% 0.00% 1.09% 43.41% 3.01% 0.03% 0.03% 0.01% 0.01% 0.01% 0.00%Azerbaijan DHS 2006 98.40% 0.09% 0.06% 0.70% 3.09% 2.02% 0.11% 0.07% 0.07% 0.07% 0.03% 0.06%Burundi MICS 2005 98.41% 0.04% 0.27% 0.79% NA NA 0.08% 0.09% 0.29% 0.10% 0.04% 0.07%Croatia WHS 2003 98.44% 0.14% NA NA 0.81% NA 0.00% 0.78% 0.95% 0.75% 0.75% 0.00%DR Congo DHS 2005 98.45% 0.10% 0.06% 0.78% 45.43% 5.07% 0.18% 0.05% 0.12% 0.32% 0.00% 0.01%Uzbekistan MICS 2006 98.45% 0.00% 0.00% 0.76% NA 0.97% 0.00% 0.00% 0.00% 0.00% 0.00% 0.00%Hungary WHS 2003 98.60% 0.00% NA NA 1.00% NA 0.00% 0.00% 0.00% 0.00% NA 0.51%Uruguay WHS 2003 98.81% 0.00% NA 0.00% 0.44% NA 0.00% 0.61% 0.43% 0.51% 0.77% 0.17%Thailand MICS 2005 98.83% 0.05% 0.00% 0.34% NA 0.83% 0.00% 0.00% 0.00% 0.00% 0.00% 0.00%Tanzania DHS 2008 98.96% 0.02% 0.28% 0.45% NA NA 0.12% 0.00% 0.04% 0.12% 0.03% 0.00%Occupied Palestinian Territories MICS 2006 98.99% 0.11% 0.02% 0.56% NA 0.33% 0.00% 0.00% 0.00% 0.00% 0.00% 0.00%Rwanda DHS 2005 99.06% 0.18% 0.14% 0.36% 44.20% 2.71% 0.10% 0.08% 0.03% 0.06% 0.04% 0.00%Assetswww.ophi.org.uk July 2010 122
<strong>Acute</strong> <strong>Multidimensional</strong> <strong>Poverty</strong>: A <strong>New</strong> <strong>Index</strong> <strong>for</strong> <strong>Developing</strong> CountriesAlkire & SantosTable 2.2, ContinuedCountry Survey YearPercent ofTotal SampleUsed tocomputeMPI(Unweighted)SchoolingEducationChildSchoolAttendanceMortalityPercent of non response rate by indicator (Unweighted)HealthLiving StandardNutritionWomen/Adult'sBMIChild Nutrition(Weight-<strong>for</strong>-age)Electricity CookingfuelFloorSanitation DrinkingWaterPhilippines DHS 2003 99.11% 0.01% 0.02% 0.71% NA NA 0.02% NA 0.07% 0.05% 0.05% 0.00%Zambia DHS 2007 99.16% 0.07% 0.09% 0.62% 0.00% 9.93% 0.01% 0.01% 0.03% 0.04% 0.01% 0.01%Cambodia DHS 2005 99.18% 0.07% 0.04% 0.63% 45.51% 2.84% 0.02% 0.02% 0.02% 0.02% 0.00% 0.00%Yemen MICS 2006 99.19% 0.02% 0.23% 0.00% NA NA 0.07% 0.12% 0.43% 0.02% 0.00% 0.04%Nepal DHS 2006 99.21% 0.00% 0.00% 0.44% 0.82% 4.47% 0.00% 0.00% 0.05% 0.00% 0.00% 0.00%Bosnia and Herzegovina MICS 2006 99.28% 0.00% 0.02% NA NA 0.69% 0.00% 0.00% 0.00% 0.00% 0.00% 0.00%Haiti DHS 2006 99.30% 0.12% 0.09% 0.36% 43.32% 3.49% 0.01% 0.01% 0.00% 0.13% 0.00% 0.00%Kazakhstan MICS 2006 99.43% 0.00% 0.00% 0.46% NA 0.16% 0.00% 0.00% 0.00% 0.00% 0.00% 0.00%Ghana DHS 2008 99.43% 0.07% 0.03% 0.29% 0.00% 3.86% 0.04% 0.00% 0.02% 0.12% 0.01% 0.00%Viet Nam DHS 2002 99.46% 0.00% 0.00% 0.39% NA NA 0.05% NA 0.08% 0.10% 0.04% 0.04%China WHS 2003 99.61% 0.04% NA 0.00% 0.15% NA 0.07% 0.06% 0.12% 0.09% 0.00% 0.00%Belarus MICS 2005 99.61% 0.00% 0.00% 0.04% NA 0.34% 0.00% 0.00% 0.00% 0.00% 0.00% 0.00%Albania MICS 2005 99.70% 0.00% 0.00% 0.24% NA 0.08% 0.00% 0.00% 0.00% 0.00% 0.00% 0.00%Egypt DHS 2008 99.83% 0.01% 0.01% 0.06% 0.00% 0.74% 0.00% NA 0.04% 0.04% 0.01% 0.00%Mexico ENSANUT 2006 99.86% 0.10% 0.00% 0.00% 25.48% 0.00% 0.00% 0.00% 0.04% 0.00% 0.00% 0.00%Assetswww.ophi.org.uk July 2010 123
<strong>Acute</strong> <strong>Multidimensional</strong> <strong>Poverty</strong>: A <strong>New</strong> <strong>Index</strong> <strong>for</strong> <strong>Developing</strong> CountriesAlkire & SantosAppendix 3: Decomposition Results <strong>for</strong> India, Kenya and Bolivia3.1 India3.1.1 India Decomposition by StateStateMPIValueMPIRankH(Proportionof poor)A(Averageintensity ofdeprivations)Population(millions)2007SamplePopulationShareContributionto AggregateMPIDelhi 0.062 1 0.142 0.437 16.9 1.1% 0.2%Kerala 0.065 2 0.159 0.409 35.0 2.6% 0.6%Goa 0.094 3 0.217 0.434 1.6 0.1% 0.0%Punjab 0.120 4 0.262 0.460 27.1 2.5% 1.0%Himachal Pradesh 0.131 5 0.310 0.423 6.7 0.6% 0.3%Tamil Nadu 0.141 6 0.324 0.436 68.0 5.5% 2.6%Uttaranchal 0.189 7 0.403 0.469 9.6 0.8% 0.5%Maharashtra 0.193 8 0.401 0.481 108.7 9.3% 6.0%Haryana 0.199 9 0.416 0.479 24.1 2.0% 1.3%Gujarat 0.205 10 0.415 0.492 57.3 4.9% 3.4%Jammu And Kashmir 0.209 11 0.438 0.477 12.2 0.9% 0.7%Andhra Pradesh 0.211 12 0.447 0.471 83.9 7.1% 5.1%Karnataka 0.223 13 0.461 0.483 58.6 5.5% 4.2%Eastern States 0.303 14 0.576 0.525 44.2 3.9% 4.0%West Bengal 0.317 15 0.583 0.543 89.5 8.0% 8.5%Orissa 0.345 16 0.640 0.540 40.7 3.7% 4.3%Rajasthan 0.351 17 0.642 0.547 65.4 5.9% 7.0%Uttar Pradesh 0.386 18 0.699 0.552 192.6 16.3% 21.3%Chhattisgarh 0.387 19 0.719 0.539 23.9 2.3% 2.9%Madhya Pradesh 0.389 20 0.695 0.560 70.0 6.5% 8.5%Jharkhand 0.463 21 0.770 0.602 30.5 2.7% 4.2%Bihar 0.499 22 0.814 0.613 95.0 8.0% 13.5%India 0.296 0.554 0.535 1,164.7 100.0% 100%www.ophi.org.uk July 2010 124
<strong>Acute</strong> <strong>Multidimensional</strong> <strong>Poverty</strong>: A <strong>New</strong> <strong>Index</strong> <strong>for</strong> <strong>Developing</strong> CountriesAlkire & SantosStateMPIMPIRankSchoolingProportion of people who are poor and deprived in…Education Health Standard of LivingChild SchoolAttendanceMortality Nutrition Electricity SanitationDrinkingWaterFloorCookingFuelAssetsDelhi 0.062 1 0.04 0.09 0.07 0.09 0.00 0.10 0.03 0.02 0.05 0.06Kerala 0.065 2 0.01 0.07 0.04 0.12 0.05 0.04 0.09 0.03 0.15 0.11Goa 0.094 3 0.04 0.09 0.04 0.16 0.02 0.16 0.10 0.12 0.17 0.12Punjab 0.120 4 0.08 0.13 0.09 0.17 0.02 0.20 0.01 0.16 0.23 0.11Himachal Pradesh 0.131 5 0.04 0.07 0.09 0.25 0.01 0.28 0.08 0.15 0.29 0.20Tamil Nadu 0.141 6 0.09 0.08 0.11 0.21 0.07 0.31 0.05 0.12 0.30 0.24Uttaranchal 0.189 7 0.08 0.10 0.15 0.30 0.15 0.33 0.10 0.30 0.37 0.27Maharashtra 0.193 8 0.08 0.15 0.14 0.30 0.13 0.36 0.08 0.27 0.34 0.28Haryana 0.199 9 0.08 0.20 0.15 0.30 0.08 0.34 0.08 0.24 0.39 0.25Gujarat 0.205 10 0.12 0.13 0.17 0.33 0.09 0.36 0.10 0.24 0.36 0.29Jammu And Kashmir 0.209 11 0.08 0.22 0.16 0.27 0.05 0.40 0.17 0.28 0.39 0.27Andhra Pradesh 0.211 12 0.19 0.13 0.16 0.29 0.08 0.41 0.06 0.19 0.42 0.35Karnataka 0.223 13 0.12 0.21 0.17 0.33 0.08 0.41 0.12 0.19 0.42 0.32Eastern States 0.303 14 0.19 0.21 0.19 0.37 0.41 0.45 0.23 0.50 0.55 0.42West Bengal 0.317 15 0.25 0.23 0.19 0.42 0.41 0.47 0.07 0.48 0.57 0.43Orissa 0.345 16 0.23 0.19 0.24 0.45 0.43 0.62 0.20 0.51 0.63 0.49Rajasthan 0.351 17 0.21 0.32 0.28 0.44 0.31 0.60 0.24 0.36 0.61 0.47Uttar Pradesh 0.386 18 0.18 0.36 0.37 0.46 0.48 0.62 0.07 0.58 0.66 0.41Chhattisgarh 0.387 19 0.21 0.29 0.31 0.52 0.24 0.69 0.22 0.64 0.70 0.48Madhya Pradesh 0.389 20 0.22 0.32 0.31 0.50 0.25 0.65 0.31 0.57 0.67 0.52Jharkhand 0.463 21 0.26 0.45 0.30 0.56 0.55 0.73 0.42 0.63 0.76 0.55Bihar 0.499 22 0.35 0.52 0.35 0.61 0.65 0.74 0.04 0.70 0.79 0.57India 0.296 0.18 0.25 0.23 0.39 0.29 0.49 0.12 0.40 0.52 0.38www.ophi.org.uk July 2010 125
<strong>Acute</strong> <strong>Multidimensional</strong> <strong>Poverty</strong>: A <strong>New</strong> <strong>Index</strong> <strong>for</strong> <strong>Developing</strong> CountriesAlkire & SantosStateMPIMPIRankPercent Contribution of Deprivations in …StandardEducation Healthof LivingDelhi 0.062 1 34.6% 41.4% 24.0%Kerala 0.065 2 20.3% 40.4% 39.3%Goa 0.094 3 22.8% 36.8% 40.4%Punjab 0.120 4 30.0% 36.1% 33.9%Himachal Pradesh 0.131 5 13.6% 43.3% 43.1%Tamil Nadu 0.141 6 19.4% 37.5% 43.2%Uttaranchal 0.189 7 15.9% 39.7% 44.5%Maharashtra 0.193 8 20.0% 37.8% 42.2%Haryana 0.199 9 23.8% 37.6% 38.6%Gujarat 0.205 10 20.3% 40.6% 39.2%Jammu And Kashmir 0.209 11 24.5% 34.0% 41.4%Andhra Pradesh 0.211 12 25.1% 35.0% 39.9%Karnataka 0.223 13 24.9% 36.9% 38.2%Eastern States 0.303 14 22.0% 31.0% 47.0%West Bengal 0.317 15 25.4% 32.0% 42.7%Orissa 0.345 16 20.3% 33.3% 46.4%Rajasthan 0.351 17 25.0% 34.2% 40.8%Uttar Pradesh 0.386 18 23.4% 35.8% 40.8%Chhattisgarh 0.387 19 21.6% 35.8% 42.5%Madhya Pradesh 0.389 20 22.9% 34.7% 42.4%Jharkhand 0.463 21 25.3% 31.0% 43.7%Bihar 0.499 22 29.0% 32.0% 39.0%India 0.296 24.0% 34.7% 41.3%www.ophi.org.uk July 2010 126
<strong>Acute</strong> <strong>Multidimensional</strong> <strong>Poverty</strong>: A <strong>New</strong> <strong>Index</strong> <strong>for</strong> <strong>Developing</strong> CountriesAlkire & Santos3.1.2 India Decomposition by CasteCasteMPIValueMPIRankH(Proportionof poor)A(Averageintensity ofdeprivations)SamplePopulationShareContributionto AggregateMPIScheduled Tribe 0.482 4 0.814 0.592 9.2% 15.1%Scheduled Caste 0.361 3 0.658 0.548 21.6% 26.5%Other Backward Class 0.305 2 0.583 0.523 43.0% 44.5%None of Above 0.157 1 0.333 0.472 26.1% 13.9%India (Hindu) 0.295 0.555 0.531 100% 100%CasteMPIValueMPIRankSchoolingProportion of people who are poor and deprived in…Education Health Standard of LivingChild SchoolAttendanceMortality Nutrition Electricity SanitationDrinkingWaterFloorCookingFuelAssetsScheduled Tribe 0.482 4 0.35 0.37 0.32 0.58 0.47 0.79 0.32 0.71 0.80 0.67Scheduled Caste 0.361 3 0.23 0.28 0.28 0.47 0.37 0.60 0.13 0.50 0.63 0.49Other Backward Class 0.305 2 0.16 0.25 0.25 0.40 0.29 0.54 0.13 0.41 0.55 0.39None of Above 0.157 1 0.06 0.12 0.13 0.24 0.14 0.27 0.07 0.21 0.30 0.19India (Hindu) 0.296 0.17 0.24 0.23 0.39 0.28 0.50 0.13 0.40 0.53 0.38StateMPIValueMPIRankPercent Contribution of Deprivations in...StandardEducation Healthof LivingScheduled Tribe 0.482 4 25.2% 31.4% 43.4%Scheduled Caste 0.361 3 23.5% 34.5% 42.0%Other Backward Class 0.305 2 22.5% 35.6% 43.4%None of above 0.157 1 19.1% 39.6% 43.4%India (Hindu) 0.296 22.7% 35.2% 42.0%www.ophi.org.uk July 2010 127
<strong>Acute</strong> <strong>Multidimensional</strong> <strong>Poverty</strong>: A <strong>New</strong> <strong>Index</strong> <strong>for</strong> <strong>Developing</strong> CountriesAlkire & Santos3.1.3 India Decomposition of the least poor and poorest caste by regionLeast Poor andPoorest Casteby RegionMPIValueMPIRankH(Proportionof poor)A(Averageintensity ofdeprivations)None Urban 0.052 1 0.122 0.425Scheduled Tribe Urban 0.202 2 0.393 0.513None Rural 0.235 3 0.489 0.480Scheduled Tribe Rural 0.510 4 0.856 0.596Proportion of people who are poor and deprived in…Least Poor andMPI MPI Education Health Standard of LivingPoorest CasteValue RankChild SchoolDrinkingCookingby RegionSchoolingMortality Nutrition Electricity SanitationFloorAssetsAttendanceWaterFuelNone Urban 0.052 1 0.02 0.06 0.06 0.09 0.01 0.07 0.02 0.03 0.06 0.06Scheduled Tribe Urban 0.202 2 0.14 0.19 0.16 0.28 0.10 0.34 0.08 0.21 0.32 0.27None Rural 0.235 3 0.09 0.17 0.19 0.35 0.23 0.41 0.11 0.35 0.47 0.28Scheduled Tribe Rural 0.510 4 0.38 0.39 0.34 0.62 0.51 0.84 0.35 0.76 0.85 0.71Least Poor andPoorest CasteMPIValueMPIRankPercent Contribution of Deprivations in...StandardEducation Healthof Livingby RegionNone Urban 0.052 1 26.1% 47.4% 26.5%Scheduled Tribe Urban 0.202 2 27.4% 36.2% 36.4%None Rural 0.235 3 18.0% 38.4% 43.6%Scheduled Tribe Rural 0.510 4 25.1% 31.3% 43.7%www.ophi.org.uk July 2010 128
<strong>Acute</strong> <strong>Multidimensional</strong> <strong>Poverty</strong>: A <strong>New</strong> <strong>Index</strong> <strong>for</strong> <strong>Developing</strong> CountriesAlkire & Santos3.2 Kenya3.2.1 Kenya Decomposition by StateStateMPIValueMPIRankH(Proportionof poor)A(Averageintensity ofdeprivations)SamplePopulationShareContributionto AggregateMPINairobi 0.049 1 0.118 0.411 7.3% 1.2%Central 0.181 2 0.426 0.425 13.5% 8.1%Coast 0.338 5 0.627 0.539 8.1% 9.1%Eastern 0.297 3 0.616 0.482 16.9% 16.6%Nyanza 0.360 7 0.738 0.488 15.4% 18.4%Rift Valley 0.351 6 0.675 0.520 24.0% 27.9%Western 0.317 4 0.669 0.474 11.9% 12.5%North Eastern 0.676 8 0.981 0.690 2.8% 6.3%Kenya 0.302 0.604 0.500 100% 100%StateMPIValueMPIRankSchoolingProportion of people who are poor and deprived in…Education Health Standard of LivingChild SchoolAttendanceMortality Nutrition Electricity SanitationDrinkingWaterFloorCookingFuelAssetsNairobi 0.049 1 0.04 0.05 0.08 0.03 0.06 0.08 0.01 0.03 0.05 0.07Central 0.181 2 0.04 0.04 0.12 0.13 0.42 0.42 0.31 0.36 0.42 0.31Coast 0.338 5 0.09 0.12 0.43 0.19 0.73 0.73 0.63 0.64 0.73 0.53Eastern 0.297 3 0.20 0.22 0.30 0.24 0.61 0.58 0.37 0.51 0.61 0.51Nyanza 0.360 7 0.08 0.07 0.34 0.22 0.67 0.65 0.56 0.63 0.66 0.41Rift Valley 0.351 6 0.17 0.20 0.23 0.30 0.66 0.66 0.55 0.58 0.67 0.53Western 0.317 4 0.10 0.11 0.20 0.26 0.61 0.60 0.51 0.52 0.61 0.45North Eastern 0.676 8 0.67 0.70 0.39 0.38 0.96 0.97 0.92 0.93 0.98 0.97Kenya 0.302 0.12 0.14 0.25 0.22 0.59 0.59 0.48 0.52 0.59 0.45www.ophi.org.uk July 2010 129
<strong>Acute</strong> <strong>Multidimensional</strong> <strong>Poverty</strong>: A <strong>New</strong> <strong>Index</strong> <strong>for</strong> <strong>Developing</strong> CountriesAlkire & SantosState3.2.2 Kenya Decomposition by EthnicityMPIValueMPIRankPercent Contribution of Deprivations in …StandardEducation Healthof LivingNairobi 0.049 1 27.6% 36.7% 35.7%Central 0.181 2 7.9% 23.1% 69.0%Coast 0.338 5 9.6% 28.8% 61.7%Eastern 0.297 3 20.8% 26.8% 52.4%Nyanza 0.360 7 8.3% 29.2% 62.6%Rift Valley 0.351 6 17.3% 24.9% 57.8%Western 0.317 4 11.7% 26.2% 62.1%North Eastern 0.676 8 20.8% 26.8% 52.4%Kenya 0.302 14.5% 26.2% 59.3%EthnicityMPIValueMPIRankH(Proportionof poor)A(Averageintensity ofdeprivations)SamplePopulationShareContributionto AggregateMPIEmbu 0.141 1 0.369 0.381 1.3% 0.6%Kikuyu 0.167 2 0.386 0.433 19.5% 10.3%Taita/Tavate 0.205 3 0.483 0.424 1.2% 0.8%Meru 0.241 4 0.486 0.496 5.2% 4.0%Luhya 0.284 5 0.602 0.472 14.9% 13.4%Kamba 0.304 6 0.633 0.480 11.9% 11.5%Other 0.313 7 0.557 0.563 1.3% 1.3%Kisii 0.315 8 0.708 0.446 5.5% 5.5%Luo 0.333 9 0.663 0.502 11.9% 12.6%Kalenjin 0.369 10 0.736 0.502 11.6% 13.5%Mijikenda/Swahili 0.417 11 0.747 0.558 5.3% 7.0%Kuria 0.508 12 0.852 0.596 0.7% 1.2%Somali 0.594 13 0.887 0.670 4.5% 8.5%Masai 0.599 14 0.961 0.623 3.2% 6.1%Turkana 0.654 15 0.956 0.684 1.9% 3.9%Kenya 0.316 0.622 0.508 100% 100%www.ophi.org.uk July 2010 130
<strong>Acute</strong> <strong>Multidimensional</strong> <strong>Poverty</strong>: A <strong>New</strong> <strong>Index</strong> <strong>for</strong> <strong>Developing</strong> CountriesAlkire & SantosEthnicityMPIValueMPIRankSchoolingProportion of people who are poor and deprived in…Education Health Standard of LivingChild SchoolAttendanceMortality Nutrition Electricity SanitationDrinkingWaterFloorCookingFuelAssetsEmbu 0.141 1 0.02 0.03 0.04 0.09 0.36 0.36 0.34 0.32 0.37 0.26Kikuyu 0.167 2 0.02 0.04 0.14 0.14 0.37 0.38 0.27 0.31 0.38 0.27Taita/Tavate 0.205 3 0.02 0.05 0.20 0.16 0.47 0.35 0.28 0.39 0.47 0.43Meru 0.241 4 0.10 0.10 0.20 0.20 0.48 0.48 0.32 0.42 0.48 0.34Luhya 0.284 5 0.06 0.08 0.34 0.18 0.60 0.58 0.47 0.53 0.59 0.36Kamba 0.304 6 0.04 0.09 0.24 0.33 0.63 0.61 0.56 0.51 0.62 0.44Other 0.313 7 0.10 0.17 0.37 0.28 0.54 0.55 0.48 0.49 0.54 0.30Kisii 0.315 8 0.01 0.08 0.27 0.21 0.71 0.69 0.64 0.61 0.70 0.59Luo 0.333 9 0.05 0.11 0.51 0.21 0.63 0.65 0.50 0.52 0.64 0.42Kalenjin 0.369 10 0.06 0.14 0.27 0.39 0.73 0.72 0.64 0.66 0.73 0.60Mijikenda/Swahili 0.417 11 0.20 0.29 0.40 0.33 0.73 0.71 0.45 0.64 0.74 0.58Kuria 0.508 12 0.14 0.37 0.65 0.30 0.85 0.85 0.69 0.84 0.85 0.70Somali 0.594 13 0.57 0.60 0.41 0.39 0.80 0.82 0.68 0.76 0.88 0.83Masai 0.599 14 0.45 0.56 0.24 0.55 0.96 0.95 0.87 0.92 0.96 0.71Turkana 0.654 15 0.63 0.57 0.33 0.60 0.96 0.92 0.82 0.87 0.95 0.85Kenya 0.316 0.10 0.15 0.29 0.26 0.61 0.60 0.49 0.53 0.61 0.45www.ophi.org.uk July 2010 131
<strong>Acute</strong> <strong>Multidimensional</strong> <strong>Poverty</strong>: A <strong>New</strong> <strong>Index</strong> <strong>for</strong> <strong>Developing</strong> CountriesAlkire & SantosEthnicityPercent Contribution of Deprivations in …MPI MPIStandardValue Rank Education Healthof LivingEmbu 0.141 1 5.6% 15.5% 78.9%Kikuyu 0.167 2 5.8% 28.5% 65.6%Taita/Tavate 0.205 3 5.8% 29.5% 64.7%Meru 0.241 4 14.1% 27.7% 58.1%Luhya 0.284 5 7.8% 30.9% 61.3%Kamba 0.304 6 7.2% 31.1% 61.7%Other 0.313 7 14.3% 34.4% 51.3%Kisii 0.315 8 4.9% 25.5% 69.6%Luo 0.333 9 8.4% 35.7% 55.9%Kalenjin 0.369 10 9.0% 29.6% 61.4%Mijikenda/Sw 0.417 11 19.6% 29.1% 51.4%Kuria 0.508 12 16.6% 31.0% 52.4%Somali 0.594 13 33.0% 22.4% 44.6%Masai 0.599 14 28.2% 22.0% 49.8%Turkana 0.654 15 30.6% 23.8% 45.6%Kenya 0.316 13.1% 29.0% 57.9%3.2.3 Kenya Decomposition of the least poor and poorest ethnicity by regionLeast Poor andPoorest Casteby RegionMPIValueMPIRankH(Proportionof poor)A(Averageintensity ofdeprivations)Central Urban 0.079 1 0.175 0.451Central Rural 0.194 2 0.458 0.424North Eastern Urban 0.564 3 0.908 0.621North Eastern Rural 0.703 4 0.998 0.704www.ophi.org.uk July 2010 132
<strong>Acute</strong> <strong>Multidimensional</strong> <strong>Poverty</strong>: A <strong>New</strong> <strong>Index</strong> <strong>for</strong> <strong>Developing</strong> CountriesAlkire & SantosProportion of people who are poor and deprived in…Least Poor andMPI MPI Education Health Standard of LivingPoorest CasteValue RankChild SchoolDrinkingCookingby RegionSchoolingMortality Nutrition Electricity SanitationFloorAssetsAttendanceWaterFuelCentral Urban 0.079 1 0.02 0.02 0.06 0.06 0.17 0.18 0.15 0.16 0.16 0.14Central Rural 0.194 2 0.05 0.05 0.13 0.14 0.45 0.45 0.33 0.39 0.45 0.34North Eastern Rural 0.564 3 0.73 0.73 0.40 0.37 1.00 0.99 0.97 0.99 1.00 1.00North Eastern Urban 0.703 4 0.44 0.57 0.33 0.42 0.79 0.88 0.71 0.70 0.91 0.87Least Poor andPercent Contribution of Deprivations in...MPI MPIPoorest CasteStandardValue Rank Education Health& Regionof LivingCentral Urban 0.079 1 8.5% 24.4% 67.1%Central Rural 0.194 2 7.8% 23.1% 69.1%North Eastern Urban 0.564 3 30.0% 22.2% 47.9%North Eastern Rural 0.703 4 34.6% 18.4% 47.0%3.3 Bolivia3.3.1 Bolivia Decomposition by StateStateMPI MPIValue RankH(Proportionof poor)A(Averageintensity ofdeprivations)SamplePopulationShareContributionto AggregateMPIOruro 0.118 1 0.267 0.441 5.0% 3.4%Santa Cruz 0.121 2 0.260 0.467 24.4% 16.9%Tarija 0.161 3 0.333 0.484 4.8% 4.4%La Paz 0.167 4 0.372 0.449 26.5% 25.2%Cochabamba 0.175 5 0.347 0.504 18.9% 18.9%Pando 0.176 6 0.345 0.511 0.5% 0.5%Beni 0.235 7 0.501 0.469 3.9% 5.2%Potosi 0.270 8 0.513 0.526 8.7% 13.4%Chuquisaca 0.291 9 0.551 0.527 7.3% 12.1%Bolivia 0.175 0.363 0.483 100% 100%www.ophi.org.uk July 2010 133
<strong>Acute</strong> <strong>Multidimensional</strong> <strong>Poverty</strong>: A <strong>New</strong> <strong>Index</strong> <strong>for</strong> <strong>Developing</strong> CountriesAlkire & SantosStateMPIValueMPIRankSchoolingProportion of people who are poor and deprived in…Education Health Standard of LivingChild SchoolAttendanceMortality Nutrition Electricity SanitationDrinkingWaterFloorCookingFuelAssetsOruro 0.118 1 0.06 0.13 0.16 0.03 0.15 0.26 0.15 0.17 0.18 0.08Santa Cruz 0.121 2 0.04 0.19 0.15 0.03 0.16 0.25 0.07 0.16 0.19 0.13Tarija 0.161 3 0.08 0.26 0.15 0.03 0.23 0.33 0.15 0.18 0.29 0.16La Paz 0.167 4 0.06 0.24 0.21 0.04 0.19 0.36 0.15 0.25 0.24 0.17Cochabamba 0.175 5 0.12 0.19 0.19 0.05 0.22 0.34 0.16 0.26 0.29 0.19Pando 0.176 6 0.12 0.14 0.19 0.06 0.28 0.34 0.31 0.20 0.31 0.23Beni 0.235 7 0.05 0.35 0.23 0.08 0.30 0.50 0.30 0.43 0.40 0.21Potosi 0.270 8 0.19 0.31 0.25 0.08 0.42 0.51 0.26 0.39 0.45 0.32Chuquisaca 0.291 9 0.17 0.36 0.26 0.06 0.47 0.55 0.33 0.42 0.51 0.41Bolivia 0.175 0.09 0.23 0.19 0.05 0.23 0.36 0.16 0.25 0.28 0.19StatePercent Contribution of Deprivations in …MPI MPIStandardValue Rank Education Healthof LivingOruro 0.118 1 27.3% 26.1% 46.6%Santa Cruz 0.121 2 31.5% 24.9% 43.5%Tarija 0.161 3 35.5% 18.5% 46.0%La Paz 0.167 4 30.1% 24.8% 45.1%Cochabamba 0.175 5 30.0% 23.5% 46.5%Pando 0.176 6 24.2% 23.1% 52.7%Beni 0.235 7 27.8% 21.6% 50.5%Potosi 0.270 8 30.8% 20.8% 48.4%Chuquisaca 0.291 9 30.2% 18.4% 51.3%www.ophi.org.uk July 2010 134
<strong>Acute</strong> <strong>Multidimensional</strong> <strong>Poverty</strong>: A <strong>New</strong> <strong>Index</strong> <strong>for</strong> <strong>Developing</strong> CountriesAlkire & Santos3.3.2 Bolivia Decomposition by EthnicityEthnicityMPIValueMPIRankH(Proportionof poor)A(Averageintensity ofdeprivations)SamplePopulationShareContributionto AggregateMPINone 0.132 1 0.277 0.474 40.6% 30%Aymara 0.164 2 0.363 0.452 22.6% 21.1%Guarani 0.227 3 0.456 0.498 2.4% 3.1%Other 0.227 4 0.458 0.495 1.1% 1.4%Quechua 0.231 5 0.442 0.523 33.4% 44.0%Bolivia 0.175 0.358 0.490 100.0% 100.0%Proportion of people who are poor and deprived in…MPI MPI Education Health Standard of LivingEthnicityValue RankChild SchoolDrinkingCookingSchoolingMortality Nutrition Electricity SanitationFloorAssetAttendanceWaterFuelNone 0.132 1 0.04 0.20 0.16 0.05 0.16 0.27 0.11 0.17 0.20 0.13Aymara 0.164 2 0.03 0.24 0.24 0.04 0.19 0.35 0.16 0.24 0.24 0.14Guaraní 0.227 3 0.07 0.38 0.25 0.04 0.31 0.45 0.12 0.33 0.40 0.26Other 0.227 4 0.06 0.33 0.24 0.07 0.28 0.45 0.18 0.39 0.40 0.25Quechua 0.231 5 0.12 0.28 0.27 0.08 0.31 0.44 0.21 0.32 0.37 0.25Bolivia 0.175 0.07 0.24 0.22 0.05 0.22 0.35 0.16 0.24 0.27 0.18EthnicityPercent Contribution of Deprivations in …MPI MPIStandardValue Rank Education Healthof LivingNone 0.132 1 29.8% 26.5% 43.7%Aymara 0.164 2 27.8% 27.6% 44.6%Guaraní 0.227 3 32.9% 21.4% 45.7%Other 0.227 4 29.0% 23.1% 47.8%Quechua 0.231 5 29.5% 24.9% 45.6%Bolivia 0.175 29.3% 25.8% 44.9%www.ophi.org.uk July 2010 135
<strong>Acute</strong> <strong>Multidimensional</strong> <strong>Poverty</strong>: A <strong>New</strong> <strong>Index</strong> <strong>for</strong> <strong>Developing</strong> CountriesAlkire & Santos3.3.3 Bolivia Decomposition of the least poor and poorest ethnicity by regionLeast Poor andPoorest Caste byRegionMPIValueMPIRankH(Proportionof poor)A(Averageintensity ofdeprivations)Quechua Urban 0.053 1 0.122 0.433None Urban 0.062 2 0.143 0.434None Rural 0.342 3 0.684 0.500Quechua Rural 0.406 4 0.756 0.537Proportion of people who are poor and deprived in…Least Poor andMPI MPI Education Health Standard of LivingPoorest CasteValue RankChild SchoolDrinkingCookingby RegionSchoolingMortality Nutrition Electricity SanitationFloorAssetAttendanceWaterFuelQuechua Urban 0.053 1 0.03 0.07 0.10 0.03 0.02 0.11 0.03 0.04 0.03 0.04None Urban 0.062 2 0.01 0.10 0.10 0.03 0.04 0.13 0.04 0.07 0.06 0.05None Rural 0.342 3 0.11 0.51 0.36 0.08 0.54 0.68 0.32 0.48 0.61 0.38Quechua Rural 0.406 4 0.22 0.49 0.44 0.13 0.60 0.75 0.39 0.60 0.69 0.46Least Poor andPercent Contribution of Deprivations in...MPIPoorest Caste MPIStandardRank Education Health& Regionof LivingQuechua Urban 0.053 1 31.8% 39.0% 29.2%None Urban 0.062 2 29.3% 35.9% 34.8%None Rural 0.342 3 30.0% 21.3% 48.7%Quechua Rural 0.406 4 29.2% 23.1% 47.7%www.ophi.org.uk July 2010 136
<strong>Acute</strong> <strong>Multidimensional</strong> <strong>Poverty</strong>: A <strong>New</strong> <strong>Index</strong> <strong>for</strong> <strong>Developing</strong> CountriesAlkire & SantosAppendix 4: Differences in children´s nutritional reference populationsNCHS/WHO vs. MGRS (WHO)IndiaWeight <strong>for</strong> AgeWeight <strong>for</strong> Height0 .2 .4 .6 .8 10 .2 .4 .6 .8 1-6 -5 -4 -3 -2 -1 0 1 2 3 4 5 6z_scorewacwaWHOcwaDHS-5 -4 -3 -2 -1 0 1 2 3 4 5z_scorewhcwhWHOcwhDHSHeight <strong>for</strong> Age0 .2 .4 .6 .8 1-6 -5 -4 -3 -2 -1 0 1 2 3 4 5 6z_scorehachaWHOchaDHSHeight <strong>for</strong> AgeMaliWeight <strong>for</strong> Age0 .2 .4 .6 .8 10 .2 .4 .6 .8 1-6 -5 -4 -3 -2 -1 0 1 2 3 4 5 6z_scorehachaWHOchaDHS-6 -5 -4 -3 -2 -1 0 1 2 3 4 5 6z_scorewacwaWHOcwaDHSWeight <strong>for</strong> Height0 .2 .4 .6 .8 1-5 -4 -3 -2 -1 0 1 2 3 4 5z_scorewhcwhWHOcwhDHSwww.ophi.org.uk July 2010 137
<strong>Acute</strong> <strong>Multidimensional</strong> <strong>Poverty</strong>: A <strong>New</strong> <strong>Index</strong> <strong>for</strong> <strong>Developing</strong> CountriesAlkire & SantosAppendix 5: Correlations between different specifications of MPI (robustnessto indicators´ cutoffs and weights)MPI 2MPI 3MPI 4Using weight-<strong>for</strong>-age (SelectedMeasure)Using weight-<strong>for</strong>-heightUsing height-<strong>for</strong>-ageExcludingChild SchoolAttendanceUsingweight-<strong>for</strong>-ageUsingweight-<strong>for</strong>-heightSelected MeasurePearson 0.989Spearman 0.977Kendall (Taub) 0.884Pearson 0.986 0.999Spearman 0.974 0.998Kendall (Taub) 0.872 0.975Pearson 0.987 0.998 0.996Spearman 0.976 0.996 0.994Kendall (Taub) 0.881 0.960 0.946Number of countries:85 (All DHS and MICS countries)All MPI 1-4 use the <strong>New</strong> Reference Population to calculate children´s nutritional indicatorsIn all cases a cutoff of being deprived in 30% of the weighted indicators was usedMPI 2MPI 3MPI 4Using weight-<strong>for</strong>-age (SelectedMeasure)Using weight-<strong>for</strong>-heightUsing height-<strong>for</strong>-ageExcludingChild SchoolAttendanceUsingweight-<strong>for</strong>-ageUsingweight-<strong>for</strong>-heightUsingheight-<strong>for</strong>-ageSelected MeasurePearson 0.989Spearman 0.988Kendall (Taub) 0.920Pearson 0.986 0.996Spearman 0.985 0.999Kendall (Taub) 0.908 0.984Pearson 0.987 0.998 0.996Spearman 0.987 0.998 0.996Kendall (Taub) 0.917 0.969 0.962Pearson 0.991 0.998 0.997 0.996Spearman 0.989 0.997 0.995 0.996Kendall (Taub) 0.920 0.975 0.966 0.959Using under 5 mortalityMPI 5 (rather than age non-specificmortality)Number of countries:51 (All DHS and three MICS countries which have Birth History)All MPI 1-4 use the <strong>New</strong> Reference Population to calculate children´s nutritional indicatorsIn all cases a cutoff of being deprived in 30% of the weighted indicators was usedMPI 6MPI 7Using weight-<strong>for</strong>-age(Old Reference Population)Not considering distance to water sourceUsing weight-<strong>for</strong>-age(Old Reference Population)MPI 2Using weight-<strong>for</strong>-age(<strong>New</strong> Reference Population)(Selected Measure)Pearson 0.997Spearman 0.994Higher cutoffs <strong>for</strong> water, sanitation andNumber of countries:47 DHS countriesIn all cases a cutoff of being deprived in 30% of the weighted indicators was usedMPI6Using weight-<strong>for</strong>-age(Old Reference Population)Not considering distance towater sourceKendall (Taub) 0.956Pearson 0.995 0.999Spearman 0.991 0.997Kendall (Taub) 0.938 0.975www.ophi.org.uk July 2010 138
<strong>Acute</strong> <strong>Multidimensional</strong> <strong>Poverty</strong>: A <strong>New</strong> <strong>Index</strong> <strong>for</strong> <strong>Developing</strong> CountriesAlkire & SantosMPIWeights 2MPIWeights 350% Education25% Health25% LS50% Health25% Education25% LS50% LS25% EducationMPIWeights 425% HealthNumber of countries: 104MPI Weights 1 MPI Weights 2 MPI Weights 3Equal weights:50% Education 50% Health33% each25% Health 25% Education(Selected25% LS 25% LSMeasure)Pearson 0.991Spearman 0.984Kendall (Taub) 0.903Pearson 0.995 0.985Spearman 0.981 0.957Kendall (Taub) 0.909 0.836Pearson 0.989 0.966 0.978Spearman 0.989 0.970 0.968Kendall (Taub) 0.916 0.854 0.856www.ophi.org.uk July 2010 139