Download PDF - ReliefWeb
Download PDF - ReliefWeb
Download PDF - ReliefWeb
- No tags were found...

Create successful ePaper yourself
Turn your PDF publications into a flip-book with our unique Google optimized e-Paper software.
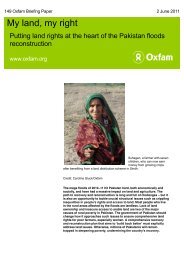
4 5Disaster PreparednessAnd MitigationInnovationFigure 2: Page One of the Drought Bulletin5. The new tool is also easily understandable by localleaders. This has increased the level of disseminationof potential threats, and of the recommendations givenby the District Officials down to the communities.6. Designing and implementing the Early Warning StageClassification methodology has been an opportunityto learn more on the best way to adjust the list of EWSindicators and thresholds.7. Following the training of the District Officials on thismethodology, ACTED reviewed, together with theofficials, the indicators and the thresholds initiallydesigned in 2010. This process proved that such amethodology helps in orienting the choice of theindicators and thresholds in a way that optimizes theefficiency and accuracy of the system.Optimizing the list of EWS indicatorsIn July 2012 ACTED reviewed its initial list of 26 indicators.The exercise was done in collaboration with the districtheads of department who analyse the DEWS data everymonth. Its purpose was to reduce the list of indicatorsin order to keep only the most crucial and relevantones. A shorter list of indicators would be more timeand cost efficient—two paramount factors towards thefuture sustainability of the project. With a more simpleanalysis results could be more accurate and transparent.Doing this exercise at the same time as the work on EarlyWarning Stage Classification helped in several aspects:1. The EWSC helped eliminate some indicators that did notplay a crucial role in the identification of the warningstage.2. The EWSC analysis helped identify some indicatorsthat were redundant, or were only a consequence ofanother indicator.Examples of indicators that were dropped for the abovereasons were:a. Coping mechanisms: This indicator, though interesting,is too complex to fit into the Early Warning StageClassification and was difficult to collect without biasfrom households. The information contained in ‘copingmechanisms’ described as “slaughtering of animals/destocking” also comes under the DEWS indicator“type and number of animals in the market”. Likewise“moving herds to far grazing area/splitting of herds”comes under the DEWS indicator “time spent to reachthe grazing area”. And information on “permanentmigration” can be retrieved from DEWS indicator“livestock migration”. Coping mechanisms such as“reducing portions of meals”, “reducing frequency ofmeals”, “begging for food” and ”borrowing food fromneighbours” which all relate to lack of access to foodand poor availability of food can be easily included inthe three following DEWS indicators:- Price of food (gives information on food availabilityand access)- Terms of trade (gives information on access tofood)- Type of food eaten (gives information on quality offood intake)Changes in one or several of the three indicatorsmentioned above definitely leads to more drasticcoping strategies related to improving access to food.b. Safe water points: In the absence of capacity totest water sources, this indicator was not included inthe stage classification. The review showed that thisparameter is always a conclusion of the analysis of thepercentage of usage of boreholes by the householdrespondents. Therefore the information obtained fromthe indicator “type of water source”, is enough to givea direct estimation of the quality of water used by thecommunities.c. Calf mortality rate: Although this indicator potentiallygives interesting information about the condition oflivestock, it always come as a consequence of livestockdisease incidence or of poor body condition due tolack of pasture or water. The two latter indicators arecollected in the system, and if fully analyzed, theindicator on calf mortality rate becomes less crucial.Caroline Gluck/OxfamThe type of water source gives a good indication of water qualityFine tuning the thresholds for correct determinationof warning stagesAs mentioned above, the thresholds to be used in thismethodology were identified prior to finalising the designof the methodology. When the District Officials startedimplementing the stage classification, several thresholdsturned out to be difficult to use, for example:a) Livestock Body Condition:This indicator gives a percentage of animals in poor,fair and good body condition. The thresholds initiallyattributed percentage of poor/fair/good animalsfor each warning stage. However, it became clearthat many compilations of the three percentagescould not fit in any scenario, and that relying on onecriterion only – the percentage of animals in goodcondition – was more than enough to establish thewarning stage of this indicator. This simplified notonly the methodology but also the thresholds.b) Animals in the market:This indicator gives an estimation of the number offour types of animals brought on sale in the markets:bull, cows, heifers and bull calves. When designingthe thresholds experts gave percentages for each ofthese four types. Using it in practice however proveddifficult as the different types could give differentresults. To simplify the system and make it morepractical, livestock experts agreed that monitoringthe sale of bull and heifers was giving enoughinformation for the purpose of issuing warnings. Thisagain simplified not only the methodology but alsothe thresholds.ConclusionThe Early Warning Stage Classification reinforces thetechnical aspects and improves the quality of the DroughtBulletin. The review of all indicators was a necessary stepin ensuring the full efficiency of the Drought Early WarningSystem. The new list of indicators is being implementedprogressively and should be fully operational in the next fewmonths. The Drought Bulletin gives valuable informationto stakeholders on the crop, livestock, water and livelihoodsectors. And this new tool, through advanced analysis,provides the reader with a general conclusion on the levelof risk that the population faces of being affected by adrought. This is essential to guide stakeholders on the needto implement preparedness measures or not.For comments or suggestions related to this article, pleasecontact: malika.ogwang@acted.org