International Journal of Contemporary Business Studies
International Journal of Contemporary Business Studies
International Journal of Contemporary Business Studies

Create successful ePaper yourself
Turn your PDF publications into a flip-book with our unique Google optimized e-Paper software.
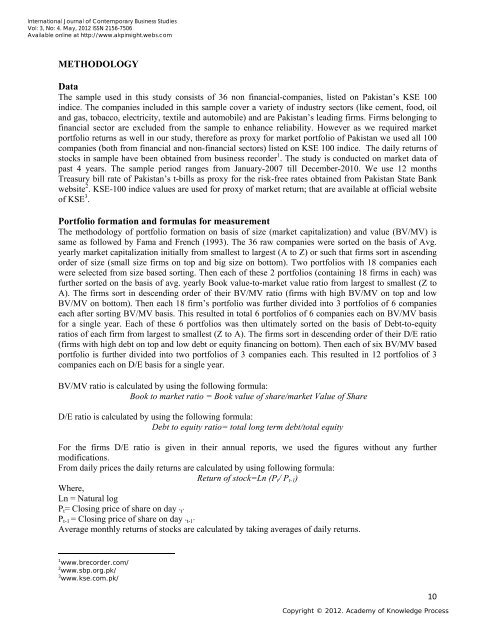
<strong>International</strong> <strong>Journal</strong> <strong>of</strong> <strong>Contemporary</strong> <strong>Business</strong> <strong>Studies</strong>Vol: 3, No: 4. May, 2012 ISSN 2156-7506Available online at http://www.akpinsight.webs.comMETHODOLOGYDataThe sample used in this study consists <strong>of</strong> 36 non financial-companies, listed on Pakistan’s KSE 100indice. The companies included in this sample cover a variety <strong>of</strong> industry sectors (like cement, food, oiland gas, tobacco, electricity, textile and automobile) and are Pakistan’s leading firms. Firms belonging t<strong>of</strong>inancial sector are excluded from the sample to enhance reliability. However as we required marketportfolio returns as well in our study, therefore as proxy for market portfolio <strong>of</strong> Pakistan we used all 100companies (both from financial and non-financial sectors) listed on KSE 100 indice. The daily returns <strong>of</strong>stocks in sample have been obtained from business recorder 1 . The study is conducted on market data <strong>of</strong>past 4 years. The sample period ranges from January-2007 till December-2010. We use 12 monthsTreasury bill rate <strong>of</strong> Pakistan’s t-bills as proxy for the risk-free rates obtained from Pakistan State Bankwebsite 2 . KSE-100 indice values are used for proxy <strong>of</strong> market return; that are available at <strong>of</strong>ficial website<strong>of</strong> KSE 3 .Portfolio formation and formulas for measurementThe methodology <strong>of</strong> portfolio formation on basis <strong>of</strong> size (market capitalization) and value (BV/MV) issame as followed by Fama and French (1993). The 36 raw companies were sorted on the basis <strong>of</strong> Avg.yearly market capitalization initially from smallest to largest (A to Z) or such that firms sort in ascendingorder <strong>of</strong> size (small size firms on top and big size on bottom). Two portfolios with 18 companies eachwere selected from size based sorting. Then each <strong>of</strong> these 2 portfolios (containing 18 firms in each) wasfurther sorted on the basis <strong>of</strong> avg. yearly Book value-to-market value ratio from largest to smallest (Z toA). The firms sort in descending order <strong>of</strong> their BV/MV ratio (firms with high BV/MV on top and lowBV/MV on bottom). Then each 18 firm’s portfolio was further divided into 3 portfolios <strong>of</strong> 6 companieseach after sorting BV/MV basis. This resulted in total 6 portfolios <strong>of</strong> 6 companies each on BV/MV basisfor a single year. Each <strong>of</strong> these 6 portfolios was then ultimately sorted on the basis <strong>of</strong> Debt-to-equityratios <strong>of</strong> each firm from largest to smallest (Z to A). The firms sort in descending order <strong>of</strong> their D/E ratio(firms with high debt on top and low debt or equity financing on bottom). Then each <strong>of</strong> six BV/MV basedportfolio is further divided into two portfolios <strong>of</strong> 3 companies each. This resulted in 12 portfolios <strong>of</strong> 3companies each on D/E basis for a single year.BV/MV ratio is calculated by using the following formula:Book to market ratio = Book value <strong>of</strong> share/market Value <strong>of</strong> ShareD/E ratio is calculated by using the following formula:Debt to equity ratio= total long term debt/total equityFor the firms D/E ratio is given in their annual reports, we used the figures without any furthermodifications.From daily prices the daily returns are calculated by using following formula:Return <strong>of</strong> stock=Ln (P t / P t-1 )Where,Ln = Natural logP t = Closing price <strong>of</strong> share on day ‘t’P t-1 = Closing price <strong>of</strong> share on day ‘t-1’Average monthly returns <strong>of</strong> stocks are calculated by taking averages <strong>of</strong> daily returns.1 www.brecorder.com/2 www.sbp.org.pk/3 www.kse.com.pk/10Copyright © 2012. Academy <strong>of</strong> Knowledge Process