International Journal of Contemporary Business Studies
International Journal of Contemporary Business Studies
International Journal of Contemporary Business Studies

Create successful ePaper yourself
Turn your PDF publications into a flip-book with our unique Google optimized e-Paper software.
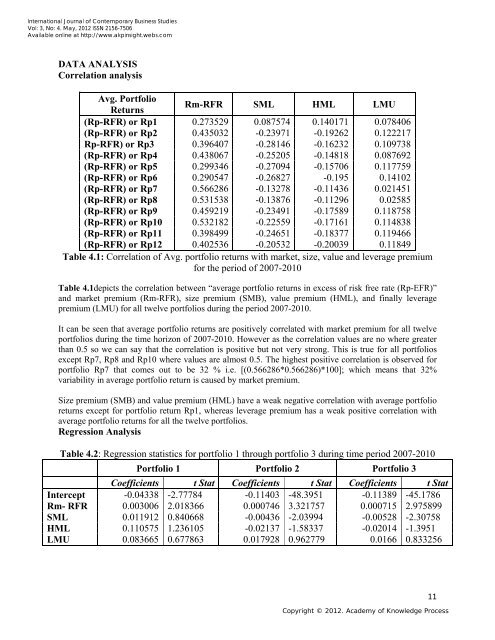
<strong>International</strong> <strong>Journal</strong> <strong>of</strong> <strong>Contemporary</strong> <strong>Business</strong> <strong>Studies</strong>Vol: 3, No: 4. May, 2012 ISSN 2156-7506Available online at http://www.akpinsight.webs.comDATA ANALYSISCorrelation analysisAvg. PortfolioReturnsRm-RFR SML HML LMU(Rp-RFR) or Rp1 0.273529 0.087574 0.140171 0.078406(Rp-RFR) or Rp2 0.435032 -0.23971 -0.19262 0.122217Rp-RFR) or Rp3 0.396407 -0.28146 -0.16232 0.109738(Rp-RFR) or Rp4 0.438067 -0.25205 -0.14818 0.087692(Rp-RFR) or Rp5 0.299346 -0.27094 -0.15706 0.117759(Rp-RFR) or Rp6 0.290547 -0.26827 -0.195 0.14102(Rp-RFR) or Rp7 0.566286 -0.13278 -0.11436 0.021451(Rp-RFR) or Rp8 0.531538 -0.13876 -0.11296 0.02585(Rp-RFR) or Rp9 0.459219 -0.23491 -0.17589 0.118758(Rp-RFR) or Rp10 0.532182 -0.22559 -0.17161 0.114838(Rp-RFR) or Rp11 0.398499 -0.24651 -0.18377 0.119466(Rp-RFR) or Rp12 0.402536 -0.20532 -0.20039 0.11849Table 4.1: Correlation <strong>of</strong> Avg. portfolio returns with market, size, value and leverage premiumfor the period <strong>of</strong> 2007-2010Table 4.1depicts the correlation between “average portfolio returns in excess <strong>of</strong> risk free rate (Rp-EFR)”and market premium (Rm-RFR), size premium (SMB), value premium (HML), and finally leveragepremium (LMU) for all twelve portfolios during the period 2007-2010.It can be seen that average portfolio returns are positively correlated with market premium for all twelveportfolios during the time horizon <strong>of</strong> 2007-2010. However as the correlation values are no where greaterthan 0.5 so we can say that the correlation is positive but not very strong. This is true for all portfoliosexcept Rp7, Rp8 and Rp10 where values are almost 0.5. The highest positive correlation is observed forportfolio Rp7 that comes out to be 32 % i.e. [(0.566286*0.566286)*100]; which means that 32%variability in average portfolio return is caused by market premium.Size premium (SMB) and value premium (HML) have a weak negative correlation with average portfolioreturns except for portfolio return Rp1, whereas leverage premium has a weak positive correlation withaverage portfolio returns for all the twelve portfolios.Regression AnalysisTable 4.2: Regression statistics for portfolio 1 through portfolio 3 during time period 2007-2010Portfolio 1 Portfolio 2 Portfolio 3Coefficients t Stat Coefficients t Stat Coefficients t StatIntercept -0.04338 -2.77784 -0.11403 -48.3951 -0.11389 -45.1786Rm- RFR 0.003006 2.018366 0.000746 3.321757 0.000715 2.975899SML 0.011912 0.840668 -0.00436 -2.03994 -0.00528 -2.30758HML 0.110575 1.236105 -0.02137 -1.58337 -0.02014 -1.3951LMU 0.083665 0.677863 0.017928 0.962779 0.0166 0.83325611Copyright © 2012. Academy <strong>of</strong> Knowledge Process