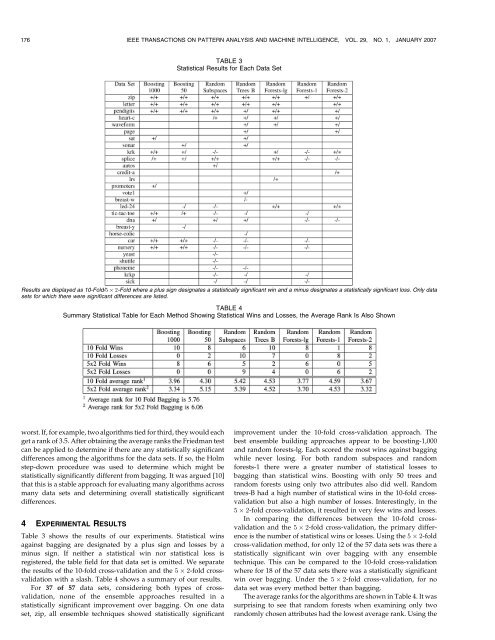
176 IEEE TRANSACTIONS ON PATTERN ANALYSIS AND MACHINE INTELLIGENCE, VOL. 29, NO. 1, JANUARY 2007TABLE 3Statistical Results for Each Data SetResults are displayed as 10-Fold/5 2-Fold where a plus sign designates a statistically significant win and a minus designates a statistically significant loss. Only datasets for which there were significant differences are listed.TABLE 4Summary Statistical Table for Each Method Showing Statistical Wins and Losses, the Average Rank Is Also Shownworst. If, for example, two algorithms tied for third, they would eachget a rank <strong>of</strong> 3.5. After obtaining the average ranks the Friedman testcan be applied to determine if there are any statistically significantdifferences among the algorithms for the data sets. If so, the Holmstep-down procedure was used to determine which might bestatistically significantly different from bagging. It was argued [10]that this is a stable approach for evaluating many algorithms acrossmany data sets and determining overall statistically significantdifferences.4 EXPERIMENTAL RESULTSTable 3 shows the results <strong>of</strong> our experiments. Statistical winsagainst bagging are designated by a plus sign and losses by aminus sign. If neither a statistical win nor statistical loss isregistered, the table field for that data set is omitted. We separatethe results <strong>of</strong> the 10-fold cross-validation and the 5 2-fold crossvalidationwith a slash. Table 4 shows a summary <strong>of</strong> our results.For 37 <strong>of</strong> 57 data sets, considering both types <strong>of</strong> crossvalidation,none <strong>of</strong> the ensemble approaches resulted in astatistically significant improvement over bagging. On one dataset, zip, all ensemble techniques showed statistically significantimprovement under the 10-fold cross-validation approach. Thebest ensemble building approaches appear to be boosting-1,000and random forests-lg. Each scored the most wins against baggingwhile never losing. For both random subspaces and randomforests-1 there were a greater number <strong>of</strong> statistical losses tobagging than statistical wins. Boosting with only 50 trees andrandom forests using only two attributes also did well. Randomtrees-B had a high number <strong>of</strong> statistical wins in the 10-fold crossvalidationbut also a high number <strong>of</strong> losses. Interestingly, in the5 2-fold cross-validation, it resulted in very few wins and losses.In comparing the differences between the 10-fold crossvalidationand the 5 2-fold cross-validation, the primary differenceis the number <strong>of</strong> statistical wins or losses. Using the 5 2-foldcross-validation method, for only 12 <strong>of</strong> the 57 data sets was there astatistically significant win over bagging with any ensembletechnique. This can be compared to the 10-fold cross-validationwhere for 18 <strong>of</strong> the 57 data sets there was a statistically significantwin over bagging. Under the 5 2-fold cross-validation, for nodata set was every method better than bagging.The average ranks for the algorithms are shown in Table 4. It wassurprising to see that random forests when examining only tworandomly chosen attributes had the lowest average rank. Using the
IEEE TRANSACTIONS ON PATTERN ANALYSIS AND MACHINE INTELLIGENCE, VOL. 29, NO. 1, JANUARY 2007 177Friedman test followed by the Holm test with a 95 percentconfidence level it can be concluded that there was a statisticallysignificant difference between bagging and all approaches exceptfor random subspaces using the average accuracy from a 10-foldcross-validation. Using the 5 2 cross-validation results, there wasa statistically significant difference between bagging and allapproaches except for boosting 50 classifiers and random subspaces.The approaches were <strong>of</strong>ten not significantly more accuratethan bagging on individual data sets. However, they wereconsistently more accurate than bagging.5 DISCUSSIONSince many papers compare their approaches with bagging andshow improvement, it might be expected that one or more <strong>of</strong> theseapproaches would be an unambiguous winner over bagging. Thiswas not the case when the results are looked at in terms <strong>of</strong>statistically significant increases in accuracy on individual datasets. Of the 57 data sets considered, 37 showed no statisticallysignificant improvement over bagging for any <strong>of</strong> the othertechniques, using either the 10-fold or 5 2 cross-validation.However, using the Friedman-Holm tests on the average ranks, wecan conclude that several approaches perform statistically significantlybetter than bagging on average across the group <strong>of</strong> datasets. Informally, we might say that while the gain over bagging is<strong>of</strong>ten small, there is a consistent pattern <strong>of</strong> gain.There are three data sets, letter, pendigits, and zip, for whichnearly everything improves on the accuracy <strong>of</strong> bagging. Each <strong>of</strong>those data sets involves character recognition. We conductedexperiments that attempt to increase the diversity <strong>of</strong> an ensemble<strong>of</strong> bagged classifiers, hypothesizing that the diversity created bybagging on the letter and pendigits data sets was insufficient toincrease the accuracy <strong>of</strong> the ensemble. This was performed bycreating bags <strong>of</strong> a smaller size than the training set, these sizesranging from 20 percent to 95 percent in 5 pecent increments. Thehighest ensemble accuracy obtained on the letter data set, with95 percent bags, was only marginally higher than the result with100 percent bags. This difference was not statistically significant.The pendigits data set showed no improvement at any size. Zip wasnot tested due to running time constraints.The raw accuracy numbers show that random subspaces can beup to 44 percent less accurate than bagging on some data sets. Datasets that perform poorly with random subspaces likely haveattributes which are both highly uncorrelated and each individuallyimportant. One such example is the krk (king-rook-king) dataset which stores the position <strong>of</strong> three chess pieces in row#, column#format. If even one <strong>of</strong> the attributes is removed from the data set,vital information is lost. If half <strong>of</strong> the attributes are dismissed (e.g.,King at A1, Rook at A?, and King at ??) the algorithm will not haveenough information and will be forced to guess randomly at theresult <strong>of</strong> the chess game.Boosting-by-resampling 1,000 classifiers was substantiallybetter than with 50 classifiers. Sequentially generating moreboosted classifiers resulted in both more statistically significantwins and fewer statistically significant losses. If processing timepermits additional classifiers to be generated, a larger ensemblethan 50 is worthwhile.Random forests using only two attributes obtained a betteraverage rank than random forests-lg in both cross-validationmethods but did worse in terms <strong>of</strong> number <strong>of</strong> statistically significantimprovements. Experimentation with the splice data set resulted instatistically significant wins for random forests-lg and statisticallysignificant losses for random forests-2 with a 6 to 9 percent differencein accuracy. Thus, while testing only two random attributes is likelysufficient, testing additional attributes may prove beneficial oncertain data sets. Breiman suggested using out-<strong>of</strong>-bag accuracy todetermine the number <strong>of</strong> attributes to test [6].There are other potential benefits aside from increased accuracy.Random forests, by picking only a small number <strong>of</strong> attributes to test,generates trees very rapidly. Random subspaces, which tests fewerattributes, can use much less memory because only the chosenpercentage <strong>of</strong> attributes needs to be stored. Recall that since randomforests may potentially test any attribute, it does not require lessmemory to store the data set. Since random trees do not need tomake and store new training sets, they save a small amount <strong>of</strong> timeand memory over the other methods. Finally, random trees andrandom forests can only be directly used to create ensembles <strong>of</strong>decision trees. Bagging, boosting, and random subspaces could beused with other learning algorithms, such as neural networks.6 AN ADVANTAGE OF BAGGING-BASED METHODS FORENSEMBLE SIZEWe used an arbitrarily large number <strong>of</strong> trees for the ensemble in thepreceding section. The boosting results, for example, show that anincrease in the number <strong>of</strong> trees provides better accuracy than thesmaller ensemble sizes generally used. This suggests a need to knowwhen enough trees have been generated. It also raises the question <strong>of</strong>whether approaches competitive with boosting-1,000 may (nearly)reach their final accuracy before 1,000 trees are generated. The easiestway <strong>of</strong> determining when enough trees have been generated wouldbe to use a validation set. This unfortunately results in a loss <strong>of</strong> datawhich might otherwise have been used for training.One advantage <strong>of</strong> the techniques which use bagging is the abilityto test the accuracy <strong>of</strong> the ensemble without removing data from thetraining set, as is done with a validation set. Breiman hypothesizedthat this would be effective [6]. He referred to the error observedwhen testing each classifier on examples not in its bag as the “out-<strong>of</strong>bag”error, and suggested that it might be possible to stop buildingclassifiers once this error no longer decreases as more classifiers areadded to the ensemble. The effectiveness <strong>of</strong> this technique has notyet been fully explored in the literature. In particular, there areseveral important aspects which are easily overlooked, and aredescribed in the following section.6.1 ConsiderationsIn bagging, only a subset <strong>of</strong> examples typically appear in the bagwhich will be used in training the classifier. Out-<strong>of</strong>-bag errorprovides an estimate <strong>of</strong> the true error by testing on those exampleswhich did not appear in the training set. Formally, given a set T <strong>of</strong>examples used in training the ensemble, let t be a set <strong>of</strong> size jT jcreated by a random sampling <strong>of</strong> T with replacement, moregenerally known as a bag. Let s be a set consisting <strong>of</strong> T ðT \ tÞ.Since s consists <strong>of</strong> all those examples not appearing within the bag,it is called the out-<strong>of</strong>-bag set. A classifier is trained on set t andtested on set s. In calculating the voted error <strong>of</strong> the ensemble, eachexample in the training set is classified and voted on by only thoseclassifiers which did not include the example in the bag on whichthat classifier was trained. Because the out-<strong>of</strong>-bag examples, bydefinition, were not used in the training set, they can be used toprovide an estimate <strong>of</strong> the true error.Only a fraction <strong>of</strong> the trees in the ensemble are eligible to vote onany given item <strong>of</strong> training data by its being “out-<strong>of</strong>-bag” relative tothem. For example, suppose out-<strong>of</strong>-bag error was minimized at150 trees. These 150 trees are most likely an overestimate <strong>of</strong> the “truenumber” because for any example in the data set, it would need to beout-<strong>of</strong>-bag on 100 percent <strong>of</strong> the bags in order to have all 150 treesclassify that example. Therefore, the OOB results most likely lead toa larger ensemble than is truly needed.Our experimentation with algorithms to predict an adequatenumber <strong>of</strong> decision trees is further complicated by out-<strong>of</strong>-bag error