World Primary Nickel Production - International Nickel Study Group
World Primary Nickel Production - International Nickel Study Group
World Primary Nickel Production - International Nickel Study Group

Create successful ePaper yourself
Turn your PDF publications into a flip-book with our unique Google optimized e-Paper software.
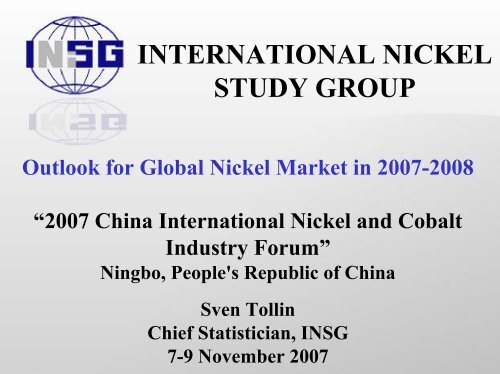
INTERNATIONAL NICKELSTUDY GROUPOutlook for Global <strong>Nickel</strong> Market in 2007-2008“2007 China <strong>International</strong> <strong>Nickel</strong> and CobaltIndustry Forum”Ningbo, People's Republic of ChinaSven TollinChief Statistician, INSG7-9 November 2007
Overview of the presentation‣ INSG Information‣ <strong>World</strong> <strong>Nickel</strong> Ore <strong>Production</strong>‣ <strong>World</strong> <strong>Primary</strong> <strong>Nickel</strong> <strong>Production</strong>, Usage and Balance‣ Prices and Stocks‣ First Use of <strong>Primary</strong> <strong>Nickel</strong>‣ <strong>Primary</strong> <strong>Nickel</strong> Usage in the Stainless Steel Sector‣ <strong>Nickel</strong> Developments‣ <strong>World</strong> <strong>Primary</strong> <strong>Nickel</strong> <strong>Production</strong>, Usage and Balance2005 to 2008‣ Conclusions2
INSG (1)‣Headquarters/Secretariat - Lisbon, Portugal‣Co-located with <strong>International</strong> Lead & Zincand Copper <strong>Study</strong> <strong>Group</strong>s, with significantcost savings and synergies‣Membership and Contributions from 15Countries and the European Community‣Meetings twice a year, held mainly inApril/May and October, usually in Lisbon3
INSG (2)‣An Autonomous <strong>International</strong> GovernmentalOrganization‣Membership by both producing and usercountries‣Significant role for industry representation‣Small Secretariat with professional staff oftwo, plus shared Secretary-General, Economist& Administrative Officer4
INSG (3)‣Member Countries decide on <strong>Group</strong>’s work‣Industry Advisors have major influence‣Avoids politicization‣Close contact with key industry associations,including <strong>Nickel</strong> Institute, ISSF‣Very strong support from Non MemberCountries and Individual Companies5
Member CountriesAustralia Greece Norway Germany(Assoc. Member)Cuba Portugal FinlandEC Italy Russian FederationJapan Sweden NetherlandsFrance Brazil United Kingdom6
Objectives (1)‣to collect and publish improved statisticsmonthly on nickel markets - includingproduction, usage (consumption), trade,stocks, prices and other statistics such asrecycling‣to publish other information on nickel, suchas data on industry facilities, environmentalregulations and end use markets7
Objectives (2)‣to provide a forum for discussions on nickelissues of interest to nickel producing andusing (consuming) countries and theirindustries, including environmental issues‣to undertake economic analysis of nickelmarkets and related topics8
Statistics• Extensive range of statistics producedmonthly• Coverage includes mine production,primary nickel, nickel-bearing scrap• <strong>Production</strong>, usage (consumption), stocks,trade• Usage (consumption) data is particularlywell regarded9
Economic andEnvironmental issues‣ Legislative: advising governments on impact ofexisting and new legislation on the nickel market‣ <strong>Nickel</strong> Recyclingenvironmental impact: waste, primary resourceseconomic (market) impact: supply of nickel units from scrap‣ Economic: studies on nickel supply and demand;country studies; trade issues; potential CommonFund for Commodities projects to promote nickel10
<strong>World</strong> <strong>Nickel</strong> Ore<strong>Production</strong>1800in 1000 tonnes16001400120010008006001990 1991 1992 1993 1994 1995 1996 1997 1998 1999 2000 2001 2002 2003 2004 2005 2006 2007 200811
<strong>World</strong> <strong>Nickel</strong> Ore<strong>Production</strong>in 1000 tonnesOceania22.6%1996(1,051.2)Africa6.6%Oceania18.5%2006(1,469.6)Africa5.4%Europe25.5%Asia14.3%America31.0%Europe23.4%Asia19.0%America33.6%12
<strong>World</strong> <strong>Primary</strong> <strong>Nickel</strong><strong>Production</strong>1600in 1000 tonnes1400120010008006001990 1991 1992 1993 1994 1995 1996 1997 1998 1999 2000 2001 2002 2003 2004 2005 2006 2007 200813
<strong>World</strong> <strong>Primary</strong> <strong>Nickel</strong><strong>Production</strong>in 1000 tonnesAfrica5.2%1996(956.2)America25.3% Asia19.3%Africa4.1%2006(1,362.0)America23.8% Asia22.3%Oceania12.2%Europe38.1%Oceania12.2%Europe37.6%14
<strong>World</strong> <strong>Primary</strong> <strong>Nickel</strong>Usage (consumption)1600in 1000 tonnes1400120010008006001990 1991 1992 1993 1994 1995 1996 1997 1998 1999 2000 2001 2002 2003 2004 2005 2006 2007 200815
<strong>World</strong> <strong>Primary</strong> <strong>Nickel</strong>Usage (consumption)in 1000 tonnes1996(942.5)Europe39.0%2006(1,399.1)Europe35.2%Asia38.5%Oceania0.2%Africa2.6%America19.7%Asia48.7%America12.9%Oceania0.2%Africa3.0%16
<strong>World</strong> <strong>Primary</strong> <strong>Nickel</strong>Balance1400in 1000 tonnes120010008006004002000-2003358912414 3256116326-41 -59-58 -40-18-371990 1991 1992 1993 1994 1995 1996 1997 1998 1999 2000 2001 2002 2003 2004 2005 2006BALANCE PRIMARY NICKEL PRODUCTION PRIMARY NICKEL USAGE17
LME prices and stocks6000050000Prices (Cash, US$/tonne)Stocks (tonnes)400003000020000100000JFMAMJJASONDJFMAMJJASONDJFMAMJJASONDJFMAMJJASONDJFMAMJJASONDJFMAMJJASONDJFMAMJJASONDJFMAMJJAS2000 2001 2002 2003 2004 2005 2006 200718
First Use of <strong>Primary</strong> <strong>Nickel</strong>in 2006CoinageFerrous 2%8%Plating9%Others6%Ni alloys11%Stainless64%Source: Eramet Ni Research19
High volatility inprimary nickel usage is dueto the Stainless Steel sector• 2005:63.7% ≈ 790 000t+ 135 000t, +17%• 2006:66.3% ≈ 925 000t• 2007:down20
<strong>Nickel</strong> Developments<strong>Nickel</strong> Prices / New CapacityAnnual Avg. Price USD40000350002000/2010s30000250002000015000100005000PastSLN 1875Inco Sudbury1902Falco 1928Rustenburg 1928Noeilsk 1933Nicaro 194250sSherritt 1954Hanna 1954Outokumpu 1956Larco 1956Moa 1959Inco Thompson 1961Morro 196270sImpala 1969Bindura 1969Empress 1969WMC 1970Falcondo 1971Botsw ana 1973Nonoc 1974QNI 1975PTAT 197580sCMSA 1982Codemin 1982Tocantins 1982Kavadarci 1982Kosovo 1983Punta Gorda 198690sAnaconda 1999Caw se 1999Bulong 1999Loma Niquel 200001930 1935 1940 1945 1950 1955 1960 1965 1970 1975 1980 1985 1990 1995 2000 2005 2010 201521
New <strong>World</strong> <strong>Primary</strong> Refined<strong>Nickel</strong> Capacity in 2006• <strong>World</strong> nickel refined capacity in 2006 increased byover 77 000 tpa, or over 5%, compared with 2005’sfigure, according to INSG data• Most were brown-field expansions• <strong>World</strong> total refined capacity was over 1.53 Mtpa in2006• <strong>World</strong> capacity utilization was over 88%• The figures above exclude nickel pig iron productioncapacity in China, which could be considerable22
Refined <strong>Nickel</strong> Capacityby Country2006: ≈ 1.5MtNew committed developments:≈ 0.5MtAUSTRIA0%BRAZIL2%AUSTRALIAZIMBABWE 9%2%VENEZUELA1%UK3%UKRAINE1%SOUTH AFRICA2%SERBIA &MONTENEGRO0%CANADA11%RUSSIAN FED.22%CHINA P.R.9%COLOMBIA4%CUBA3%NEWCALEDONIA4%NORWAY6%DOM. REP.2%FINLAND4%FRANCE1%FYROM1%GREECE2%INDONESIA2%JAPAN11%AUSTRALIA15%SOUTH AFRICA2%RUSSIAN FED.4%NEWCALEDONIA12%MADAGASCAR12%NewproducingcountryBRAZIL31%JAPAN7%KOREA REP.6%CANADA3%CHINA P.R.6%FYROM2%Newproducingcountry23
<strong>World</strong> <strong>Primary</strong> <strong>Nickel</strong><strong>Production</strong> 2005 to 2008in 1000 tonnesArea20052006% change2007% change2008% changeAfrica55.556.11.056.71.160.05.8America307.6324.25.4335.33.4341.41.8Asia271.0303.612.0384.126.5410.56.9Europe485.2512.45.6525.62.6544.03.5Oceania177.4165.7-6.6168.41.6213.326.7Total1296.71362.05.01470.17.91569.26.724
<strong>World</strong> <strong>Primary</strong> <strong>Nickel</strong>Usage 2005 to 2008in 1000 tonnesArea20052006% change2007% change2008% changeAfrica32.042.031.327.5-34.537.134.9America174.1180.43.6168.4-6.7174.23.4Asia590.8681.815.4721.55.8787.59.1Europe447.2492.010.0414.9-15.7464.712.0Oceania2.82.92.83.03.93.00.0Total1246.91399.112.21335.3-4.61466.59.825
<strong>World</strong> <strong>Primary</strong> <strong>Nickel</strong>Balance 2005 to 2008in 1000 tonnesArea20052006% change2007% change2008% change<strong>Production</strong>1296.71362.05.01470.17.91569.26.7Usage1246.91399.112.21335.3-4.61466.59.8Balance49.7-37.1134.8102.726
Conclusions (1)• The nickel market has become very volatile• <strong>Primary</strong> nickel usage down by 5% in 2007, butcould increase by 10% in 2008• <strong>Primary</strong> nickel projects are starting to comeinto production and up to 0.5Mt have beenidentified as committed• <strong>Primary</strong> nickel production is estimated tosteadily increase, by 8% in 2007 and a further7% in 200827
Conclusions (2)• Sufficient primary nickel units should beavailable in, at least, the short to medium term• China will remain the most important market• Developments in nickel pig iron might becomea surprise factor in the future.28
INTERNATIONALNICKEL STUDY GROUPMany thanks for yourkind attention!Sven Tollinsven.tollin@insg.orgChief StatisticianRua Almirante Barroso,38 - 5th, 1000-013Lisbon, Portugalphone: (351) 21 356 7030fax: (351) 21 356 7039insg@insg.org29