

2008 Butterflies
2008 Butterflies
2008 Butterflies
- No tags were found...

You also want an ePaper? Increase the reach of your titles
YUMPU automatically turns print PDFs into web optimized ePapers that Google loves.
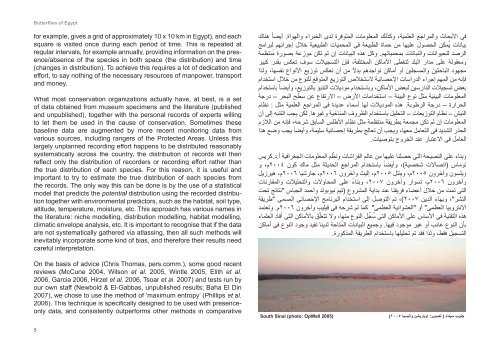
<strong>Butterflies</strong> of Egyptfor example, gives a grid of approximately 10 x 10 km in Egypt), and eachsquare is visited once during each period of time. This is repeated atregular intervals, for example annually, providing information on the presence/absenceof the species in both space (the distribution) and time(changes in distribution). To achieve this requires a lot of dedication andeffort, to say nothing of the necessary resources of manpower, transportand money.What most conservation organizations actually have, at best, is a setof data obtained from museum specimens and the literature (publishedand unpublished), together with the personal records of experts willingto let them be used in the cause of conservation. Sometimes thesebaseline data are augmented by more recent monitoring data fromvarious sources, including rangers of the Protected Areas. Unless thislargely unplanned recording effort happens to be distributed reasonablysystematically across the country, the distribution of records will thenreflect only the distribution of recorders or recording effort rather thanthe true distribution of each species. For this reason, it is useful andimportant to try to estimate the true distribution of each species fromthe records. The only way this can be done is by the use of a statisticalmodel that predicts the potentialdistribution using the recorded distribu-tion together with environmental predictors, such as the habitat, soil type,altitude, temperature, moisture, etc. This approach has various names inthe literature: niche modelling, distribution modelling, habitat modelling,climatic envelope analysis, etc. It is important to recognise that if the dataare not systematically gathered via atlassing, then all such methods willinevitably incorporate some kind of bias, and therefore their results needcareful interpretation.الأبحاث والمراجع العلمية، وكذلك المعلومات المتوفرة لدى الخبراء والهواة. أيضاً هناكفىبيانات يُمكِن الحصول عليها من حماة الطبيعة فى المحميات الطبيعية خلال إجرائهم لبرامجالرصد للحيوانات والنباتات بمحمياتهم. وكل هذه البيانات إن لم تكن موزعة بصورة مُنتظمةومعقولة على مدار البلد لتغطى الأماكن المختلفة، فإن التسجيلات سوف تعكس بقدر كبيرمجهود الباحثين والمسجلين أو أماكن تواجدهم بدلاً من أن تعكس توزيع الأنواع نفسها، ولذافإنه من المهم إجراء الدراسات الإحصائية لاستخلاص التوزيع المتوقع للنوع من خلال استخدامتسجيلات الدارسين لبعض الأماكن، وباستخدام موديلات التنبؤ بالتوزيع، وأيضاً باستخدامبعضالمعلومات البيئية مثل نوع البيئة – استخدامات الأرض – الارتفاع عن سطح البحر – درجةالحرارة – درجة الرطوبة. هذه الموديلات لها أسماء عديدة فى المراجع العلمية مثل : نظامالنيش – نظام التوزيعات – التحليل باستخدام الظروف المناخية وغيرها. لكن يجب التنبه إلى أنالمعلومات إن لم تكن مجمعة بطريقة منتظمة مثل نظام الأطلس السابق شرحه، فإنه من اللازمالشديد فى التعامل معها، ويجب أن تعالج بطريقة إحصائية سليمة، وأيضاً يجب وضع هذاالحذرالعامل فى الاعتبار عند الخروج بتوصيات.ًًًوبناء على النصيحة التى حصلنا عليها من عالِم الفراشات ونظُ م المعلومات الجغرافية أ.د.كريس(اتصالات شخصية)، وأيضاً باستخدام المراجع الحديثة مثل ماك كون ٢٠٠٤م، وتوماسويلسون وآخرون ٢٠٠٥م، وينتل ٢٠٠٥م، إليث وآخرون ٢٠٠٦م، جارشيا ٢٠٠٦م، هيرزيلوآخرون ٢٠٠٦م، تسوار وآخرون ٢٠٠٧، وبناءً على المحاولات والتحليلات والمقارناتالتى تمت من خلال أعضاء فريقنا عند بداية المشروع (تيم نيوبولد وأحمد الجباس "نتائج تحتالنشر"، وبهاء الدين ٢٠٠٧)، تم التوصل إلى استخدام البرنامج الإحصائى المسمى "طريقةالعظمى" أو "العشوائية العظمى" كما تم شرحه فى فيليب وآخرون ٢٠٠٦م. وتعتمد الانتروبياالتقنية فى الأساس على الأماكن التى سُ ج ِّ ل النوع منها، ولا تتعلّق بالأماكن التى أفاد العلماء هذهبأن النوع غائب أو غير موجود فيها. وجميع البيانات المُتاحة لدينا تفيد وجود النوع فى أماكنالتسجيل فقط، ولذا فقد تم تحليلها باستخدام الطريقة المذكورة.ًOn the basis of advice (Chris Thomas, pers.comm.), some good recentreviews (McCune 2004, Wilson et al. 2005, Wintle 2005, Elith et al.2006, Garcia 2006, Hirzel et al. 2006, Tsoar et al. 2007) and tests run byour own staff (Newbold & El-Gabbas, unpublished results; Baha El Din2007), we chose to use the method of ‘maximum entropy’ (Phillips et al.2006). This technique is specifically designed to be used with presenceonlydata, and consistently outperforms other methods in comparative5South Sinai (photo: OpWall 2005)جنوب سيناء ) تصوير: اوباريشن واليسيا ٢٠٠٥)