Turkey - Coca Cola İçecek
Turkey - Coca Cola İçecek
Turkey - Coca Cola İçecek

You also want an ePaper? Increase the reach of your titles
YUMPU automatically turns print PDFs into web optimized ePapers that Google loves.
7An Outstanding Success StoryConsolidated Net Sales(TL in millions)Consolidated EBITDA(TL in millions)2,7534351,0322004 20101422004 2010International15%Revenue Split78%International23%International15%EBITDA SplitInternational21%2005 2010 20052010<strong>Turkey</strong>85%<strong>Turkey</strong>77%<strong>Turkey</strong>85%<strong>Turkey</strong>79%
Leading Brands and Market Positions<strong>Turkey</strong> Pakistan Kazakhstan Azerbaijan Kyrgyzstan Turkmenistan Jordan Syria Iraq68.9%#128.7%#234.2%#156.2%#1n.a.#1n.a. 12.2%#28.9%#2n.a.24.5%#11.1%#98.1%#36.1%#59.2%#29.6%#36.6%#354.5%#1*2010 Market Shares8
Median Age9Future Opportunities4540Russia35Italy2010 Sparkling Beverages Consumption vs Median AgeGermanyGreeceHungarySpainUKBulgariaPolandUSA302520KyrgyzstanTajikistanPakistanAfghanistanKazakhstanAzerbaijanTurkmenistanEgyptSyriaIraq<strong>Turkey</strong>South AfricaLibya OmanJordan Saudi ArabiaKuwaitUAEQatarArgentinaMexico15Yemen0 20 40 60 80 100 120 140 160 180PerCap Consumption (L)Source: Wikipedia& CanadeanCCI territory total population: 363 million62% of our population is below 29 years of age
Business Overview &StrategyOperational ReviewFinancial ReviewAppendix
Operational Review, <strong>Turkey</strong> – 3Q11Sparkling category posted low single digitgrowth in 3Q11 despite;‣ high base of the last year‣ below average weather temperatures‣ slower economic activityStill category grew ca. 30% in 3Q11 supportedby;‣ strong demand to new launches‣ growing water & tea category12
Operational Review, Int. Markets – 3Q11International volume sustained its stronggrowth momentumCentral Asia operations succeeded to growVolume split (uc) –International(9M2011)at above 20%‣ Kazakhstan volume grew ca. 20%‣ Azerbaijan volume was flatPakistan volume growth came in at above20%Iraq continued its strong volume growth atSYRIA1%PAKISTAN32%IRAQ11%KAZAKHSTAN24%AZERBAIJAN16%KYRGYZSTAN5%above 25%JORDAN6%TURKMENISTAN6%13
Product Launches in 9M11* Burn Blue * Gladiator<strong>Turkey</strong> <strong>Turkey</strong>**<strong>Coca</strong>-<strong>Cola</strong>200 ml<strong>Turkey</strong>**RamadanSherbet<strong>Turkey</strong>**CappyPulpy Orange<strong>Turkey</strong>**Six new flavoured tea<strong>Turkey</strong>***CappyAnanas<strong>Turkey</strong>***Damla ***Damla Minera330 ml&750 ml 330 ml&750 ml<strong>Turkey</strong> <strong>Turkey</strong>* Cappy Mango **Fanta **Minute Maid **BurnJordan Lemonade Pulpy Tropical KazakhstanKazakhstanPakistan**Burn PETAzerbaijan**Fanta **Bonaqua-5ltGreen Apple AzerbaijanAzerbaijan**Coke ZeroKazakhstanAzerbaijan***FantaLemonadeKyrgyzstan***Burn Pet400mlKazakhstan*1Q2011 launches** 2Q2011 launches***3Q2011 launches14
Business Overview &StrategyOperational ReviewFinancial ReviewAppendix
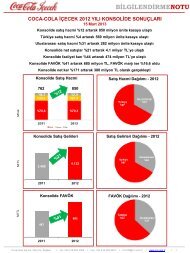
Volume up by 16.0% in 9M11<strong>Turkey</strong> Volume<strong>Turkey</strong> Volume International Volume Consolidated Volume(Unit cases in millions) (Unit cases in millions) (Unit cases in millions)398.9449.9535.3621.1136.4171.39M109M119M109M119M109M113Q11Consolidated up by 13.9% to 264.6 million uc<strong>Turkey</strong> up by 10.0% to 191.0 million ucInternational up by 25.5% to 73.7 million uc16
Consolidated Volume Category SplitVolume Split Q/QVolume Split Y/Y3Q10 3Q11 9M10 9M11Tea5.7%Tea6.6%Tea7.3%Tea8.0%Still19.5%Still20.6%Still19.9%Still21.2%Sparkling74.8%Sparkling72.7%Sparkling72.8%Sparkling70.8%All categories posted volume growth9M11The sparkling category continued to grow at low double digitsThe still category grew ca. 25%The tea business grew above 25%17
Net sales up by 23.1% in 9M11<strong>Turkey</strong> Net Sales<strong>Turkey</strong> Net Sales International Net Sales Consolidated Net Sales(TL in millions) (US$ in millions) (TL in millions)1,721.62,026.5332.9455.32,224.02,738.09M109M119M109M119M109M113Q11Consolidated up by 22.3% to TL 1,183.3 million<strong>Turkey</strong> up by 12.5% to TL 845.3 millionInternational up by 40.2% to US$ 201.4 million18
EBITDA up by 7.2% in 9M11<strong>Turkey</strong> Net Sales<strong>Turkey</strong> EBITDA International EBITDA Consolidated EBITDA(TL in millions) (US$ in millions) (TL in millions)319.9 315.1399.8 428.559.170.69M109M119M109M119M109M113Q11Consolidated up by 4.0% to TL 204.8 million<strong>Turkey</strong> down by 13.9% to TL 139.4 millionInternational up by 31.0% to US$ 39.1 million19
Income Statement- Consolidated(TL mn) 2009 2010 9M2010 9M2011Volume 586.5 665.4 13.5% 535.3 621.1 16.0%Net Sales 2,407.5 2,753.2 14.4% 2,224.0 2,738.0 23.1%Gross Profit 868.7 1,031.5 18.7% 852.3 1,007.7 18.2%Margin 36.1% 37.5% 38.3% 36.8%EBIT 236.5 271.8 15.0% 286.2 312.4 9.2%Margin 9.8% 9.9% 12.9% 11.4%EBIT (exc. Others) 207.6 281.4 35.5% 293.1 307.1 4.8%Margin 8.6% 10.2% 13.2% 11.2%EBITDA 368.7 435.0 18.0% 399.8 428.5 7.2%Margin 15.3% 15.8% 18.0% 15.7%EBITDA (exc.Others)350.2 444.5 26.9% 406.7 425.2 4.6%Margin 14.5% 16.1% 18.3% 15.5%Net Income 169.6 197.7 16.6% 239.3 146.3 (38.9%)Margin 7.0% 7.2% 10.8% 5.3%20
Income Statement- Geographical Breakdown<strong>Turkey</strong>(TL mn) 2009 2010 9M2010 9M2011Volume 438.9 494.4 12.6% 398.9 449.9 12.8%Net Sales 1,868.2 2,121.4 13.6% 1,721.6 2,026.5 17.7%Gross Profit 699.8 843.9 20.6% 689.8 795.4 15.3%Margin 37.5% 39.8% 40.1% 39.2%EBIT 204.6 240.3 17.4% 243.9 242.7 (0.5%)Margin 11.0% 11.3% 14.2% 12.0%EBIT (exc.Others.)178.7 234.1 31.0% 237.5 238.1 0.3%Margin 9.6% 11.0% 13.8% 11.8%EBITDA 296.6 342.5 15.5% 319.9 315.1 (1.5%)Margin 15.9% 16.1% 18.6% 15.6%EBITDA(exc.Others(275.7 336.4 22.0% 313.6 310.5 (1.0%)Margin 14.8% 15.9% 18.2% 15.3%Net Income 164.3 191.3 16.4% 216.9 100.0 (53.9%)Margin 8.8% 9.0% 12.6% 4.9%21
Income Statement- Geographical BreakdownInternational(USD mn) 2009 2010 9M2010 9M2011Volume 147.6 171.0 15.9% 136.4 171.3 25.5%Net Sales 349.9 422.8 20.8% 332.9 455.3 36.8%Gross Profit 109.0 124.8 14.5% 107.2 131.3 22.5%Margin 31.1% 29.5% 32.2% 28.8%EBIT 20.3 28.6 40.8% 34.6 43.2 24.8%Margin 5.8% 6.8% 10.4% 9.5%EBIT (exc.Others)16.8 28.9 71.6% 35.5 40.1 12.8%Margin 4.8% 6.8% 10.7% 8.8%EBITDA 47.1 69.5 47.7% 59.1 70.6 19.4%Margin 13.5% 16.4% 17.8% 15.5%EBITDA (exc.Others)47.1 69.8 48.1% 60.0 68.7 14.5%Margin 13.5% 16.5% 18.0% 15.1%Net Income 3.4 11.3 236.0% 20.9 26.9 28.9%Margin 1.0% 2.7% 6.3% 5.9%22
Financial ExpensesFinancial Income / (Expense) Breakdown 9M11 9M10(TL million)Interest income 26.2 28.5Interest expense (-) (43.5) (36.3)Foreign exchange gain / (loss) 20.0 (2.7)Realized FX gain / (loss) - Borrowings (0.3) (1.1)Unrealized FX gain / (loss) - Borrowings (128.2) 28.7Gain / (loss) on derivative transactions (0.1) (0.5)Financial Income / (Expense) Net (125.9) 16.623
Debt StructureMillion 9M11 FY10 ∆USD denominated* 633 548 15%EURO denominated* 43 43 0%TL denominated 44 294 (85%)Other (in USD terms) 39 10 288%Total Financial Debtin TL 1,391 1,246 12%Total Cash &Equivalent in TL 187 599 (69%)Net Debt in TL 1,204 647 86%Net Debt in US$ 652 418 56%MaturityDate2011 2012 2013 2014 2015 2016% of total debt 11% 2% 2% 82% 2% 1%*In original currency24
AppendixCorporate StructureManagement TeamCooler InvestmentsCountry Data<strong>Turkey</strong> AFB MarketTea Market Segments in <strong>Turkey</strong>Trade Structure in <strong>Turkey</strong><strong>Turkey</strong> Operational EfficienciesFinancialsProduct Innovations in 2010Corporate Governance
Corporate Structure<strong>Coca</strong>-<strong>Cola</strong> İcecek A.S.100.00%<strong>Coca</strong>-<strong>Cola</strong> Satış ve DağıtımA.Ş., <strong>Turkey</strong>99.96%CCI International Holland B.V.The NetherlandsMahmudiye Kaynak SuyuLtd. Şti., <strong>Turkey</strong>99.99%50.95%<strong>Coca</strong>-<strong>Cola</strong> Almaty BottlersLLP, Kazakhstan48.77%Efes Sınai Dış TicaretA.Ş., <strong>Turkey</strong>99.00%83.55%70.49%Azerbaijan <strong>Coca</strong>-<strong>Cola</strong> BottlersLtd., Azerbaijan<strong>Coca</strong>-<strong>Cola</strong> Bishkek BottlersCJSC, Kyrgyzstan16.31%29.51%Turkmenistan <strong>Coca</strong>-<strong>Cola</strong>Bottlers Ltd., Turkmenistan<strong>Coca</strong>-<strong>Cola</strong> BeveragesPakistan Ltd., Pakistan59.50%49.22%The <strong>Coca</strong>-<strong>Cola</strong> BottlingCompany of Jordan Ltd.,JordanSyrian Soft Drink Sales andDistribution L.L.C., Syria90.00%50.00%The <strong>Coca</strong>-<strong>Cola</strong> Bottling of IraqFZCO, U.A.E.100.00%60.00%SSG Investment Limited,Iraq100.00%40.00%CC Beverage Limited,Iraq26
Management Team•CEO since February 2006•Over 20 years experiencewithin The <strong>Coca</strong>-<strong>Cola</strong> System•CFO since January 2010•Over 15 years experience inbeverage businessMichael A. O’NeillN. Orhun Köstem•President, InternationalOperations since January2010•Over 20 years experiencein The <strong>Coca</strong>-<strong>Cola</strong> System•Former President of CCI<strong>Turkey</strong> Region•President, <strong>Turkey</strong> Regionsince January 2010•13 years experience inCCI•Former CFO of CCIHüseyin M. AkınBurak Başarır27
Cooler InvestmentsCooler Doors per 10,000 people<strong>Turkey</strong> Pakistan Kazakhstan Azerbaijan Kyrgyzstan Jordan Iraq Syria2007 51 - 18 7 - - 2 -2008 52 7 20 7 - - 4 -2009 54 9 21 7 - - 4 -2010 60 11 23 10 - - 5 7CCI increases its cooler doors capacity every year in every country to serve cool beverages to our consumers28
Country DataPopulation(mn) in2010% ofpopulationbelow 29yearsGDP percapita in 2010($)Per capitaconsumptionof sparklingbev. (L) in2010CCI’s marketshare insparklingbev. in 20102010Volume(mn uc)VolumeGrowth in2010<strong>Turkey</strong> 73.7 51% 10,079 44.0 69% 494 13%Pakistan 185.5 65% 1,049 11.0 29% 118 8%Kazakhstan 16.2 51% 8,326 20.9 34% 43 23%Azerbaijan 9.0 51% 5,765 27.6 56% 32 19%Iraq 31.4 68% 2,626 21.8 - 20 34%Jordan 6.4 68% 4,435 52.2 12% 12 -10%Turkmenistan 4.9 59% 3,663 26.1 - 11 85%Kyrgyzstan 5.5 58% 816 11.0 - 8 21%Syria 22.5 65% 2,892 24.1 9%* 5 -15%Tajikistan 7.7 68% 732 1.4 - - -Sources: TUIK, IMF, EIU, UN Estimate, TCCC, Nielsen *MEMRB29
<strong>Turkey</strong> AFB MarketAFB Market (exc. milk)4.9 billion ucRTD AFB Market (exc. milk)1.1 billion ucTea48%Hot Coffee2%Powder&Concentrate1%Hot Coffee2%Powder&Concentrate1%Bottled Water32%BotRTD AFB24%RTD AFB24%Sparkling Beverages46%Sparkling Beverages46%Fruit Juice&StillDrinks12%FruitDHOD25%HOD25%Other1%Ayran3%Sparkling Water 6%Other Ayran1% 3%Sparkling Water 6%Source: Canadean, 2010Hot tea category constitutes 48% of alcohol-free beverages30
Tea Market Segments in <strong>Turkey</strong>Volume2.4 bn ucValue *0.8 bn $Teapotbag3,6%Teabag1,2%Teapotbag6,6%Teabag5,3%Loose95,2%Loose88,0%Source: Nielsen, 2010Source: Nielsen, 2010Very high levels of hot tea consumption• Has the highest share of throat after tap water• 96% of Turkish people drink tea everyday• World’s highest per capita consumption• Nielsen datas are excluding on-premise consumptionchannels31
Trade Structure in <strong>Turkey</strong>Retail Volume by Channel (2010)Hypermarket2.6%Discount Store4.9%Other 2.4% Gas Station 1.8%32On Premise14.0%TraditionalGrocery 48.3%Supermarket26.0%Half of volume delivered by traditional trade channelsHighest retail coverage among all FMCG categories in <strong>Turkey</strong>*Other includes game houses, entertainment,gymnasium, travel, accomodation, transportation,education, workplace and military.Source: Company
<strong>Turkey</strong> Operational EfficienciesWater usage ratio (lt water/lt product)2.001.501.741.621.48 1.501.421.002006 2007 2008 2009 2010Annual production capacity of 978 mn unitcasesEnergy usage ratio (MJ lt of product)0.300.280.260.240.220.200.26 0.260.23 0.230.222006 2007 2008 2009 2010Annual production of more than 2 billionPET bottles33
Income Statement - Consolidated(TL mn) 2009 2010 2010 vs 2009 9M10 9M11 9M11 vs 9M10Volume (m/uc) 586.5 665.4 13.5% 535.3 621.1 16.0%Net Sales2,407.5 2,753.2 14.4% 2,224.0 2,738.0 23.1%COGS (1,538.9) (1,721.6) 11.9% (1,371.7) (1,730.3) 26.1%Gross Profit 868.7 1031.5 18.7% 852.3 1,007.7 18.2%OPEX (661.0) (750.1) 13.5% (559.2) (700.6) 25.3%Other Inc/Exp (Net) 28.8 (9.6) n.m. (6.9) 5.4 (177.5%)EBIT236.5 271.8 15.0% 286.2 312.4 9.2%EBIT (exc. other) 207.7 281.4 35.5% 293.1 307.1 4.8%Income Before Minority Int. & Tax 215.4 255.3 18.5% 302.8 186.5 (38.4%)Minority Interest 0.4 (0.7) n.m. 0.9 0.4Income Tax (46.2) (56.9) 23.2% (62.6) (39.8) 36.4%Net Income/(Loss) 169.6 197.7 16.6% 239.3 146.3 (38.9%)EBITDA 368.7 435.0 18.0% 399.8 428.5 7.2%EBITDA (exc. other)350.2 444.5 26.9% 406.7 425.2 4.6%Gross Margin 36.1% 37.5% 38.3% 36.8%EBIT Margin9.8% 9.9% 12.9% 11.4%EBIT Margin (exc. other)8.6% 10.2% 13.2% 11.2%EBITDA Margin15.3% 15.8% 18.0% 15.7%EBITDA Margin (exc. other)14.5% 16.1% 18.3% 15.5%34
Balance Sheet – 9M11/YE10(TL million)SeptemberSeptember 30, DecemberDecember 31, 2010(TL million)30, 20112011 31, 2010(unaudited) (audited) (unaudited) (audited)Cash & Cash Equivalents 175.9 491.7 ST Borrowings 178.1 627.7Investments in Securities 11.1 107.1 Trade Payables 184.5 99.3Trade Receivables andDue from Related Parties 460.7 300.0 Due to Related Parties 75.5 45.0Inventories 357.2 223.7 Other Payables 106.3 80.9Other Receivables 11.3 4.8 Provision for Corporate Tax 14.1 1.0Other Current Assets 316.8 166.6 Provision for Employee Benefits 22.5 14.4Total Current Assets 1,333.0 1,293.8 Other Liabilities 29.4 12.4Property, Plant andEquipment 1,596.7 1,203.0 Total Current Liabilities 875.0 880.6Intangible Assets(including goodwill) 579.6 459.4 LT Borrowings 1,212.9 617.9Deferred Tax Assets 6.1 2.5 Provision for Employee Benefits 33.3 35.7Other receivables andnon-current assets 45.0 55.3 Other Liabilities 0.0 3.6Total Non-currentAssets 2,227.4 1,720.2 Deferred Tax Liability 43.4 41.1TOTAL ASSETS 3,560.4 3,014.0 Total Non-Current Liabilities 1,289.6 698.4Minority Interest 21.3 17.6Shareholders Equity 1,639.0 1,417.4TOTAL LIABILITIES andSHAREHOLDER’S EQUITY 3,560.4 3,014.035
Balance Sheet – 2010/2009(TL million)AssetsDecember 31,2010December 31,2009Liabilities & EquityDecember 31,2010December 31,2009Cash & CashEquivalents491.7 544.2 ST Borrowings 627.7 903.6Investments inSecurities107.1 40.3Trade Payables andDue to Related Parties144.3 123.5Trade Rec and Duefrom Related...300.0 245.6Other Payables80.9 81.5Inventories 223.7 211.1 Other Liabilities 27.8 28.9Other Receivables 4.8 2.9 Total Current Liabilities 880.6 1,137.6Other Current Assets 166.6 141.8Total CurrentAssetsProperty, Plant andEquipmentIntangible Assets (InclGoodwill)1,293.8 1,185.91,203.0 1,190.4459.4 450.3Deferred Tax Assets 2.5 1.1Other rec and noncurrentassetsTotal Non-currentAssetsLT Borrowings 617.9 385.0Provision for Empl Benefits 35.7 28.7Other liabilities 3.6 3.6Deferred Tax Liability 41.1 38.8Total Non-currentLiabilities698.4 456.155.3 36.0 Minority Interest 17.6 16.51,720.2 1,677.7 Shareholders Equity 1,417.4 1,253.4Total Assets 3,014.0 2,863.6TOTAL LIABILITIES ANDSHAREHOLDER’SEQUITY3,014.0 2,863.636
Free Cash Flow(TL mn) 2010 2009Cash Flow From Operating ActivitiesNet Income Adj for Non-Cash Items 459.2 358.6Interest Paid (48.1) (35.1)Interest Received 38.5 25.3Taxes Paid (60.3) (22.8)Employee Termination Benefits,Vacation Pay, Mngmt Bonus(22.2) (19.3)Operating Cash Flow 367.2 306.8 19.7%Change in Working Capital (96.8) (73.4)Operating Cash Flow post Change in WC 270.4 233.3 15.9%Cash Flow Investing ActivitiesProperty, Plant and Equipment (159.6) (160.3)Free Cash Flow 110.8 73.1 51.6%37
Product Launches in 2010-<strong>Turkey</strong>Coke 3LFanta Tangerineand Blood OrangeCappy RamadanŞerbeti andLemonade CherryDamla MineraNatural - flavoredNestea Mango -PineappleDoğadan RTDNew Introductions inNRTD Tea category38
Product Launches in 2010 - InternationalPiko Pulpy PET 0.5LTropic & LemonKazakhstanPiko PulpyPET 1LOrangeKazakhstanNestea PET 1L Fanta LemonadesLemon and Peach PET 0.5,1, 1.5LKazakhstan Dushes and BuratinoKyrgyzstan, KazakhstanFanta FruityPET 2.25LCan 250ml JordanNRB 250ml<strong>Coca</strong>-<strong>Cola</strong><strong>Coca</strong>-<strong>Cola</strong> ZeroFanta OrangeSyriaCappy relaunch PET330ml, 1.5L Orange- IraqOrange, Grape andMango - JordanSpecial Productfor Ramadan CokePET 3LAzerbaijanPiko Tempo PET500ml multi-fruit &apple-peachKazakhstanCappy Sourcherry,Peach, Multifruitand 100% Orange200ml - AzerbaijanFruktime PET 1L Pear,Buratino, Lemon -Kyrgyzstan39
Corporate GovernanceResponsibilityAccountabilityFairnessTransparencyCorporate Governance rating 8.50 /10.00Code of Business Conduct andCode of Ethics10 BOD members – 1 Independent- Audit Committee- Corporate Governance Committee40
September 2011GlossaryAFB: Alcohol Free BeveragesCAGR: Compound Annual Growth RateCMB: Capital Markets Board of <strong>Turkey</strong>HOD: Home and Office delivery waterOWB: One Way BottleRTD Ready-to-Drink BeveragesUC: Unit Case (1 uc equals 5.678 liters)YTD: Year to Date<strong>Coca</strong>-<strong>Cola</strong> Icecek Investor RelationsTel: +90 216 528 4000Fax: +90 216 365 8457CCI-IR@cci.com.tr www.cci.com.tr------------------------------------Deniz Can YücelInvestor Relations ManagerTel: +90 216 528 3386deniz.yucel@cci.com.trCredit RatingForeign Currency Senior Unsecured rating and IDR‘BBB-’, Stable OutlookLocal Currency Senior Unsecured and IDR,‘BBB’, Stable Outlook(Fitch Rating, Nov. 24, 2011)Corporate Governance Rating of 8.50 (out of 10)(Saha Rating, July 1, 2011)Istanbul Stock Exchange: CCOLA.ISBloomberg: CCOLA TIReuters: CCOLA.IS