Water Scarcity and Virtual Water Trade in the ... - Ecomod Network
Water Scarcity and Virtual Water Trade in the ... - Ecomod Network
Water Scarcity and Virtual Water Trade in the ... - Ecomod Network

Create successful ePaper yourself
Turn your PDF publications into a flip-book with our unique Google optimized e-Paper software.
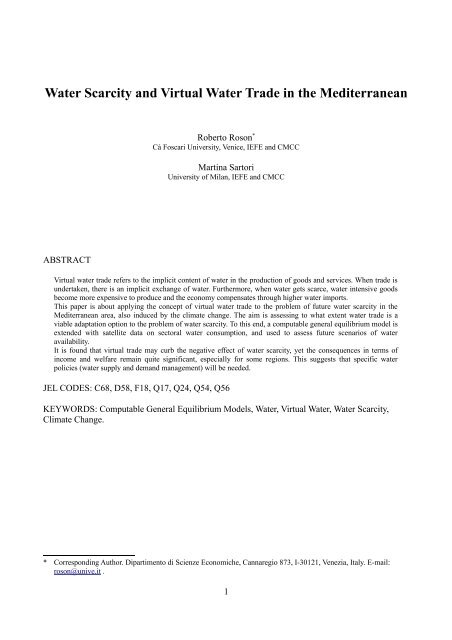
<strong>Water</strong> <strong>Scarcity</strong> <strong>and</strong> <strong>Virtual</strong> <strong>Water</strong> <strong>Trade</strong> <strong>in</strong> <strong>the</strong> MediterraneanRoberto Roson *Cà Foscari University, Venice, IEFE <strong>and</strong> CMCCMart<strong>in</strong>a SartoriUniversity of Milan, IEFE <strong>and</strong> CMCCABSTRACT<strong>Virtual</strong> water trade refers to <strong>the</strong> implicit content of water <strong>in</strong> <strong>the</strong> production of goods <strong>and</strong> services. When trade isundertaken, <strong>the</strong>re is an implicit exchange of water. Fur<strong>the</strong>rmore, when water gets scarce, water <strong>in</strong>tensive goodsbecome more expensive to produce <strong>and</strong> <strong>the</strong> economy compensates through higher water imports.This paper is about apply<strong>in</strong>g <strong>the</strong> concept of virtual water trade to <strong>the</strong> problem of future water scarcity <strong>in</strong> <strong>the</strong>Mediterranean area, also <strong>in</strong>duced by <strong>the</strong> climate change. The aim is assess<strong>in</strong>g to what extent water trade is aviable adaptation option to <strong>the</strong> problem of water scarcity. To this end, a computable general equilibrium model isextended with satellite data on sectoral water consumption, <strong>and</strong> used to assess future scenarios of wateravailability.It is found that virtual trade may curb <strong>the</strong> negative effect of water scarcity, yet <strong>the</strong> consequences <strong>in</strong> terms of<strong>in</strong>come <strong>and</strong> welfare rema<strong>in</strong> quite significant, especially for some regions. This suggests that specific waterpolicies (water supply <strong>and</strong> dem<strong>and</strong> management) will be needed.JEL CODES: C68, D58, F18, Q17, Q24, Q54, Q56KEYWORDS: Computable General Equilibrium Models, <strong>Water</strong>, <strong>Virtual</strong> <strong>Water</strong>, <strong>Water</strong> <strong>Scarcity</strong>,Climate Change.* Correspond<strong>in</strong>g Author. Dipartimento di Scienze Economiche, Cannaregio 873, I-30121, Venezia, Italy. E-mail:roson@unive.it .1
1. Introduction<strong>Water</strong> availability is a key factor <strong>in</strong> many societies, shap<strong>in</strong>g cultures, economies, history <strong>and</strong>national identity. This is especially true <strong>in</strong> <strong>the</strong> Mediterranean, where water resources are limited <strong>and</strong>very unevenly distributed over space <strong>and</strong> time.There is a grow<strong>in</strong>g concern about water resources <strong>in</strong> this region. On <strong>the</strong> dem<strong>and</strong> side, dur<strong>in</strong>g <strong>the</strong>second half of <strong>the</strong> 20th century, water dem<strong>and</strong> has <strong>in</strong>creased twofold, reach<strong>in</strong>g 280 km 3 /year(UNEP, 2006). Much of <strong>the</strong> dem<strong>and</strong> comes from agricultural activities (45% <strong>in</strong> <strong>the</strong> North, 82% <strong>in</strong>South <strong>and</strong> East), but o<strong>the</strong>r <strong>in</strong>dustries also contribute significantly (most notably, tourism) <strong>and</strong> morecompetition for water resources can be easily foreseen <strong>in</strong> <strong>the</strong> near future.On <strong>the</strong> supply side, many countries are already affected by over-exploitation of renewable waterresources (often generat<strong>in</strong>g salt-water <strong>in</strong>trusion) <strong>and</strong> exploitation of non-renewable resources(<strong>in</strong>clud<strong>in</strong>g <strong>the</strong> so-called “fossil water”). In addition, most regional climate models predict areduction <strong>in</strong> precipitation <strong>and</strong> water run-off <strong>in</strong> low-latitude regions, <strong>in</strong>clud<strong>in</strong>g <strong>the</strong> Mediterranean(although forecasts are affected by relevant uncerta<strong>in</strong>ty). Reduced precipitations are oftenassociated with droughts, desertification, <strong>in</strong>creased variability over time (which, somehowparadoxically, may give raise to floods).Much can be done through improved water management, proper water pric<strong>in</strong>g <strong>and</strong> <strong>in</strong>ternationalcooperation <strong>in</strong> <strong>the</strong> management of transboundary rivers <strong>and</strong> aquifers. It is estimated (UNEP, ibid.)that improved water dem<strong>and</strong> management would make it possible to save 25% of water dem<strong>and</strong>.Additional measures, such as <strong>the</strong> use of return water from agricultural dra<strong>in</strong>age, <strong>the</strong> reuse of treatedwastewater for irrigation, freshwater production through desal<strong>in</strong>ation of seawater or brackish water,may prove to be effective.<strong>Water</strong> pric<strong>in</strong>g is also an important issue (OECD, 2009). <strong>Water</strong> is sometimes free, under-priced, orsubsidized, especially <strong>in</strong> agriculture. Economic <strong>the</strong>ory suggests that when prices are not <strong>in</strong> l<strong>in</strong>e with<strong>the</strong> social marg<strong>in</strong>al values, resources are <strong>in</strong>efficiently allocated. On <strong>the</strong> o<strong>the</strong>r h<strong>and</strong>, <strong>in</strong>troduc<strong>in</strong>gwater pric<strong>in</strong>g is not easy <strong>and</strong> it would significantly affect <strong>the</strong> structure of regional economies <strong>and</strong>trade flows (Berritella et al., 2008). In <strong>the</strong> same ve<strong>in</strong>, transboundary rivers <strong>and</strong> aquifers (e.g., <strong>the</strong>Jordan river) are often plagued by a classic “Tragedy of <strong>the</strong> Commons” 1 , possibly br<strong>in</strong>g<strong>in</strong>g aboutsocial tensions <strong>and</strong> conflicts. Some pessimistic viewers have even envisaged future “water wars”.S<strong>in</strong>ce water is an essential production factor, especially <strong>in</strong> agriculture, its scarcity would result <strong>in</strong>higher production costs <strong>and</strong> lower productivity. This effect may operate through both market <strong>and</strong>non market mechanisms. If water is priced <strong>and</strong> its price gets higher, more production costs willbr<strong>in</strong>g about higher market prices for water <strong>in</strong>tensive products. If water is not priced, <strong>the</strong>re will belower yield per unit of conventional production factor (labour, capital, l<strong>and</strong>). In any case, this wouldbe a reduction <strong>in</strong> <strong>the</strong> supply of water-need<strong>in</strong>g goods, <strong>and</strong> <strong>the</strong> law of supply <strong>and</strong> dem<strong>and</strong> <strong>in</strong> eachmarket would push prices upward.We can <strong>the</strong>refore expect water scarcity to cause higher prices <strong>and</strong> lower production volumes forwater <strong>in</strong>tensive <strong>in</strong>dustries <strong>and</strong> for those regions which are more severely constra<strong>in</strong>ed <strong>in</strong> terms ofwater resources. In turn, this loss of competitiveness would imply a shift away from water <strong>in</strong>tensive1 “Tragedy of <strong>the</strong> Commons” refers to a situation <strong>in</strong> which one resource is collectively owned but privately exploited.S<strong>in</strong>ce users do not (fully) <strong>in</strong>ternalize <strong>the</strong> social externality generated by <strong>the</strong> private consumption, <strong>the</strong> resource isover-exploited <strong>and</strong> may eventually be depleted.2
activities <strong>in</strong> production <strong>and</strong> consumption, which ultimately saves water.How strong is this market-mediated water sav<strong>in</strong>g effect? To what extent may this effect complemento<strong>the</strong>r policies <strong>in</strong> water management <strong>and</strong> supply? To better <strong>in</strong>vestigate <strong>the</strong>se <strong>and</strong> o<strong>the</strong>r relatedquestions Allan (1993) <strong>in</strong>troduced <strong>the</strong> useful concept of “virtual water”, that is, <strong>the</strong> implicit contentof water <strong>in</strong> <strong>the</strong> production of goods <strong>and</strong> services, whereas “virtual water trade” refers to <strong>the</strong> impliedexchange of water through conventional trade (Chapaga<strong>in</strong> <strong>and</strong> Hoekstra, 2003).A large <strong>and</strong> flourish<strong>in</strong>g literature on virtual water, as well as on <strong>the</strong> related concept of water“footpr<strong>in</strong>t”, is now available (for a critical review, see Yang <strong>and</strong> Zehnder, 2007). Recently, even <strong>the</strong>National Geographic (2010) magaz<strong>in</strong>e provided a map of virtual water trade flows <strong>in</strong> <strong>the</strong> world.It may be worth to notice that <strong>the</strong> idea beh<strong>in</strong>d <strong>the</strong> virtual water concept is not restricted to water, butapplies equally well to any resource, for example carbon, so we can also discuss about “virtualcarbon” trade (Atk<strong>in</strong>son et al., 2010), that is, carbon emissions generated by foreign consumption(more often named “carbon leakage”). Assess<strong>in</strong>g <strong>the</strong> amount of carbon leakage <strong>and</strong> virtual trade isessential for <strong>the</strong> <strong>in</strong>ternational coord<strong>in</strong>ation of climate change mitigation policies. 2 Similar issuesarise <strong>in</strong> <strong>the</strong> context of water resources management.So far, however, virtual water has been primarily used as a descriptive device. Some critics po<strong>in</strong>tout that estimation of virtual water flows simply amount to convert<strong>in</strong>g actual trade flows to adifferent unit of measure, with little significance <strong>and</strong> policy usefulness. We basically agree with thiscritique, as we th<strong>in</strong>k that <strong>the</strong> virtual water concept may be more fruitfully adopted <strong>in</strong> <strong>the</strong> assessmentof counterfactual scenarios, where changes <strong>in</strong> policy or <strong>in</strong> exogenous factors are simulated(Velazquez, 2007, Galan-del-Castillo <strong>and</strong> Velazquez, 2010).To this end, this paper <strong>in</strong>novates to <strong>the</strong> virtual water literature by present<strong>in</strong>g an analysis of virtualwater trade through simulation experiments, carried out with a Computable General Equilibrium(CGE) model of <strong>the</strong> world economy. CGE models are widely used for <strong>the</strong> quantitative analysis oftrade, fiscal <strong>and</strong> o<strong>the</strong>r economic policies. They have sometimes been applied to water issues (e.g.,Dixon, 1990, Seung et al., 2000, Gomez et al., 2004, Horridge et al., 2005, Berritella et al., 2007,2008) but, to our knowledge, never <strong>in</strong> association with virtual water.Computable General Equilibrium models provide a systemic <strong>and</strong> disaggregated representation ofnational, regional <strong>and</strong> multi-regional economies. They fully account for circular <strong>in</strong>come flows,<strong>in</strong>ter-sectoral <strong>and</strong> market l<strong>in</strong>kages. Model parameters are calibrated us<strong>in</strong>g real data from socialaccount<strong>in</strong>g <strong>and</strong> <strong>in</strong>put-output matrices, whereas simulations are obta<strong>in</strong>ed by chang<strong>in</strong>g exogenousvariables under behavioral assumptions of Walrasian perfectly competitive markets.The typical output of a CGE model <strong>in</strong>cludes: changes <strong>in</strong> <strong>in</strong>dustrial prices <strong>and</strong> production volumes,changes <strong>in</strong> wages <strong>and</strong> capital returns, variations of trade patterns <strong>and</strong> consumption structure. Byl<strong>in</strong>k<strong>in</strong>g <strong>the</strong> CGE output to estimations of <strong>the</strong> virtual water content, it is <strong>the</strong>refore possible to obta<strong>in</strong>valuable <strong>in</strong>formation on <strong>the</strong> implications of a given scenario (not necessarily driven by waterpolicies or water-related variables) <strong>in</strong> terms of pressure on domestic <strong>and</strong> foreign water resources.This is <strong>the</strong> simulation strategy adopted <strong>in</strong> this work.2 For example, a much discussed issue is about <strong>the</strong> possible <strong>in</strong>troduction of “border tax adjustments” (BTA), tocompensate for <strong>the</strong> loss of competitiveness <strong>in</strong> <strong>in</strong>ternational markets of <strong>in</strong>dustries located <strong>in</strong> countries where a stricterpolicy on greenhouse gases is <strong>in</strong>troduced. The aim is avoid<strong>in</strong>g that domestic reductions of emissions would be offsetby <strong>in</strong>creases of emissions abroad.3
The paper is organized as follows. In <strong>the</strong> next section, <strong>the</strong> concept of virtual water is discussed <strong>in</strong>more detail, <strong>and</strong> some estimates of virtual water trade for Mediterranean countries are presented <strong>and</strong>exam<strong>in</strong>ed. On <strong>the</strong> basis of <strong>the</strong>se estimates, a computable general equilibrium model of <strong>the</strong> worldeconomy, specifically disaggregated for <strong>the</strong> Mediterranean, is used to quantitatively assess futurescenarios of climate change <strong>and</strong> water availability. Simulation results of this model are presented<strong>and</strong> discussed <strong>in</strong> section 3. Section 4 briefly discusses <strong>the</strong> limitations of <strong>the</strong> exercise <strong>and</strong> somedirections for future research. A f<strong>in</strong>al section provides some conclud<strong>in</strong>g remarks.2. <strong>Virtual</strong> <strong>Water</strong> <strong>Trade</strong> <strong>in</strong> <strong>the</strong> Mediterranean regionThe virtual water content of a good is def<strong>in</strong>ed as <strong>the</strong> volume of water that is actually used toproduce that product. This will depend on <strong>the</strong> production conditions, <strong>in</strong>clud<strong>in</strong>g place <strong>and</strong> time ofproduction <strong>and</strong> water use efficiency. Produc<strong>in</strong>g one kilogram of gra<strong>in</strong> <strong>in</strong> an arid country, for<strong>in</strong>stance, can require two or three times more water than produc<strong>in</strong>g <strong>the</strong> same amount <strong>in</strong> a humidcountry (Hoekstra, 2003).When a good is exported, its virtual water content is implicitly exported as well. Vice versa, whenone good is imported, <strong>the</strong> water used <strong>in</strong> its orig<strong>in</strong> country of production is virtually imported. Atrade matrix of value or quantity flows could <strong>the</strong>n be translated <strong>in</strong> terms of virtual water equivalentflows, allow<strong>in</strong>g one to see whe<strong>the</strong>r one country is a net importer or exporter of virtual water, <strong>and</strong>which are its trade partners.In <strong>in</strong>ternational economics <strong>the</strong>ory, <strong>the</strong> Hecksher-Ohl<strong>in</strong> <strong>the</strong>orem states that a country will be a netimporter <strong>in</strong> goods <strong>and</strong> services whose production is <strong>in</strong>tensive <strong>in</strong> those factors which are relativelyscarce <strong>in</strong> <strong>the</strong> nation. Conversely, a country should export <strong>in</strong> <strong>in</strong>dustries us<strong>in</strong>g significant amounts ofrelatively abundant factors. When applied to water, <strong>the</strong> Hecksher-Ohl<strong>in</strong> <strong>the</strong>orem implies that waterscarce (abundant) countries would be virtual water importers (exporters).It is important to underst<strong>and</strong> that this result is simply due to market function<strong>in</strong>g <strong>and</strong> competition. Ifmarkets do not work properly, <strong>the</strong> Hecksher-Ohl<strong>in</strong> <strong>the</strong>orem cannot be readily applied. In thisrespect, water is a very special case. In many countries, markets for water services are heavilyregulated, property rights are not or cannot be enforced, water management is poor <strong>and</strong> resourcesare over-exploited. In o<strong>the</strong>r words, water prices are kept artificially low, sometimes revers<strong>in</strong>g <strong>the</strong>Hecksher-Ohl<strong>in</strong> result: water scarce countries turn out to be virtual water exporters (<strong>and</strong> vice versa).In order to see whe<strong>the</strong>r virtual water trade <strong>in</strong> <strong>the</strong> Mediterranean is broadly consistent with <strong>the</strong>Hecksher-Ohl<strong>in</strong> <strong>the</strong>orem, <strong>and</strong> what are its general characteristics, we classify <strong>the</strong> world <strong>in</strong> 14regional economies, obta<strong>in</strong>ed through aggregation from <strong>the</strong> GTAP 7.1 database. 3 These are:Albania, Croatia, Cyprus, Egypt, France, Greece, Italy, Morocco, Spa<strong>in</strong>, Tunisia, Turkey, Rest ofEurope, Rest of Middle East <strong>and</strong> North Africa, Rest of <strong>the</strong> World.Chapaga<strong>in</strong> <strong>and</strong> Hoekstra (2004) provide estimates of total water consumption for 164 crops <strong>in</strong> 208countries. We aggregate <strong>the</strong> data to <strong>the</strong> 14 regions <strong>and</strong> 7 agricultural <strong>in</strong>dustries of <strong>the</strong> GTAP database, <strong>and</strong> we make a comparison between water consumption, by crop <strong>and</strong> region, <strong>and</strong> value ofproduction (<strong>in</strong> 2004). This allows us to create an estimate of direct water usage by unit of output (<strong>in</strong>monetary terms).The direct water usage should not be confused with <strong>the</strong> unit virtual water content, as <strong>the</strong> latter3 See: http://www.gtap.org .4
<strong>in</strong>cludes <strong>the</strong> water <strong>in</strong>directly consumed through <strong>the</strong> use of <strong>in</strong>termediate production factors.Unfortunately, much of <strong>the</strong> literature on virtual water relies on direct water consumption, or use <strong>the</strong>two concepts <strong>in</strong>consistently, with only a few exceptions (Velazquez, 2006, Dietzenbacher <strong>and</strong>Velazquez, 2007, Zhao et al., 2009). On <strong>the</strong> o<strong>the</strong>r h<strong>and</strong>, <strong>the</strong> adoption of a correct methodology for<strong>the</strong> estimation of virtual water coefficients br<strong>in</strong>gs about quite different results, both quantitatively<strong>and</strong> qualitatively. 4In order to consider <strong>in</strong>direct water consumption, let us call a ij <strong>the</strong> domestic <strong>in</strong>put-output coefficient<strong>in</strong> a square matrix A, whose dimension is <strong>the</strong> number of <strong>in</strong>dustries considered <strong>in</strong> a certa<strong>in</strong> region.The (domestic) <strong>in</strong>put-output coefficient expresses <strong>the</strong> <strong>in</strong>termediate consumption of factor i(produced by domestic <strong>in</strong>dustry i), per unit of output <strong>in</strong> <strong>in</strong>dustry j. If we call w <strong>the</strong> vector of sectoralvirtual water coefficients (virtual water consumption per unit of output, <strong>in</strong> <strong>the</strong> region) <strong>and</strong> v <strong>the</strong>correspond<strong>in</strong>g vector of direct water usage, <strong>the</strong>n <strong>the</strong> w vector can be obta<strong>in</strong>ed from <strong>the</strong> v vector, by<strong>the</strong> follow<strong>in</strong>g matrix equation: 5w=v I −A −1 (1)When <strong>the</strong> unit virtual water coefficients w are comb<strong>in</strong>ed with orig<strong>in</strong>/dest<strong>in</strong>ation matrices of tradeflows, it is possible to translate trade flows <strong>in</strong> virtual water equivalents. The sum of all virtual watertrade matrices provides an overall picture of virtual water trade. In this work, we only consider trade<strong>in</strong> agricultural products.The matrix of bilateral virtual water trade flows is presented <strong>in</strong> Appendix B (Table B1). Table 1summarizes <strong>the</strong> virtual water balance of trade (VWBT) for all regions <strong>in</strong> <strong>the</strong> set, where negative(positive) numbers mean that a country is a net exporter (importer) of virtual water. In o<strong>the</strong>r words,<strong>the</strong> VWBT estimates <strong>the</strong> amount of water saved through <strong>in</strong>ternational trade <strong>in</strong> agriculture.As we can see, all Mediterranean countries, with <strong>the</strong> exception of France <strong>and</strong> Turkey, are netimporters of virtual water through trade <strong>in</strong> agricultural products. Italy is <strong>the</strong> largest importer ofwater, but figures depend on <strong>the</strong> magnitude of trade flows <strong>and</strong>, <strong>the</strong>refore, on <strong>the</strong> size of <strong>the</strong> regionaleconomy. To highlight how much each <strong>in</strong>dividual economy depends on virtual water flows, wedivide <strong>the</strong> trade balance (VWBT) by <strong>the</strong> sum of exports <strong>and</strong> imports, 6 to get a size-neutral <strong>in</strong>dex,shown <strong>in</strong> <strong>the</strong> column VWBT-R.Accord<strong>in</strong>g to this <strong>in</strong>dex, <strong>the</strong> regions which are most dependent on virtual water imports are Cyprus,Italy, Albania <strong>and</strong> Egypt. The Rest of Europe <strong>and</strong> Middle-East / North Africa are also significantlydependent on imports. This result is not completely <strong>in</strong> l<strong>in</strong>e with expectations about wateravailability, suggest<strong>in</strong>g that <strong>in</strong> some countries water resources could be under-priced <strong>and</strong> overexploited(e.g., <strong>in</strong> Spa<strong>in</strong>, Morocco, Tunisia, Turkey).4 <strong>Virtual</strong> water coefficients, when <strong>in</strong>termediate factors are taken <strong>in</strong>to account, are always greater than <strong>the</strong>correspond<strong>in</strong>g unit direct usage coefficients. Some <strong>in</strong>dustries, hav<strong>in</strong>g relatively low direct water usage (e.g., foodprocess<strong>in</strong>g), may turn out to have high virtual water content per unit of production. Consequently, some seem<strong>in</strong>gvirtual water import<strong>in</strong>g regions could actually be exporters, or vice versa.5 If n is <strong>the</strong> number of <strong>in</strong>dustries <strong>in</strong> <strong>the</strong> region, w <strong>and</strong> v are (1 x n) row vectors, (I - A) -1 is a (n x n) Leontief <strong>in</strong>versematrix (computed us<strong>in</strong>g only domestic <strong>in</strong>termediate flows). If <strong>the</strong>re are several regions <strong>in</strong> a model, it is possible tocompute all virtual water coefficients simultaneously with a s<strong>in</strong>gle matrix equation (see <strong>the</strong> BTIO method described<strong>in</strong> Atk<strong>in</strong>son et. al., 2010).6 If M st<strong>and</strong>s for virtual water imports <strong>and</strong> X for exports, <strong>the</strong>n VWBT = M-X, VWBT-R = (M-X)/(M+X).5
VWBTVWBT-RAlbania 696 64%Croatia 413 18%Cyprus 856 70%Egypt 12780 51%France -8551 -12%Greece 2900 28%Italy 28287 54%Morocco 542 4%Spa<strong>in</strong> 8112 14%Tunisia 650 10%Turkey -1652 -8%Rest.Euro 151968 62%Rest MENA 68724 75%RoW -265725 -78%Table 1 – <strong>Virtual</strong> <strong>Water</strong> <strong>Trade</strong> Balance (Mm 3 )From <strong>the</strong> trade flows matrix (Table B1) it is also possible to compute <strong>the</strong> net virtual water exchangefor all pairs of regions. Figure 1 displays, on a map of <strong>the</strong> Mediterranean, <strong>the</strong> largest flows, <strong>and</strong><strong>the</strong>ir direction. The thickness of <strong>the</strong> arrow l<strong>in</strong>e depends on <strong>the</strong> magnitude of <strong>the</strong> flow: larger l<strong>in</strong>esare for net flows exceed<strong>in</strong>g 3G m 3 , <strong>the</strong> o<strong>the</strong>rs are associated with flows between 1G <strong>and</strong> 3G m 3 .Figure 1 – Largest net flows of virtual water trade <strong>in</strong> <strong>the</strong> MediterraneanWe can see that <strong>the</strong> most significant exchanges of virtual water are bilateral flows between <strong>the</strong>largest North-Mediterranean economies. This outcome is due to <strong>the</strong> fact that both direct <strong>and</strong> <strong>in</strong>directuse of water has been taken <strong>in</strong>to account; production of all goods <strong>and</strong> services requires water <strong>and</strong>water trade flows are correlated with gross trade volumes.6
3. Assess<strong>in</strong>g future water availability <strong>and</strong> virtual trade <strong>in</strong> a general equilibrium modelOur analysis of future water availability <strong>in</strong> <strong>the</strong> Mediterranean is based on data provided by Strzepek<strong>and</strong> Boehlert (2009), summarized, for some countries, 7 <strong>in</strong> Table 2.M.A.R. 2000 Ag. 2000 MI 2000 EFR WCI W 2050 D 2050Albania 114.2 6.8 2.5 38.1 0.0 95.3 89.4Cyprus 0.7 0.2 0.1 0.2 0.4 0.7 0.7Egypt 60.2 89.7 16.4 0.6 1.0 60.4 60.5France 138.8 9.7 37.3 42.8 0.0 120.6 114.3Italy 93.6 9.6 24.4 42.2 0.4 88.0 78.8Morocco 10.8 9.9 1.6 3.4 1.0 4.7 5.7Spa<strong>in</strong> 11.1 2.5 1.8 3.9 0.5 10.3 8.4Tunisia 3.3 3.8 0.6 0.9 1.0 3.2 4.3Turkey 131.6 26.6 9.5 42.0 0.3 99.0 129.7Table 2 – Data on water consumption <strong>and</strong> future availability (Mm 3 )The second column <strong>in</strong> <strong>the</strong> table shows, for each country, <strong>the</strong> Mean Annual Runoff of water <strong>in</strong> <strong>the</strong>year 2000. The follow<strong>in</strong>g three columns display estimates of water use for agriculture, municipal<strong>and</strong> <strong>in</strong>dustrial consumption (2000), <strong>and</strong> “environmental flow requirement”, that is, <strong>the</strong> amount ofwater which is considered to be necessary to preserve aquatic ecosystems (all from Strzepek <strong>and</strong>Boehlert, ibid.).We build an <strong>in</strong>dex of water constra<strong>in</strong>t (WCI), by consider<strong>in</strong>g <strong>the</strong> ratio of water consumption <strong>in</strong>agriculture over <strong>the</strong> net MAR after non-agricultural water use (<strong>in</strong> 2000). The WCI is equal to thisratio, unless <strong>the</strong> ratio is greater than one (<strong>in</strong> this case it is set to one) or <strong>the</strong> ratio is lower than 0.25(<strong>in</strong> this case it is set to zero):AgA=MAR−MI− EFR WCI = { 0 A0.25}A 0.25 A1(2)1 A1We build this <strong>in</strong>dex to account (admittedly, <strong>in</strong> a ra<strong>the</strong>r cursory way) how much each country isactually constra<strong>in</strong>ed by water availability. If <strong>the</strong> WCI <strong>in</strong>dex is greater than one, as it is <strong>the</strong> case forNorth African countries, it means that water use currently exceeds <strong>the</strong> MAR, possibly mean<strong>in</strong>g thatnon renewable water reservoirs are exploited. If, vice versa, <strong>the</strong> WCI is zero, it means that waterresources are abundant, <strong>and</strong> relatively m<strong>in</strong>or variations <strong>in</strong> water availability would have no effectson <strong>the</strong> economy. The <strong>in</strong>termediate case (0.25 < WCI < 1) is for countries that can be considered“partially water constra<strong>in</strong>ed”. Although <strong>the</strong> MAR exceeds total water use <strong>in</strong> 2000, we cannotexclude (s<strong>in</strong>ce data cover <strong>the</strong> whole region <strong>and</strong> one year) that water scarcity may be a problem <strong>in</strong>some areas <strong>and</strong> <strong>in</strong> some periods of <strong>the</strong> year.The rema<strong>in</strong><strong>in</strong>g two columns show estimates of future mean annual runoff, for <strong>the</strong> year 2050,7 Data for Croatia <strong>and</strong> Greece are miss<strong>in</strong>g <strong>in</strong> <strong>the</strong> orig<strong>in</strong>al data set. Whenever appropriate, we applied data of countrieshav<strong>in</strong>g similar climatic characteristics (Italy <strong>and</strong> Spa<strong>in</strong>, respectively), expressed <strong>in</strong> percentage changes, so as tomake variables <strong>in</strong>dependent of <strong>the</strong> country size.7
generated by two global climate models (from CSIRO <strong>and</strong> NCAR), comb<strong>in</strong>ed with <strong>the</strong> CLIRUN IIhydrologic model (Strezepek et al., 2008). The two climate scenarios are labeled “W” (NCAR) <strong>and</strong>“D” (CSIRO), as <strong>the</strong> former predicts a relatively wetter climate, whereas o<strong>the</strong>r one is relativelydrier. 8 We can see that <strong>the</strong> climate models predict a reduction of precipitations <strong>and</strong> run-off for mostMediterranean countries, with dramatic effects for Morocco, whereas some o<strong>the</strong>r countries are notsignificantly affected. In addition to <strong>the</strong> W <strong>and</strong> D cases, we consider an <strong>in</strong>termediate one (labeled“M”), which is a simple average of W <strong>and</strong> D estimates. This latter scenario is <strong>in</strong>troduced to providea central value <strong>and</strong> a sensitivity analysis for our results.We use <strong>the</strong> <strong>in</strong>formation above to simulate <strong>the</strong> climate change effects on agricultural productivity<strong>and</strong> virtual water <strong>in</strong> a general equilibrium model, whose structure is briefly described <strong>in</strong> AppendixA. We consider <strong>the</strong> 2000-2050 percentage change <strong>in</strong> <strong>the</strong> MAR for <strong>the</strong> three scenarios (W, M, D),<strong>and</strong> we assume that <strong>the</strong> multifactor productivity <strong>in</strong> all agricultural sectors varies by <strong>the</strong> samechange, multiplied by <strong>the</strong> WCI. This means that, if a country is already water constra<strong>in</strong>ed, anyreduction <strong>in</strong> surface water availability directly translates <strong>in</strong>to lower yield for all crops. Conversely,if <strong>the</strong> country is only partially constra<strong>in</strong>ed, only some of <strong>the</strong> water change will be felt through <strong>the</strong>productivity impact.Clearly, this work<strong>in</strong>g assumption is a quite strong one. The productivity response to water stress <strong>and</strong>chang<strong>in</strong>g climate conditions depends on <strong>the</strong> specific crop, as well as on a variety of o<strong>the</strong>r factors(e.g., irrigation mode). Unfortunately, no <strong>in</strong>formation is currently available on this aspect,particularly at <strong>the</strong> time <strong>and</strong> space scale of our model, 9 although research <strong>in</strong> this area is <strong>in</strong> progress. 10S<strong>in</strong>ce <strong>the</strong> exogenous shock is <strong>in</strong>troduced <strong>in</strong> <strong>the</strong> general equilibrium model as a shift <strong>in</strong> multifactorproductivity for agriculture, we can expect that <strong>the</strong> new equilibrium will be characterized by loss(ga<strong>in</strong>) of competitiveness for those <strong>in</strong>dustries <strong>and</strong> regions which have high (low) water <strong>in</strong>tensity,whenever water availability is assumed to be lower <strong>in</strong> <strong>the</strong> future. Follow<strong>in</strong>g <strong>the</strong> basic Samuelson-Heckscher-Ohl<strong>in</strong> logic, which can be applied here because <strong>the</strong> CGE model is based on neo-classicassumptions, countries will tend to specialize <strong>in</strong> those productions which are <strong>in</strong>tensive <strong>in</strong> <strong>the</strong> factorswhich are relatively abundant, <strong>in</strong>clud<strong>in</strong>g water. <strong>Trade</strong> flows will adjust accord<strong>in</strong>gly, with morevirtual water flow<strong>in</strong>g towards water-stressed regions.Before exam<strong>in</strong><strong>in</strong>g <strong>the</strong> simulation results <strong>in</strong> terms of virtual water, let us consider some aggregatemacroeconomic <strong>in</strong>dicators, account<strong>in</strong>g for <strong>the</strong> overall impact of <strong>the</strong> vary<strong>in</strong>g water availability onnational <strong>in</strong>come <strong>and</strong> welfare. Table 3 presents simulation results for <strong>the</strong> Gross Domestic Product(GDP) <strong>and</strong> <strong>the</strong> Equivalent Variation (EV). The latter is a measure of welfare, amount<strong>in</strong>g to <strong>the</strong>hypo<strong>the</strong>tical variation <strong>in</strong> <strong>in</strong>come (at constant prices) which would have generated <strong>the</strong> same impact<strong>in</strong> terms of consumer utility of <strong>the</strong> exogenous shocks considered <strong>in</strong> <strong>the</strong> simulations.8 This holds globally, not necessarily at <strong>the</strong> regional level.9 The general equilibrium model considers aggregated agriculture <strong>in</strong>dustries (several crops), with national or largerregions (different climatic zones), at a yearly scale (different vegetation periods).10 For example, improv<strong>in</strong>g aggregate yield response estimates is one objective of <strong>the</strong> European research projectWASSERMed (http://www.wassermed.eu).8
var. GDP %EV(M US$)W M D W M DAlbania -0.03 -0.04 -0.06 -9 -13 -17Croatia -0.28 -0.51 -0.74 -108 -192 -276Cyprus -0.23 -0.13 -0.04 -35 -23 -12Egypt 0.1 0.11 0.13 162 171 181France -0.01 -0.01 -0.01 -522 -623 -723Greece -0.64 -1.32 -1.99 -1,388 -2,816 -4,244Italy -0.2 -0.34 -0.49 -3,450 -5,830 -8,210Morocco -15.7 -14.4 -13.1 -7,529 -6,891 -6,253Spa<strong>in</strong> -0.53 -1.07 -1.61 -5,215 -10,559 -15,903Tunisia -1.02 2.81 6.63 -262 817 1,897Turkey -1.67 -0.88 -0.1 -4,684 -2,443 -203Rest.Euro -0.22 -0.22 -0.22 -18,515 -18,816 -19,117Rest MENA -0.74 -0.74 -0.74 -5,485 -5,458 -5,431RoW 0.34 0.34 0.34 86,122 86,142 86,16Table 3 – Simulation results: macroeconomic <strong>in</strong>dicatorsMost climate models predict a reduction of water availability <strong>in</strong> <strong>the</strong> Mediterranean, with negativeconsequences <strong>in</strong> terms of national <strong>in</strong>come <strong>and</strong> welfare. The loss depends on <strong>the</strong> amount of reductionof water resources, but also on <strong>the</strong> share of agricultural activities <strong>in</strong> <strong>the</strong> economy. There is a specialcase here, where <strong>the</strong> model predicts a dramatic fall of about 14.4% of <strong>the</strong> GDP <strong>in</strong> Morocco, whichis already water constra<strong>in</strong>ed <strong>and</strong> it is supposed to face a significant reduction of precipitations <strong>and</strong>run-off. Tunisia, ano<strong>the</strong>r water-constra<strong>in</strong>ed country, may ga<strong>in</strong> under <strong>the</strong> D scenario. Significantreductions of GDP <strong>and</strong> welfare are estimated for Spa<strong>in</strong> <strong>and</strong> Greece. Only one country gets (m<strong>in</strong>or)benefits <strong>in</strong> all sett<strong>in</strong>gs: Egypt. This is not because of an <strong>in</strong>crease <strong>in</strong> water resources (which arebasically unchanged) but because of improvements <strong>in</strong> relative competitiveness vis-à-vis its trad<strong>in</strong>gpartners <strong>and</strong> competitors (which are mostly neighbor<strong>in</strong>g countries). 11Table 4 shows <strong>the</strong> <strong>in</strong>crease <strong>in</strong> virtual water imports, by country. In o<strong>the</strong>r words, this is a measure ofwater sav<strong>in</strong>gs obta<strong>in</strong>ed through trade <strong>in</strong> agricultural goods. Of course, those countries which areexperienc<strong>in</strong>g larger reductions <strong>in</strong> agricultural productivity, <strong>in</strong>duced by water shortage, are also <strong>the</strong>ones which are gett<strong>in</strong>g more virtual water from abroad. Morocco, for example, virtually importssome additional 16787 Mm 3 of water <strong>in</strong> <strong>the</strong> M scenario. 12There is, of course, a relationship between reductions of productivity <strong>in</strong> agriculture <strong>and</strong> virtualwater imports. Figure 2 plots on a diagram <strong>the</strong> pairs (variations <strong>in</strong> productivity, additional netimports of virtual water – relative to trade volume), for each country. It also plots some o<strong>the</strong>r po<strong>in</strong>ts,obta<strong>in</strong>ed through a simple l<strong>in</strong>ear <strong>in</strong>terpolation. It is found that, on average, a reduction of 1% <strong>in</strong>agricultural productivity <strong>in</strong> some Mediterranean country is associated with additional net virtualwater imports, which are 2.19% of <strong>the</strong> sum of basel<strong>in</strong>e virtual water imports <strong>and</strong> exports. This11 For example, if agricultural productivity <strong>in</strong> Egypt is unchanged, but o<strong>the</strong>r countries <strong>in</strong> Middle-East <strong>and</strong> North Africaface a water shortage problem, agricultural products from Sou<strong>the</strong>rn Mediterranean become more expensive, butEgyptian products partly replace those from o<strong>the</strong>r countries <strong>in</strong> <strong>in</strong>ternational trade.12 We are implicitly assum<strong>in</strong>g that <strong>the</strong>re is enough water <strong>in</strong> <strong>the</strong> export<strong>in</strong>g countries to accommodate <strong>the</strong> additionalforeign dem<strong>and</strong>.9
amounts to 1277 Mm 3 of water <strong>in</strong> Spa<strong>in</strong>, 1158 <strong>in</strong> Italy, 547 <strong>in</strong> Egypt, 437 <strong>in</strong> Turkey, 326 <strong>in</strong>Morocco, 226 <strong>in</strong> Greece, 145 <strong>in</strong> Tunisia.W M DAlbania 42 44 46Croatia 185 286 388Cyprus 71 60 49Egypt 721 697 668France -1818 -1783 -1747Greece 912 1687 2462Italy 2877 4596 6315Morocco 18282 16787 15292Spa<strong>in</strong> 3867 8169 12472Tunisia 882 -2062 -5005Turkey 4565 2547 528Rest.Euro 18134 18191 18248Rest MENA 20003 20145 20287RoW -68723 -69365 -70002Table 4 – Increases <strong>in</strong> VW Imports (millions of m 3 )Figure 2 – <strong>Virtual</strong> <strong>Water</strong> / Productivity relationshipHow effective is <strong>the</strong> virtual water mechanism <strong>in</strong> curb<strong>in</strong>g <strong>the</strong> effects of water scarcity? Generallyspeak<strong>in</strong>g, we could say that its effectiveness is related to <strong>the</strong> degree of flexibility <strong>in</strong> <strong>the</strong> economicsystem, that is, how easy it may be substitut<strong>in</strong>g factors <strong>in</strong> production processes, consumption goods,or orig<strong>in</strong> of imported products.To underst<strong>and</strong> how much of <strong>the</strong> negative productivity shock can be absorbed through <strong>the</strong> virtual10
water trade, we conduct an additional simulation experiment. We run <strong>the</strong> general equilibrium modelunder <strong>the</strong> “middle” scenario M, but this time we constra<strong>in</strong> one country (Spa<strong>in</strong>) not to <strong>in</strong>crease itsimports (or exports) of agriculture goods, <strong>the</strong>reby not <strong>in</strong>creas<strong>in</strong>g virtual water imports (or exports). 13By compar<strong>in</strong>g <strong>the</strong> results with those <strong>in</strong> <strong>the</strong> previous simulation, it is possible to assess how costlymay be (for Spa<strong>in</strong> <strong>and</strong> its trad<strong>in</strong>g partners) not to have virtual water trade. Results <strong>in</strong> terms of GDP<strong>and</strong> EV are reported <strong>in</strong> Table 5, toge<strong>the</strong>r with differences with respect to <strong>the</strong> unconstra<strong>in</strong>ed case.var. GDP %EV(M US$)M Difference M DifferenceAlbania -0.05 -0.01 -13 0Croatia -0.51 0 -193 -1Cyprus -0.13 0 -24 0Egypt 0.11 0 171 0France -0.01 0 -713 -90Greece -1.32 0 -2,813 3Italy -0.34 0 -5,799 31Morocco -14.45 -0.05 -6,891 0Spa<strong>in</strong> -1.34 -0.27 -13,099 -2,540Tunisia 2.79 -0.02 782 -35Turkey -0.89 -0.01 -2,439 5Rest.Euro -0.22 0 -18,748 68Rest MENA -0.74 0 -5,465 -7RoW 0.34 0 85,895 -247Table 5 – Macroeconomic <strong>in</strong>dicators for <strong>the</strong> M-Spa<strong>in</strong> constra<strong>in</strong>ed simulationWe can see that impos<strong>in</strong>g a “no virtual water” constra<strong>in</strong>t for Spa<strong>in</strong> reduces GDP <strong>and</strong> EV not onlyfor Spa<strong>in</strong>, but also for all its trad<strong>in</strong>g partners. In particular, Spanish GDP is reduced by an additional-0.27%. The welfare impact is equivalent to a reduction of 2,540 millions of US$ for Spa<strong>in</strong>, <strong>and</strong> to2,813 millions US$ for <strong>the</strong> whole world. This may be considered as <strong>the</strong> cost of <strong>the</strong> virtual waterconstra<strong>in</strong>t or, equivalently, <strong>the</strong> global value of Spanish virtual water trade.The volume of virtual water trade depends on how easily it may be to substitute domesticproduction with imports, <strong>and</strong> imports sources among <strong>the</strong>mselves. In general equilibrium modelslike <strong>the</strong> one we are us<strong>in</strong>g <strong>in</strong> this simulation exercise, it is customary to assume that goods with<strong>in</strong> <strong>the</strong>same sector, but produced <strong>in</strong> different places, are imperfect substitutes. 14 When relative priceschange, so does <strong>the</strong> import pattern, where <strong>the</strong> sensitivity of import shares to relative prices isdeterm<strong>in</strong>ed by exogenously given elasticity of substitution parameters. 15Table 6 shows how results would change, aga<strong>in</strong> only for <strong>the</strong> M scenario, when elasticities of13 This was done by keep<strong>in</strong>g exogenously fixed at <strong>the</strong> basel<strong>in</strong>e level those trade flows of agricultural goods, <strong>in</strong>volv<strong>in</strong>gSpa<strong>in</strong>, which were <strong>in</strong>creas<strong>in</strong>g under <strong>the</strong> M base simulation.14 This is called “Arm<strong>in</strong>gton assumption”. It accounts for product heterogeneity <strong>in</strong> large aggregates, by which, forexample, Tunisian agricultural goods are <strong>in</strong>deed different products than Italian agricultural goods.15 In models based on <strong>the</strong> st<strong>and</strong>ard GTAP frameworks, <strong>the</strong>re is a two levels process. First, domestic products aresubstituted (<strong>in</strong> production <strong>and</strong> consumption) with an import composite. Second, with<strong>in</strong> <strong>the</strong> import composite, <strong>the</strong>reis substitution among alternative foreign supplies.11
substitution for all agricultural products are reduced by 50%. 16M M-low variation relative var.Albania 44 24 -20 -45%Croatia 286 182 -104 -36%Cyprus 60 32 -28 -46%Egypt 697 411 -286 -41%France -1783 -1386 397 -22%Greece 1687 951 -736 -44%Italy 4596 2871 -1.725 -38%Morocco 16787 10140 -6.647 -40%Spa<strong>in</strong> 8169 4838 -3.331 -41%Tunisia -2062 -1179 882 -43%Turkey 2547 1476 -1.071 -42%Rest.Euro 18191 10166 -8.025 -44%Rest MENA 20145 11399 -8.745 -43%RoW -69365 -39925 29.439 -42%Table 6 – Increases <strong>in</strong> VW Imports with reduced elasticities (millions of m 3 )As expected, countries which were import<strong>in</strong>g virtual water now import much less, whereas virtualwater exporters now export less. The last column of Table 6 show relative variations, that is <strong>the</strong>percentage change <strong>in</strong> virtual water imports relative to <strong>the</strong> percentage change <strong>in</strong> substitutionelasticities (here -50%). Results are fairly homogeneous: halv<strong>in</strong>g <strong>the</strong> substitution elasticities impliesreduc<strong>in</strong>g virtual water imports of about 40%.S<strong>in</strong>ce <strong>the</strong> volume of virtual water trade depends on <strong>the</strong> elasticities of substitution, one may wonderwhat determ<strong>in</strong>es <strong>the</strong> value for <strong>the</strong>se parameters, <strong>and</strong> what could make <strong>the</strong>m change. In general,elasticities of substitution tell us how easy <strong>the</strong> substitution process may be for consumers <strong>and</strong> firms.Elasticities will be high (<strong>and</strong> <strong>the</strong> virtual water trade mechanism more effective) when goodsproduced <strong>in</strong> different locations are perceived as similar, <strong>in</strong> <strong>the</strong> sense that <strong>the</strong>y have similar effectson production processes, or on consumer's utility.Reduc<strong>in</strong>g transportation costs or o<strong>the</strong>r barriers to trade would also <strong>in</strong>crease virtual water trade, ofcourse. However, only by <strong>in</strong>creas<strong>in</strong>g elasticities of substitution <strong>in</strong> <strong>the</strong> model we can make <strong>the</strong>economy more reactive (<strong>in</strong> terms of virtual water trade) to exogenous shocks.4. CaveatsIn this paper we presented a procedure for analyz<strong>in</strong>g <strong>the</strong> virtual water trade response to a possiblewater scarcity scenario <strong>in</strong> <strong>the</strong> Mediterranean. Results, however, are affected by uncerta<strong>in</strong>ty <strong>and</strong> anumber of weaknesses. Future research will address some of <strong>the</strong>se po<strong>in</strong>ts.First, at <strong>the</strong> present time, global climate models do not appear to provide reliable, consistent <strong>and</strong>robust estimates at <strong>the</strong> regional level, especially for variables different from temperature, like16 This is simply to test how sensitive <strong>the</strong> results are to different values for <strong>the</strong> elasticities of substitution.12
precipitations. For example, models used <strong>in</strong> this study forecast a strong decrease of wateravailability <strong>in</strong> Morocco <strong>and</strong> some <strong>in</strong>crease <strong>in</strong> Tunisia, whereas different climate model providedifferent scenarios.In this study, we focused on variations <strong>in</strong> <strong>the</strong> Mean Annual Runoff, but a more correct estimate ofwater availability should take <strong>in</strong>to account groundwater <strong>and</strong> non-conventional water supply (e.g.,recycl<strong>in</strong>g, desal<strong>in</strong>ation). Fur<strong>the</strong>rmore, we have not addressed <strong>the</strong> issue of future variations <strong>in</strong> nonagriculturalwater uses. These appears to be problematic, especially for sou<strong>the</strong>rn Mediterraneancountries, where demographic <strong>and</strong> urbanization trends cannot be disregarded.F<strong>in</strong>ally, <strong>in</strong> our simulations we assumed a constant marg<strong>in</strong>al productivity of water, rul<strong>in</strong>g out anysubstitution possibility with o<strong>the</strong>r factors. Actually, variations <strong>in</strong> water availability may have a verydifferentiated impact, depend<strong>in</strong>g on <strong>the</strong> type of crop <strong>and</strong> on specific conditions. A number ofagronomic studies are available, analyz<strong>in</strong>g <strong>the</strong> relationship between volume of irrigated water <strong>and</strong>crop yield, but <strong>the</strong> ma<strong>in</strong> problem <strong>in</strong> this context is adapt<strong>in</strong>g <strong>the</strong>se estimates for models <strong>in</strong> whichheterogeneous agricultural products are considered with<strong>in</strong> <strong>the</strong> same sector, <strong>in</strong>to a broad region <strong>and</strong>at yearly scale.Address<strong>in</strong>g <strong>the</strong> po<strong>in</strong>ts above will not be easy, as it will require a strong <strong>in</strong>terdiscipl<strong>in</strong>ary approach<strong>and</strong> cooperation. On <strong>the</strong> o<strong>the</strong>r h<strong>and</strong>, it is important to underst<strong>and</strong> that <strong>the</strong> work is <strong>in</strong>novative, s<strong>in</strong>cevery few studies have tackled <strong>the</strong> issue of macroeconomic <strong>and</strong> systemwide consequences of waterscarcity. Most studies consider, as a geographical unit, <strong>the</strong> hydrological bas<strong>in</strong>, typically assum<strong>in</strong>g asgiven climate conditions <strong>and</strong> a number of socio-economic factors, like water dem<strong>and</strong>. To get an<strong>in</strong>tegrated assessment of water resources management, different models with different scales needto be <strong>in</strong>terfaced, for example by us<strong>in</strong>g <strong>the</strong> hydrological bas<strong>in</strong> (even across countries) as a unit toallocate water flows, match<strong>in</strong>g <strong>the</strong>m with adm<strong>in</strong>istrative boundaries.5. Conclud<strong>in</strong>g remarks<strong>Virtual</strong> water trade is noth<strong>in</strong>g new. Any time <strong>the</strong>re is trade <strong>in</strong> goods, whose production <strong>in</strong>volvessome consumption of water, we can say <strong>the</strong>re is a virtual water exchange. What is <strong>in</strong>terest<strong>in</strong>g to seeis how effective is this, autonomous, market driven adjustment mechanism <strong>in</strong> curb<strong>in</strong>g <strong>the</strong> negativeimpact of water scarcity, particularly <strong>in</strong> relation to climate change.Climate change is expected to alter <strong>the</strong> precipitations pattern, <strong>and</strong> consequently <strong>the</strong> availability ofsurface <strong>and</strong> ground water. <strong>Water</strong> availability will <strong>in</strong>crease <strong>in</strong> some countries, which are oftenalready water abundant, whereas it will decrease <strong>in</strong> some o<strong>the</strong>r regions, most notably <strong>in</strong> <strong>the</strong>Mediterranean. <strong>Water</strong> scarcity translates <strong>in</strong>to higher prices for water <strong>in</strong>tensive goods <strong>and</strong> services,<strong>the</strong>reby reduc<strong>in</strong>g exports <strong>and</strong> <strong>in</strong>creas<strong>in</strong>g imports, which can be <strong>in</strong>terpreted as implicit net imports ofwater.This paper is, to our knowledge, <strong>the</strong> first one <strong>in</strong> <strong>the</strong> literature on virtual water trade to assessscenarios of future water availability by means of CGE simulations. Our results suggest that <strong>the</strong>virtual water mechanism can help <strong>in</strong> reduc<strong>in</strong>g <strong>the</strong> impact of water scarcity, but it can only do thatmarg<strong>in</strong>ally. In o<strong>the</strong>r words, virtual water trade alone cannot solve <strong>the</strong> problem. Public policies are<strong>the</strong>refore needed to adjust <strong>the</strong> exist<strong>in</strong>g <strong>in</strong>frastructure <strong>and</strong> to better manage water dem<strong>and</strong>.The effectiveness of virtual water trade is related to <strong>the</strong> degree of flexibility with<strong>in</strong> <strong>the</strong> regionaleconomic systems. More flexible production processes, more globalization <strong>and</strong> <strong>in</strong>tegration, lower13
transport costs <strong>and</strong> o<strong>the</strong>r barriers to trade, <strong>the</strong>y would all contribute <strong>in</strong> mak<strong>in</strong>g economic systemsmore resilient to outside shocks, <strong>in</strong>clud<strong>in</strong>g those related to water scarcity <strong>and</strong> agricultureproductivity.AcknowledgmentsThis study has been partly funded <strong>and</strong> realized <strong>in</strong> <strong>the</strong> context of <strong>the</strong> EU FP7 project WASSERMed (Grant agreementnumber 244255, http://www.wassermed.eu).Comments by Holger Hoff, Simone Mereu, Es<strong>the</strong>r Velasquez, three anonyous referees, participants of <strong>the</strong> firstWASSERMed workshop (INAT, Tunis, June 2010) <strong>and</strong> <strong>the</strong> XII Global <strong>Trade</strong> Analysis conference (Penang, Malaysia,June 2010) are gratefully acknowledged. The usual disclaimer applies.14
ReferencesAllan, J.A. (1993) ‘Fortunately <strong>the</strong>re are substitutes for water o<strong>the</strong>rwise our hydro-political futureswould be impossible’ In: ODA, Priorities for water resources allocation <strong>and</strong> management,ODA, London, pp. 13-26.Atk<strong>in</strong>son, G., Hamilton, K., Ruta, G. <strong>and</strong> D. van der Mensbrugghe (2010), <strong>Trade</strong> <strong>in</strong> ‘<strong>Virtual</strong>Carbon’ - Empirical Results <strong>and</strong> Implications for Policy, Policy Research Work<strong>in</strong>g Paper5194, The World Bank, Wash<strong>in</strong>gton, D.C.Berrittella, M., Hoekstra , A.Y., K.Rehdanz, R.Roson <strong>and</strong> R.S.J. Tol (2007) “The Economic Impactof Restricted <strong>Water</strong> Supply: a Computable General Equilibrium Analysis”, <strong>Water</strong> Research,vol. 41, pp.1799-1813.Berrittella, M., K.Rehdanz, R.Roson <strong>and</strong> R.S.J. Tol (2008), “The Economic Impact of <strong>Water</strong> Taxes:a Computable General Equilibrium Analysis with an International Data Set”, <strong>Water</strong> Policy,vol.10(3), pp. 259-271.Brockmeier, M. (2001), A Graphical Exposition of <strong>the</strong> GTAP Model, GTAP Technical Paper No. 8,Global <strong>Trade</strong> Analysis Project (http://www.gtap.org).Chapaga<strong>in</strong>, A.K. <strong>and</strong> A.Y. Hoekstra (2003) “<strong>Virtual</strong> water trade: A quantification of virtual waterflows between nations <strong>in</strong> relation to <strong>in</strong>ternational trade of livestock <strong>and</strong> livestock products”,<strong>in</strong>: A.Y. Hoekstra (ed.), <strong>Virtual</strong> water trade, Proceed<strong>in</strong>gs of <strong>the</strong> International Expert Meet<strong>in</strong>gon <strong>Virtual</strong> <strong>Water</strong> <strong>Trade</strong>, Value of <strong>Water</strong> Research Report Series No. 12, UNESCO-IHE Delft.Chapaga<strong>in</strong>, A.K. <strong>and</strong> A.Y. Hoekstra (2004), <strong>Water</strong> Footpr<strong>in</strong>ts of Nations, Volume 2: Appendices,Value of <strong>Water</strong> Research Report Series No. 16, UNESCO-IHE Delft.Dietzenbacher, E. <strong>and</strong> E. Velazquez (2007), “Analys<strong>in</strong>g Andalusian <strong>Virtual</strong> <strong>Water</strong> <strong>Trade</strong> <strong>in</strong> anInput–Output Framework”, Regional Studies, Vol. 41.2, pp.185–196.Dixon, P.B. (1990), “A general equilibrium approach to public utility pric<strong>in</strong>g: determ<strong>in</strong><strong>in</strong>g prices fora water authority”, Journal of Policy Modell<strong>in</strong>g, vol.12 (4), 745-767.Galan-del-Castillo, E. <strong>and</strong> E. Velazquez (2010), “From water to energy: The virtual water content<strong>and</strong> water footpr<strong>in</strong>t of biofuel consumption <strong>in</strong> Spa<strong>in</strong>”, Energy Policy, vol.38, pp.1345–1352.Gòmez, C.M., Tirado, D., <strong>and</strong> J.Rey-Maquieira, (2004), “<strong>Water</strong> exchange versus water work:<strong>in</strong>sights from a computable general equilibrium model for <strong>the</strong> Balearic Isl<strong>and</strong>s”, <strong>Water</strong>Resources Research, vol.42.Hertel, T. W. <strong>and</strong> M.Tsigas (1997), “Structure of GTAP”, <strong>in</strong> Hertel, T. W. (ed.), Global <strong>Trade</strong>Analysis: Model<strong>in</strong>g <strong>and</strong> Applications, Cambridge University Press, New York.Hoekstra, A.Y. (2003), “<strong>Virtual</strong> <strong>Water</strong>: an Introduction”, <strong>in</strong>: A.Y. Hoekstra (ed.), <strong>Virtual</strong> watertrade, Proceed<strong>in</strong>gs of <strong>the</strong> International Expert Meet<strong>in</strong>g on <strong>Virtual</strong> <strong>Water</strong> <strong>Trade</strong>, Value of<strong>Water</strong> Research Report Series No. 12, IHE Delft.Horridge, M., Madden, J., <strong>and</strong> G.Wittwer (2005), “The impact of <strong>the</strong> 2002–2003 drought onAustralia”, Journal of Policy Model<strong>in</strong>g, vol.27, pp.285–308.National Geographic (2010), <strong>Water</strong> – our thirsty world, Special Issue (US Edition), April 2010,National Geographic Society, Wash<strong>in</strong>gton D.C.OECD (2009), Manag<strong>in</strong>g <strong>Water</strong> for All. An OECD Perspective on Pric<strong>in</strong>g <strong>and</strong> F<strong>in</strong>anc<strong>in</strong>g,Organisation for Economic Cooperation <strong>and</strong> Development, Paris.Seung, C.K., Harris, T.R., Egl<strong>in</strong>, J.E. <strong>and</strong> NR. Netusil (2000) “Impacts of water reallocation: a15
comb<strong>in</strong>ed computable general equilibrium <strong>and</strong> recreation dem<strong>and</strong> model approach”, Annalsof Regional Science, vol.34, pp.473–487.Strzepek, K., R. Balaji, H. Rajaram <strong>and</strong> J. Strzepek (2008), A <strong>Water</strong> Balance Model for ClimateImpact Analysis of Runoff with emphasis on Extreme Events, Mimeo.Strzepek, K. <strong>and</strong> B. Boehlert (2009), Competition for <strong>Water</strong> for <strong>the</strong> Food System, Mimeo.UNEP – Plan Bleu (2006), Fac<strong>in</strong>g water stress <strong>and</strong> shortage <strong>in</strong> <strong>the</strong> Mediterranean, Blue Plan Notesn.4, October 2006.Velazquez, E. (2006), “An <strong>in</strong>put–output model of water consumption: Analys<strong>in</strong>g <strong>in</strong>tersectoral waterrelationships <strong>in</strong> Andalusia”, Ecological Economics, vol.56, pp.226-240.Velazquez, E. (2007), “<strong>Water</strong> trade <strong>in</strong> Andalusia. <strong>Virtual</strong> water: An alternative way to manage wateruse”, Ecological Economics, vol.63, pp.201-208.Yang, H., <strong>and</strong> A. Zehnder (2007), “<strong>Virtual</strong> water’’: An unfold<strong>in</strong>g concept <strong>in</strong> <strong>in</strong>tegrated waterresources management, <strong>Water</strong> Resources Research, vol.43.Zhao, X., Chen, B. <strong>and</strong> Z.F. Yang (2009), “National water footpr<strong>in</strong>t <strong>in</strong> an <strong>in</strong>put–output framework—A case study of Ch<strong>in</strong>a 2002”, Ecological Modell<strong>in</strong>g, vol.220, pp.245-253.16
Appendix AA brief description of <strong>the</strong> GTAP modelThe Global <strong>Trade</strong> Analysis Project (GTAP) is an <strong>in</strong>ternational network which builds, updates <strong>and</strong>distributes a comprehensive <strong>and</strong> detailed data base of trade transactions among different <strong>in</strong>dustries<strong>and</strong> regions <strong>in</strong> <strong>the</strong> world, framed as a Social Account<strong>in</strong>g Matrix (SAM).The SAM is typically used to calibrate parameters for a Computable General Equilibrium (CGE)model, <strong>and</strong> <strong>the</strong> GTAP data base is accompanied by a relatively st<strong>and</strong>ard CGE model <strong>and</strong> itssoftware. The model structure is quite complex <strong>and</strong> it is fully described <strong>in</strong> Hertel <strong>and</strong> Tsigas (1997).We only summarize here <strong>the</strong> mean<strong>in</strong>g of <strong>the</strong> ma<strong>in</strong> groups of equations, <strong>and</strong> show <strong>in</strong> Figure A1 agraphical representation of <strong>in</strong>come flows <strong>in</strong> <strong>the</strong> model (from Brockmeier, 2001).Figure A1 – Income flows <strong>in</strong> <strong>the</strong> GTAP ModelEquation <strong>and</strong> identities <strong>in</strong> <strong>the</strong> model <strong>in</strong>clude <strong>the</strong> follow<strong>in</strong>g conditions:• production of <strong>in</strong>dustry i <strong>in</strong> region r equals <strong>in</strong>termediate domestic consumption, f<strong>in</strong>al dem<strong>and</strong>(private consumption, public consumption, dem<strong>and</strong> for <strong>in</strong>vestment goods) <strong>and</strong> exports to allo<strong>the</strong>r regions;• endowments of primary factors (e.g., labour, capital) matches dem<strong>and</strong> from domestic<strong>in</strong>dustries;• unit prices for goods <strong>and</strong> services equals average production costs, <strong>in</strong>clud<strong>in</strong>g taxes;17
• representative firms <strong>in</strong> each regional <strong>in</strong>dustry allocate factors on <strong>the</strong> basis of costm<strong>in</strong>imization;• available national <strong>in</strong>come equals returns on primary factors owned by domestic agents;• national <strong>in</strong>come is allocated to private consumption, public consumption <strong>and</strong> sav<strong>in</strong>gs;• sav<strong>in</strong>gs are virtually pooled by a world bank <strong>and</strong> redistributed as regional <strong>in</strong>vestments, on<strong>the</strong> basis of expected future returns on capital;• <strong>the</strong> structure of private consumption is set on <strong>the</strong> basis of utility maximization under budgetconstra<strong>in</strong>t;• <strong>in</strong>termediate <strong>and</strong> f<strong>in</strong>al dem<strong>and</strong> is split accord<strong>in</strong>g to <strong>the</strong> source of production: first betweendomestic production <strong>and</strong> imports, subsequently <strong>the</strong> imports among <strong>the</strong> various trad<strong>in</strong>gpartners. Allocation is based on relative market prices, <strong>in</strong>clud<strong>in</strong>g transportation, distribution,<strong>and</strong> tax marg<strong>in</strong>s. Goods <strong>in</strong> <strong>the</strong> same <strong>in</strong>dustry but produced <strong>in</strong> different places are regarded asimperfect substitutes;• <strong>the</strong>re is perfect domestic mobility for labour <strong>and</strong> capital (s<strong>in</strong>gle regional price), but no<strong>in</strong>ternational mobility;• <strong>the</strong>re is imperfect domestic mobility for l<strong>and</strong> (<strong>in</strong>dustry-specific price), but no <strong>in</strong>ternationalmobility. L<strong>and</strong> allocation is driven by relative returns.From a ma<strong>the</strong>matical po<strong>in</strong>t of view, <strong>the</strong> model is a very large non-l<strong>in</strong>ear system of equations.Structural parameters are set so that <strong>the</strong> model replicates observational data <strong>in</strong> a base year.Simulations entail chang<strong>in</strong>g some exogenous variables or parameters, br<strong>in</strong>g<strong>in</strong>g about <strong>the</strong>determ<strong>in</strong>ation of a counterfactual equilibrium. The partition between endogenous <strong>and</strong> exogenousvariables, as well as <strong>the</strong> regional <strong>and</strong> <strong>in</strong>dustrial disaggregation level, is not fixed but depends on <strong>the</strong>scope of <strong>the</strong> simulation exercise. In this paper, simulations have been obta<strong>in</strong>ed by chang<strong>in</strong>g totalfactor productivity parameters <strong>in</strong> agricultural <strong>in</strong>dustries.18
Appendix BAlbania Croata Cyprus Egypt France Greece Italy Morocco Spa<strong>in</strong> Tunisia Turkey Xeur XMENA RoW Tot EXPAlbania 0,00 0,83 0,11 0,36 10,43 10,85 62,44 0,08 2,88 0,04 5,50 63,34 1,75 41,29 199,90Croata 10,01 0,00 3,97 4,41 25,21 6,03 132,52 0,93 10,25 0,28 5,32 460,15 12,56 254,99 926,63Cyprus 0,14 0,84 0,00 0,88 4,82 9,39 12,02 0,04 2,37 0,03 9,06 93,96 23,14 28,15 184,84Egypt 22,77 5,05 9,47 0,00 124,46 118,52 413,81 42,24 123,79 52,71 169,94 1.638,05 1.598,14 1.770,80 6.089,76France 28,35 16,35 110,15 54,84 0,00 638,84 5.264,37 901,28 4.731,69 260,75 112,74 21.810,38 3.174,53 4.055,97 41.160,25Greece 112,34 21,63 81,48 19,21 89,17 0,00 398,14 2,37 62,88 5,10 74,98 2.339,32 85,36 422,92 3.714,90Italy 38,81 92,97 13,76 15,49 1.418,05 338,74 0,00 11,96 607,78 18,62 79,29 6.764,65 699,07 2.185,19 12.284,37Morocco 1,14 6,48 1,75 15,61 2.078,17 25,56 353,33 0,00 943,44 24,58 12,22 2.038,11 167,26 1.494,68 7.162,33Spa<strong>in</strong> 3,03 42,53 13,99 11,69 4.846,94 187,11 2.179,05 76,60 0,00 48,96 69,92 15.470,60 538,98 1.608,68 25.098,07Tunisia 0,82 3,13 2,36 4,73 480,15 14,42 734,20 78,28 300,42 0,00 15,27 571,97 273,80 498,45 2.977,98Turkey 30,07 25,85 2,33 74,25 541,85 242,09 921,78 23,55 269,79 35,38 0,00 4.824,42 1.058,50 2.742,27 10.792,11Xeur 102,31 456,16 202,26 263,49 7.019,01 1.446,55 6.729,49 368,31 5.776,60 450,96 1.480,95 0,00 6.130,25 15.691,53 46.117,86XMENA 2,00 7,66 53,99 197,28 639,94 97,55 599,67 31,06 275,16 57,54 237,03 2.109,23 0,00 7.292,14 11.600,25RoW 544,25 660,60 545,05 18.207,83 15.330,97 3.479,60 22.770,10 6.167,49 20.103,10 2.673,43 6.867,50 139.901,50 66.560,77 0,00 303.812,19Tot IMP 896,03 1.340,06 1.040,66 18.870,07 32.609,19 6.615,25 40.570,91 7.704,18 33.210,17 3.628,36 9.139,71 198.085,67 80.324,11 38.087,07Table B1 – Basel<strong>in</strong>e virtual water trade flows (Mm 3 )