Annual report 20108.31 MB - Boskalis
Annual report 20108.31 MB - Boskalis
Annual report 20108.31 MB - Boskalis
- No tags were found...

Create successful ePaper yourself
Turn your PDF publications into a flip-book with our unique Google optimized e-Paper software.
<strong>Annual</strong>RePORT2010
Key figuresKey figuresRevenue (x € 1 million) Net profit (x € 1 million) Capital expenditure (x € 1 million)2,674310.52,5003004002,1752,094249.1332,000240227.932081,500180240721,0001201602182882975006080DisposalsNet capital expenditure02008 2009 201002008 2009 201002008 2009 2010(amounts x € 1 million, unless stated otherwise) 2010 2009Revenue (work done) 2,674 2,175Order book (work to be done) 3,248 2,875Operating profit 401.9 249.3EBITDA* 621.5 445.0Net profit 310.5 227.9Net group profit* 312.9 229.2Depreciation, amortization and impairment losses 219.6 195.7Cash flow 532.5 424.8Shareholders’ equity 1,565 1,296Personnel (headcount) 13,832 10,514Ratios (percentages)Operating result as % of revenue 15.0 11.5Return on capital employed* 18.1 20.2Return on equity* 21.7 21.1Solvency* 37.1 46.5Figures per share (in €)Profit 3.11 2.58Dividend 1.24 1.19Cash flow* 5.30 4.81* Refer to glossary for definitions and abbreviations<strong>Annual</strong> Report 2010
Key figuresRevenue segmentationRevenue by segment (x € 1 million)Revenue by geographical area (x € 1 million)92651482961551,801Dredging & EarthmovingHarbour TowageSalvage, Transport & Heavy LiftTerminal ServicesMaritime infrastructureNon-allocated group costs228370348626517585The NetherlandsRest of EuropeAustralia / AsiaMiddle EastAfricaNorth and South AmericaOrder book developmentbewerkt voor JV2010Order book (x € 1 million)3,7503,3543,2483,0002,875Acquired orders (x € 1 million)2,6172,5002,3352,0001,766Operational informationbewerkt voor JV2010Fleet utilization (in weeks per year)504845424036342,2501,5002.08330271,5001,00020750020082009 201050002008 2009 2010534**one-off SMITconsolidation effect1002008 2009 2010CuttersHoppersShare information 2010 2009Stock price (in €)High 36.58 28.45Low 23.16 13.25Close 35.7 27.05Average daily trading volume 485,549 518,277Number of issued ordinary shares (x 1,000) 100,974 98,651Average number of outstanding shares (x 1,000) 99,962 88,372Stock market capitalization (in € billions) 3.605 2.669Profit per share (in €) 3.11 2.58Dividend per share (in €) 1.24 1.19Development <strong>Boskalis</strong> share price 2010, AEX index rebased to <strong>Boskalis</strong> (in euros)4035302520151050<strong>Boskalis</strong>AEXJanuaryFebruaryMarchAprilMayJuneJulyAugustSeptemberOctoberNovemberDecemberRoyal <strong>Boskalis</strong> Westminster nv
Looking back on 100 years of <strong>Boskalis</strong>The year 2010 marked 100 years of <strong>Boskalis</strong>history. To celebrate this unique anniversary<strong>Boskalis</strong> commissioned the book‘Verdiept Verleden. Een eeuw Koninklijke<strong>Boskalis</strong> Westminster en de Nederlandsebaggerindustrie’ (‘Deepening the past; acentury of Royal <strong>Boskalis</strong> Westminster andthe Dutch dredging industry’) (in Dutch).Researched and written by (corporate)historians at Utrecht University, the bookdescribes how our company was able togrow into the leading maritime servicesprovider it is today. The cover picture hasbeen borrowed from the book.
Summary financial information 2010<strong>Annual</strong> Report 2010This <strong>Annual</strong> Report contains forwardlookingstatements. These statements arebased on current expectations, estimatesand projections of <strong>Boskalis</strong>’ managementand information currently available to thecompany. These forecasts are not certainand contain elements of risk that aredifficult to predict and therefore <strong>Boskalis</strong>does not guarantee that its expectationswill be realized. <strong>Boskalis</strong> is under noobligation to update the statementscontained in this <strong>Annual</strong> Report.Unless stated otherwise, all amounts inthis <strong>Annual</strong> Report are in euros (€).Some of the projects referred to in this<strong>report</strong> were carried out in cooperation withother companies.This is an English translation of the official<strong>Annual</strong> Report in the Dutch language. Inthe event of discrepancies between thetwo, the Dutch version shall prevail.This <strong>report</strong> was produced carbon-free andprinted on 100% reclycled FSC paper.Royal <strong>Boskalis</strong> Westminster Royal <strong>Boskalis</strong> nv Westminster nv1
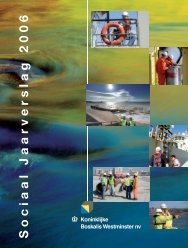
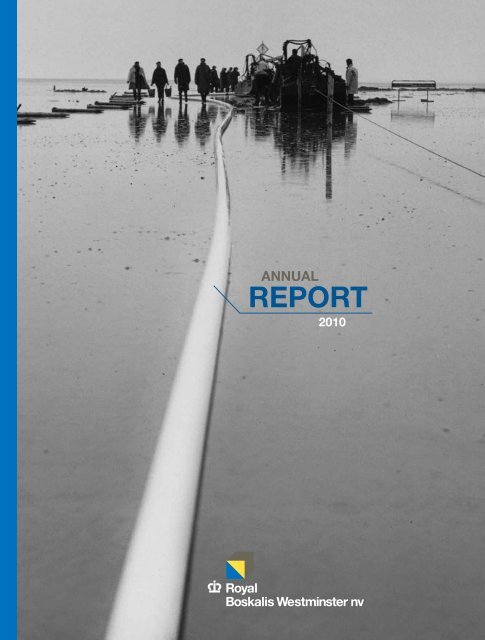
Mega trailing suction hopperdredger the Queen of theNetherlands at work in theMaldives. In 2010 work toraise four islands to protectthe local population wassuccessfully completed.
Summary financial information 2010Chairman’s statementDear shareholders,2010 was a special and memorable year for <strong>Boskalis</strong> in many ways. Not just because it was the year in whichwe celebrated our centenary, but definitely also because it was a year in which we continued to develop thefoundations for the future of our company.Record revenue and profitAbove all, 2010 was a special year because of therecord level of revenue and net profit we achieved.Revenue rose by 23% to € 2.7 billion and net profitwas up 36% at 311 million, whilst the order bookremained at a respectable level of € 3.2 billion.Operating results of truly historic proportions.The merger with Smit Internationale N.V., whichwe completed with effect from 27 March 2010,made a major contribution to the growth figures weachieved in 2010.The combination of <strong>Boskalis</strong> and SMIT has createda world-class maritime player:• 14,000 employees;• 1,100 vessels;• active in 65 countries.As soon as the offer had succeeded we got down towork together on exploring the potential synergies- in terms of costs but in particular in the market.And the opportunities are plentiful. For example,we are working together increasingly closely tocut procurement costs, leverage each other’sknowledge and people, and more importantly: topiggy back on each other in the market.Over € 10 million in actual cost and other synergieshave been identified in 2010 and will be realizedover the next two years.4 <strong>Annual</strong> Report 2010
Summary Chairman’s financial statement information 2010However, last year we also achieved greatsuccess in our core activity of Dredging &Earthmoving, once again reaping the benefitsof our contracting policy of recent years whichenabled us to start 2010 with a well-filled orderbook.And so we made an excellent start with theintegration process, with business continuing verymuch as usual.The organization had to pull out all the stops - onthe projects, on the vessels, at the wharves and inthe offices. Everybody worked hard - both on theintegration and on our normal business.In the Oil & Gas segment we worked on the NordStream pipeline linking Russia and northernGermany. We also made a start on the sizableGorgon LNG project in Australia - a big challengefor the organization due to both its nature and inparticular the unique environment.In addition we started work on the second phaseof the LNG port at Cuyutlán in Mexico as well asthe expansion of the Soyo LNG port in Angola.In our Ports segment construction work on theMaasvlakte 2 in Rotterdam - a project which willcontinue through to mid-2012 - kept us very busyin the Netherlands in 2010. Most of the volume ofsand that needs to be delivered from the sea hasbeen deposited and we are now hard at work onthe sea wall in particular.In addition we, together with Archirodon,successfully completed the construction of thenew Khalifa Port in Abu Dhabi.And in the Caribbean we worked on deepeningand expanding cruise ship terminals, in theBahamas and in Jamaica.In the Land Reclamation & Coastal Protectionsegment work in the Netherlands was onceagain concentrated on tackling the sections ofcoastline known as the ‘Zwakke Schakels’ (WeakKey developments in 2010Record revenue € 2.7 billion and result € 311 million,earnings per share 3.11Well-filled order book € 3.2 billion with projects across allsegments and broad geographical spreadMerger with Smit Internationale N.V. completedFinancing of SMIT takeover completed with successful€ 354 million mln USPPLaunch of new NINA safety programNew 2011-2013 Corporate Business PlanLinks). Just before the end of the year we won thecontract to create a ‘sand motor’ off the coast ofthe province of Zuid-Holland.In the Maldives the reconstruction of another fourislands was completed in order to protect the localpopulation from rising sea levels.In Louisiana in the United States our Americantrailing suction hopper dredger Stuyvesantsuccessfully helped to build sand berms to protectthe ecosystem against the oil spill resulting fromthe disaster with the Deepwater Horizon rig.SafetyDespite the high level of operational activity andthe additional workload from the merger we onceagain managed to further improve safety on ourvessels and projects, as evidenced by the fact thatwe managed to again reduce the Lost Time InjuryFrequency rate, our leading safety indicator, from0.74 to 0.67. In our Corporate Social ResponsibilityReport we account for our economic, social andenvironmental performance and in which, amongstothers, Safety is a prominent aspect.Royal <strong>Boskalis</strong> Westminster nv5
Chairman’s statementA major initiative in the area of safety in 2010was the introduction of our new safety program,NINA (No Injuries No Accidents). Focused onthe necessary culture changes, the entire safetyprogram was developed in-house and its roll-outacross the <strong>Boskalis</strong> organization has been ongoingsince the summer of 2010. The aim is for NINA tobecome part and parcel of our everyday business.The core of NINA consists of five safety values,which mainly relate to awareness, responsibilityand open communication about safety.The NINA program enjoys the proactive supportof our senior management and will make a majorcontribution to the further improvement of safetywithin our company.FinancingIn order to finance the acquisition of SMIT, <strong>Boskalis</strong>already successfully completed a € 230 millionequity offering of over nine million new shares in2009. In addition, a € 650 million credit facility wastaken out, as well as a € 400 million bridge loan.In 2010 we completed the overall financing with a€ 354 million private placement loan in the UnitedStates and the United Kingdom. The interest wasso intense that demand was three times greaterthan our required financing level.Even after the acquisition of SMIT our balancesheet remains solid, with a solvency level of 37.1%.At end-2010 net debt totalled € 450 million. Thenet debt/EBITDA ratio is around 0.9, well belowthe ceiling of 3.0 which applies under the financingagreements.Our strong balance sheet combined with the cashflows that we will generate over the next few yearswill enable us to pursue further targeted growth ofour business through investments and acquisitions.6 <strong>Annual</strong> Report 2010
Chairman’s statementCorporate Business Plan 2011-2013A new Corporate Business Plan has been compiledin order to bring focus to the new group in terms ofits composition and cohesion, and to prioritize thevarious investment opportunities.To this end we took measures including aglobal market survey of the relevant trends anddevelopments in our markets. We also visiteddozens of our clients and end-users of our servicesaround the world in order to question them abouttheir views on the market and their specific productrequirements.The study showed that the long-term drivers forour industry, and in particular the growth in energyconsumption and global trade, remain positive.The main market segments that we will continue toconcentrate on are:• Oil & Gas;• Ports;• Land Reclamation & Coastal ProtectionWe have refined our geographical focus. We haveidentified six regions in the world where thereis expected to be a high level of activity for ourbusiness in the coming years and on which we willconcentrate our focus. These ‘focal regions’ are:• Northwest Europe;• South and West Africa;• Brazil;• Middle East;• Southeast Asia;• Australia.Although the long-term drivers are positive, weexpect volumes and prices to be under pressure inthe near term, particularly at the lower end of themarket. We shall therefore intensify our focus oncost leadership.Conversely, at the top end of the market we areseeing opportunities for combined services withconsiderable added value. This applies in particularto the combination of SMIT and <strong>Boskalis</strong> services.In order to maximize our ability to leverage theseopportunities we will continue to further integratethe organizations.In the coming years we will use our strategic frameworkto further put our house in order, on the onehand by fine-tuning both our portfolio of activitiesand our organization.On the other, we will take targeted action to furtherstrengthen ourselves – within the organization, withour fleet, and, where possible, through acquisitions.And so it is with a sense of great expectation andconfidence that we cross the threshold into the nextcentury of our history.Shortly after the date of this <strong>report</strong> the sad newsreached us of the sudden passing away of ouresteemed chairman of the Supervisory Board,Mr. H. Heemskerk.After his appointment to the Supervisory Board in2006 Mr. Heemskerk made a major contribution tothe development of our company through hisbroad managerial experience, great interest andenthusiastic involvement. As chairman of theSupervisory Board Mr. Heemskerk played animportant, binding role in renewing, reinforcing andleading the Supervisory Board. We will remember himas a committed, inspiring and passionate person.On behalf of the Board of Managementdr. P.A.M. BerdowskiRoyal <strong>Boskalis</strong> Westminster nv7
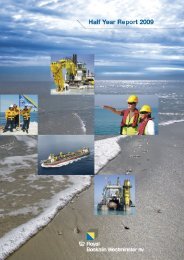
8Maasvlakte 2 project, the NetherlandsThe Blockbuster has been deployed to place the blocksin the hard sea wall. Thanks to its unique constructionthis ‘E-crane’ is able to lift blocks weighing 50 tonnesand move them across a distance of 63 meters. Boththe technical adjustments needed to achieve thisand the advanced operating system were developedin-house by <strong>Boskalis</strong>.
Summary financial information 201010 <strong>Annual</strong> Report 2010
<strong>Boskalis</strong> at a glanceCompany profile 12Activities 13Strategy 14Shareholder information 2211
<strong>Boskalis</strong> at a glanceCompany profileRoyal <strong>Boskalis</strong> Westminster N.V. (<strong>Boskalis</strong>) is a leading global services provider operating in the dredging,maritime infrastructure and maritime and terminal services sectors. The activities of <strong>Boskalis</strong> compriseDredging & Earthmoving, Harbour Towage (through SMIT), Salvage, Transport & Heavy Lift (through SMIT),Terminal Services (through SMIT and our 50% share in Lamnalco) and Martime Infrastructure (through our 40%stake in Archirodon).<strong>Boskalis</strong> concentrates on the oil and gas, ports,and land reclamation and coastal protectionmarket segments. This spread gives us both a solidfoundation and the flexibility to be able to takeon a wide range of projects and means we haveexcellent prospects for balanced growth. Demandfor our services is driven by growing energyconsumption, growth in global trade, growth inworld population, and climate change.Our main clients are oil companies, port operators,governments, shipping companies, internationalproject developers, insurance companies andmining firms. We provide its clients with a broadrange of services within the chain comprisingdesign, project management, execution andcontinuous services.<strong>Boskalis</strong> has around 14,000 employees, includingour share in partner companies Lamnalco andArchirodon, and is active in over 65 countriesacross six continents. Our versatile fleet consists ofover 1,100 vessels. <strong>Boskalis</strong> is based in the Dutchcity of Papendrecht. Royal <strong>Boskalis</strong> WestminsterN.V. shares have been listed on the Amsterdamstock exchange since 1971 and are currentlyincluded in the AEX index of NYSE EuronextAmsterdam.Trailing suction hopper dredger the Prinsder Nederlanden dredging a containerterminal in Cape Town, South Africa.12 <strong>Annual</strong> Report 2010
<strong>Boskalis</strong> at a glanceActivitiesDredging & EarthmovingAll manner of activities relating to wet and dryearthmoving traditionally form <strong>Boskalis</strong>’ mostimportant business and include port constructionand waterway maintenance, land reclamation andcoastal defense and riverbank protection. We alsoprovide a range of specialist services includingoffshore services, dry earthmoving and soil improvement,underwater rock fragmentation, environmentalcontracting and engineering. Our multidisciplinaryapproach allows us to take on and execute largescale,complex projects. Thanks to our globalspread, high professional standards, versatile stateof-the-artfleet and our conscious focus on costswe are a world leader in Dredging & Earthmoving.We are reknown for our innovative approach andspecialist knowledge of environmentally friendlydredging techniques.Harbour TowageWe provide assistance to incoming and outgoingseagoing vessels - including ro-ro ships, oil andchemical tankers, container ships, reefers and mixedcargo ships - in some of the world’s biggest ports.With a versatile fleet of over 200 tugs, SMIT hasbuilt up an excellent reputation in this area. SMIToperates tug services in countries including theNetherlands, Argentina, Belgium, Canada, Brazil,Indonesia, Malaysia, Panama, Singapore and theUnited Kingdom.Salvage, Transport & Heavy LiftThe specialist activities we offer through SMITinclude salvage, wreck clearance, transport ofheavy loads and heavy lifting work using floatingcranes. Because SMIT operates out of four strategiclocations - Houston, Cape Town, Rotterdam andSingapore - it is able to provide emergency responseassistance to ships in distress anywhere in the worldand at any time.SMIT has the advanced technology and expertiseneeded to remove hazardous substances such asfuel from wrecks in order to prevent environmentalpollution.SMIT operates a varied fleet of transport barges forthe transportation of civil engineering constructions,cranes, offshore constructions and other heavyloads. SMIT also leases out large and small workvessels, in particular to the offshore industry.SMIT also carries out heavy lifting work in selectedregions using floating cranes with a lifting capacityranging from 400 to 3,200 tons.Terminal ServicesThrough SMIT and Lamnalco (in which we hold a50% stake) we offer a full range of services for theoperation and management of onshore and offshoreterminals. Providing support for the berthingand unberthing of oil and gas tankers is the coreactivity in this segment. Additional support servicesinclude piloting services, subsea inspectionand maintenance, coupling and uncoupling ofterminal connections, firefighting, escort services,transportation of crews and goods and operatingbunker vessels. We also assist with the operationalmarine management of terminals. The instructionand training of local staff often forms an integralcomponent of these activities.Maritime InfrastructureArchirodon, in which we hold a 40% stake, isour strategic partner in the field of maritimeinfrastructure. As a maritime contractor Archirodonhas extensive experience in designing andconstructing quay walls, jetties, breakwaters and oiland gas terminals. In addition, the company is anall-rounder in the civil infrastructure and industrialinstallations markets, building for example waterpurification plants, sewer systems, dams, bridges,power stations, desalination plants and pumpingstations, particularly in the Middle East and NorthAfrica. The company has an excellent track recordwhen it comes to executing multidisciplinaryprojects.Royal <strong>Boskalis</strong> Westminster nv 13
<strong>Boskalis</strong> at a glanceStrategy Focus, Optimize, Reinforce, ExpandThe merger of <strong>Boskalis</strong> and SMIT has created one of the biggest international maritime companies in the world.A new Corporate Business Plan has been drafted for 2011-2013 to give direction and cohesion to the companyin this new composition, and to enable us to set the right priorities with regard to the various investmentopportunities. We will use a considerable part of the period covered by the plan to optimize the organization’snew structure, both internally and in the market. We wish to focus our joint activities, to optimize and reinforceour combined knowledge, strength and expertise. We will also pursue further growth and expand our activitieswhen opportunities present themselves in the market.Market developmentsStructural growth in the markets where <strong>Boskalis</strong> isactive continues to be driven by long-term globaleconomic and geographic trends. For the purposeof our new Business Plan we carried out a globalreview of the relevant trends and developmentsin our markets. We also visited dozens of clientsand end-users around the world to sound them outabout their vision on the market and their specificneeds. This led to the following conclusions.The most important underlying drivers of growth forthe markets in which we operate are the growingdemand for energy and growth in global trade.Over the past few years we were faced withstagnating demand as a result of the cyclicaldownturn in 2008. At the same time we sawnew production capacity coming onto themarket. This put pressure on both volumes andmargins. The market outlook for the longer termis more positive. Our analyses show favorablegrowth perspectives for the coming years inthe markets related to Oil & Gas and Ports.Offshore Oil & Gas CapEx & OpEx (US$ bn)400300Asia PacificLatin America200Middle EastAfrica100North Amerika0Europe2004 2005 2006 2007 2008 2009 2010 2011 2012 2013Source: Douglas Westwood & Energy14 <strong>Annual</strong> Review 2010
StrategyContainer throughput* (million TEU)7002008 levels achieved againbetween 2011 and 2012600500Transhipment400300200Port-to-Port10002000 2001 2002 2003 2004 2005 2006 2007 2008 2009 2010 2011 2012 2013 2014Source: Drewry 2009/10In addition in specific regions there is growingdemand for land reclamation and coastalprotection.The main market segments we will continue toconcentrate on are:• Oil & Gas• Ports• Land Reclamation & Coastal Protection<strong>Boskalis</strong> revenue breakdown by market segmentWe see strong differences in client needs within andbetween the various market segments. At the lowerend of the market we find clients who are lookingfor one fairly simple product, such as standarddredging work, equipment hire or transport. Asthese clients are strongly focused on costs, costleadership is a major (pre)condition for success inthis segment. <strong>Boskalis</strong> wants to be active in thissegment with specific equipment because it allowsus to realize stable volumes and optimize our fleetutilization.18%8%41%33%PortsOil & GasLand Reclamation & Coastal ProtectionOtherAt the top end of the market we find clients wholook to us to deliver integrated services or turnkeysolutions. To be able to meet these high-end clientdemands we need to operate as a contract partner,while additional competencies such as engineering,environmental and soil knowledge, expertise incoastal and maritime engineering and projectmanagement experience are key success factors.We wish to position ourselves emphatically in thissegment which is characterized by relatively lowvolumes and the potential for higher margins.The group’s success is determined by its ability toleverage the diversity of our equipment to serveboth these client groups in a balanced way.Royal <strong>Boskalis</strong> Westminster nv15
<strong>Boskalis</strong> at a glanceStrategic frameworkThere are four cornerstones to the new plan:Focus, Optimize, Reinforce and Expand.FocusTo be the leading services provider ofcreative, innovative and complete solutionsfor infrastructural challenges in the maritime,coastal and delta areas of the world.OptimizeReinforceExpandFocus• On market segments• On geographic regions• On Value-Adding AssetsThe Focus principle relates to three aspects.In addition to the focus on our three marketsegments, we will especially target our activitieson certain geographic regions. The choicefor these regions is based on our marketanalysis which shows where the main Oil & Gasdevelopments are likely to take place in thecoming period and where the opportunities lie forour combined activities.N/W EuropeS/E AsiaMiddleEast= € 500mBrazilS/W AfricaAustraliaOil & GasPortsLand Reclamation & Coastal Protection16 <strong>Annual</strong> Review 2010
StrategyIn the next few years we will concentrate ouractivities on six geographic regions, withouthowever losing sight of other areas:1. North-West Europe2. South and West Africa3. Brazil4. Middle East5. Southeast Asia6. AustraliaFinally, we will focus on Value-Adding Assetsthrough a combination of activities and equipmentwhich enables us both to operate cost-effectivelyat the lower end of the market and to be successfulin the complex turnkey/multidisciplinary integratedprojects at the top end of the market.Optimize• Cost leadership• Further integration of activities• Invest in developing competenciesWith the new composition of the group and thefocus areas we have defined we plan to optimizethe cohesion between the various activities. On thecost side we will do this by making better use ofthe potential of our organizations and by investingin developing the competencies which strengthenour position as a high-end contractor.1. Cost leadership - We want to strengthen ourcost leadership by taking maximum advantageof the group’s economies of scale, for exampleby leveraging our purchasing power withsuppliers. We want to reduce costs throughbenchmarking and exchanging best practices.Moreover, we will set priorities within thebusiness, prioritizing activities and assetswith value-added contracting potential andfocusing on the six geographic regions.2. Integration & centralization of resources –We are working on enhancing theorganization’s efficiency by further integratingvarious support activities and physicallyhousing them under the same roof. Theprincipal internal synergy opportunities liein central management of the equipment(fleet management), purchasing, crewing andtraining. Furthermore, by acting in concert inthe market we will be able to take advantageof new commercial opportunities that arise,with both new and existing clients.3. Invest in developing competencies - In orderto provide our joint activities in the highersegment we plan to combine and reinforcethe necessary competencies - primarilyengineering, costing, work preparation, riskmanagement, project management andinnovation. In the past few years <strong>Boskalis</strong> hasstrongly developed these competencies withregard to large, complex dredging projects. Wewant to further develop this knowledge andexpertise and use it to scale up the group’sother activities towards turnkey projects. Forexample, we see opportunities in the marketfor providing complex oil and gas dredgingwork combined with SMIT activities.Reinforce:• Invest in the dredging fleet• Invest in other equipment• Combine terminal servicesWe are going to reinforce our existing activities.Royal <strong>Boskalis</strong> Westminster nv17
<strong>Boskalis</strong> at a glance1. Invest in the dredging fleet - over the pastfew years <strong>Boskalis</strong> has had various ‘winningvessels’ built in the medium, large and jumbohopper segments. We see ample opportunitiesfor further selective investment in the marketfor dredging activities, particularly in thelargest and smallest segments of the fleet.At the top end we want to recommission themega hopper the W.D. Fairway. In additionwe plan to have three competitive, smallerhoppers built.Given that a few of our jumbo cutters areageing, we also plan to invest in this segmentover the next three years. In 2011 the selfpropelledcutter Taurus II will be upgraded to amega cutter. This investment will considerablyincrease the vessel’s total installed power anddischarge pump power capacity with 60% torespectively 24,600 kW and 16,000 kW andextend its lifespan. We will also replace one ofthe elder jumbocutters by a new self-propelledcutter. This state of the art megacutter will geta total installed power and discharge pumppower capacity of respectively about 24,000kW and 16,000 kW.Subject to the resumption of large-scale landreclamation projects in Singapore, we planto invest in several self-propelled mega sandcarriers; this will involve single-hull tankersbeing converted to enable them to transportlarge quantities of sand over long distances ata competitive cost.2. Invest in other equipment - In response todevelopments we are seeing in the energymarket (both in Oil & Gas and offshore windparks), we are investing in a fallpipe vesseland a hybrid rock dumping/cable layingvessel. The fallpipe vessel is currently underconstruction and will be commissioned inearly 2012.With the completion of new LNG import andexport terminals we expect to see a considerablenumber of new terminal contractsfrom 2012/2013. We plan to build new tugs toservice new terminal contracts.For our Asian Lift Singapore joint venturewe want to have a large floating crane builtwhich can be deployed for heavy lifting workin for example the oil and gas sector in theSoutheast Asia region.We want to achieve further expansion in theBrazilian growth market by investing in newtugboats for our Harbour Towage and TerminalServices segments.Furthermore, we are investing in high-pressurediving equipment (saturation diving) to enableus to extend our existing diving activities toother regions.3. Reinforce Terminal Services - In 2011 we willfurther explore a possible merger of SMITTerminals and Lamnalco, in which <strong>Boskalis</strong>intends to keep a 50% stake.Expand:• Strengthen regional position• Expand regional position• Add global activities1. Strengthen regional position using existingactivities - We want to strengthen ourposition in the six geographic focus areas.The leveraging of our market presence andstrong client relationships will enable us tooffer a wider range of activities. For example,our dredging activities hold a strong positionin Australia and we see opportunities to alsooffer Terminal Services and Heavy Lift servicesin this market. In Brazil, where we are well-18 <strong>Annual</strong> Review 2010
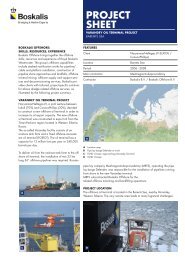
Summary financial information 201020<strong>Annual</strong> Report 2010SMIT activitiesIn 2010 SMIT Harbour Towage provided assistance to many ships,including the Berge Stahl, one of the biggest bulk carriers in the world,on its arrival at the Port of Rotterdam. SMIT Salvage performs salvageand wreck clearance work, including in 2010 the firefighting operationon the Lisco Gloria ferry. In addition, SMIT provides transport andheavy lift services. SMIT Terminals provides assistance to incomingand outgoing (LNG) tankers at onshore and offshore terminals.
Summary financial information 2010Royal <strong>Boskalis</strong> Westminster nv21
<strong>Boskalis</strong> at a glanceShareholder informationWe are committed to open and transparent dialog with our financial stakeholders. We ensure that they areprovided with accurate and timely information, to enable them to assess our performance in relation todevelopments and prospects in our markets.Reclamation of land by mega trailing suction hopper dredger the Queen of the Netherlands on Velidhoo island in the Maldives.Open dialogWe provide clear and accessible communicationsto our financial stakeholders, including existingand potential shareholders, institutional investors,financial analysts and the media. The <strong>Boskalis</strong>share is covered by all the major Dutch as well as anumber of global brokers and their analysts. Theyplay a key role in providing investors with informationabout our company and developments inthe maritime markets which are relevant to us. Wetherefore make every effort to punctually provideour stakeholders with complete information aboutour corporate strategy and policy, and the resultingfinancial performance. Questions from stakeholdersare answered candidly and wherever possible wetake the initiative when it comes to raising importantissues. We maintain regular contact with majorinvestors and analysts, partly by organizing annualvisits to project sites. Meetings with investors andanalysts are held using publicly available presentations(www.boskalis.com) and price-sensitiveinformation is only discussed if publicly available.WebsiteThe <strong>Boskalis</strong> corporate website provides aconstantly updated source of information about ourcore activities and ongoing projects. The websiteunderwent a complete overhaul at the start of 2011.<strong>Annual</strong> <strong>report</strong>s, starting with this <strong>Annual</strong> Report, willbe made available as interactive HTML <strong>report</strong>s fromnow on to increase their accessibility.The Investor Relations section offers informationabout our share and other information relevant toshareholders, as well as the latest and archivedpress releases and analyst and companypresentations.22 <strong>Annual</strong> Report 2010
Shareholder informationShare information<strong>Boskalis</strong>’ authorized share capital of € 240 millionis divided into 200 million shares, of which 150million ordinary shares and 50 million cumulativeprotective preference shares. The issued capitalas at 1 January 2010 consisted of 98.7 millionordinary shares. Nearly two-thirds of shareholders(62.4%) opted to have their dividend for 2009distributed in the form of stock dividend, resultingin the issue of 2.3 million new ordinary shares inJune 2010. On balance, the issued share capital atas 31 December 2010 consisted of 101.0 millionordinary shares.Royal <strong>Boskalis</strong> Westminster N.V. shares are listedon NYSE Euronext Amsterdam, where they areincluded in the AEX leading index. The share is alsoincluded in the Euronext Next 150 index, FTSE AllWorld Developed Europe Index and the Dow JonesSTOXX 600 Index.Tickers: Bloomberg: BOKA:NA, Reuters: BOSN.AS,Euronext Amsterdam: BOKAIn 2010, 125 million <strong>Boskalis</strong> shares were traded onNYSE Euronext Amsterdam (2009: 133 million). Theaverage daily trading volume in 2010 was 485,549shares, a decrease of 6% compared to 2009. Inthe course of 2010 the share price rose 32% from€ 27.05 to € 35.70, comfortably outperformingthe AEX index. The stock market capitalizationincreased 35% compared to the end of 2009 to€ 3.6 billion.Shareholders:The following shareholders are known to havea holding of at least 5% in <strong>Boskalis</strong> as at 31December 2010:HAL Investments B.V.: 32.93%Delta Lloyd Groep: 5.15%Besides these large shareholders, an estimated15% of the shares are held by shareholdersin the United States and Canada, 25% in theUnited Kingdom and the remainder in mainly theNetherlands, France, Germany and Scandinavia.Merger with SMITOn 12 November 2009 <strong>Boskalis</strong> and SMIT jointlyannounced their intention to sign a full mergeragreement. To partially finance the acquisition<strong>Boskalis</strong> successfully completed an equity issue inearly December involving over 9 million new sharesworth € 230 million. An offer for SMIT’s shares waslaunched on 24 February 2010 and when the bidwas declared unconditional on 27 March, 89.6%of all shares had been tendered. On 5 May 2010SMIT shares were delisted from NYSE EuronextAmsterdam. Since 12 January 2011 <strong>Boskalis</strong>has been in possession of the full 100% of SMITshares.Dividend policyThe main principle underlying the <strong>Boskalis</strong> dividendpolicy is to distribute 40% to 50% of the net profitfrom ordinary operations as dividend. At the sametime <strong>Boskalis</strong> aims to achieve a stable developmentof the dividend in the longer term. The choiceof dividend (in cash and/or entirely or partly inshares) takes into account both the company’sdesired balance sheet structure and the interests ofshareholders.Financial agenda 201117 March Publication of 2010 annual resultsEnd-March Publication of 2010 annual <strong>report</strong>5 April Capital Market Day12 May Trading update on first quarter of 201112 May <strong>Annual</strong> General Meeting16 May Ex-dividend date18 May Record date for dividend entitlement (after market close)27 May Final date for stating of dividend preference1 June Determination and publication of conversion rate fordividend based on the average share price on30, 31 May and 1 June (after market close)8 June Date of dividend payment and delivery of shares18 August Publication of 2011 half-year results18 November Trading update on third quarter of 2011Royal <strong>Boskalis</strong> Westminster nv23
24Cutter suction dredgersCutter suction dredgers are used to dredge hard soil and rock.A cutter head is used to cut away the soil which is usually pumpedashore using a pressure pipeline. <strong>Boskalis</strong> has a fleet of around30 cutter suction dredgers, including four jumbo cutter suctiondredgers. Jumbo cutter suction dredgers in action in 2010included the Ursa on the construction of a cruise terminal in theBahamas and the Taurus II on the Gorgon Project in Australia.
Report of the Supervisory BoardIn accordance with Article 27 of the Articles of Association of Royal <strong>Boskalis</strong> Westminster N.V., theSupervisory Board presents the 2010 annual <strong>report</strong> to the <strong>Annual</strong> General Meeting of Shareholders.The annual <strong>report</strong>, including the financial statements and the management statement, was drawn up by theBoard of Management. The financial statements are accompanied by the <strong>report</strong> of the company’s externalauditor KPMG Accountants N.V., which is included on page 131 of this <strong>report</strong>.We recommend the following to the <strong>Annual</strong> GeneralMeeting of Shareholders:• The adoption of the financial statements,including the proposed profit appropriation;• The discharge of the members of theBoard of Management in respect of theirmanagementactivities during 2010;• The discharge of the members of theSupervisory Board for their supervision ofmanagement during 2010; and• The distribution to shareholders of a dividend of€ 1.24 per ordinary share to be paid in ordinaryshares, unless the shareholder opts for a cashdividend.Composition of the Board of ManagementAt the beginning of the year under review the Boardof Management consisted of three members. On17 March 2010 the Supervisory Board reappointedMr. Kamps to the Board of Management in theposition of Chief Financial Officer for a period offour years. Furthermore, in connection with themerger with Smit Internationale N.V., Mr. Vreewas appointed to the Board of Management witheffect from 1 April 2010, likewise for a period offour years. Once the integration of Royal <strong>Boskalis</strong>Westminster N.V. and Smit Internationale N.V. hadbeen completed, Mr. Vree resigned from the Boardof Management on 31 December 2010. There wereno other changes to the composition of the Boardof Management during the year under review.consisted of five members. In view of the mergerwith Smit Internationale N.V. the SupervisoryBoard decided to expand the SupervisoryBoard to six members. On 17 March 2010 theExtraordinary General Meeting of Shareholders, onthe recommendation of the Supervisory Board andwith the backing of the Works Council, appointedMr. Hazewinkel to the Supervisory Board witheffect from 27 March 2010 and for a period of fouryears.Activities of the Supervisory BoardThe Supervisory Board held six meetings withthe Board of Management. All members of theSupervisory Board attended most of the meetingsduring the year under review.Permanent items on the agenda of theSupervisory Board are: the development ofthe results, the balance sheet, and industryand market developments. With regard to themarket developments the Board of Managementdiscussed potential large projects as well asthe progress on material projects contracted.During the year under review subjects discussedincluded the contracting of large projects suchas Nordstream, Swinoujscie in Poland, the ‘sandmotor’ in the Netherlands and the salvage of theMSC Chitra in India, as well as the progress ofprojects such as Maasvlakte 2 in the Netherlandsand Gorgon in Australia.Composition of the Supervisory BoardAt the start of 2010 the Supervisory BoardOther topics under scrutiny in 2010 includedthe corporate budget, liquidity, acquisition and26 <strong>Annual</strong> Report 2010
Report of the Supervisory Boardinvestment proposals, organizational structure,the status of the pension funds, staffing policyas well as the remuneration policy of the Boardof Management. Special attention was paid tothe company’s policy on safety, health and theenvironment, as illustrated in the CSR <strong>report</strong>.Also the company’s new safety program, calledNINA (No Injuries No Accidents), and the way inwhich this program is being implemented withinthe organization and by subcontractors, wereextensively discussed.The Supervisory Board examined the company’sstrategy and the risks associated with it, as wellas the implementation of the 2009-2011 businessplan. Another regular topic of discussionconcerned the principal risks inherent to themanagement of the company, such as the risksassociated with contracting. Further informationabout this can be found on pages 51 to 56 ofthis <strong>report</strong>. The structure and operation of theinternal risk management and control systemswere assessed regularly and discussed withthe Supervisory Board. No significant changeswere made to the internal risk management andcontrol systems during the year under review. Themeetings to discuss the annual and semi-annualresults were held in the presence of the externalauditor.The merger with Smit Internationale N.V. was animportant topic in 2010. The Supervisory Boardconsidered the compatibility of the merger withthe company’s strategy, the likely market and costsynergies, the impact of the necessary financing,the merger protocol, the outcome of the duediligence, the recommendations of the respectiveworks councils on the subject and the public offerprocedures. On 17 March 2010 the SupervisoryBoard submitted the joint proposal from theSupervisory Board and the Board of Managementfor the acquisition of a stake equalling the entireoutstanding share capital of Smit InternationaleN.V. for approval by the Extraordinary GeneralMeeting of Shareholders. The proposal wasapproved by that body on that same day. Inthe second half of the year under review theSupervisory Board studied the integration of thecompany with Smit Internationale N.V., the wayin which the results of Smit Internationale N.V.have been recognized, as well as the negotiationsregarding the sale of SMIT Terminals to Lamnalco.Special attention was paid to the financialposition of the pension funds with which <strong>Boskalis</strong>is associated, to the recovery plans drawn up intheir regard and in particular to the voluntarilymeasures required to prevent a reduction inpension benefits at the SMIT pension fund.The further settlement of the case involving themega hopper W.D. Fairway, which was involvedin a collision in 2007, was also discussed, aswell as the principles applying to the methodof calculating the remuneration of the Board ofManagement.In the course of the year under review theSupervisory Board paid a working visit to theFremantle and Gorgon projects in Australia.During the visit the Supervisory Board familiarizeditself with the operational, environmental andsafety aspects of this latest large-scale project.Extensive attention was also paid to the markettrends in Australia with regard to the developmentof marine infrastructure.Various members of the Supervisory Boarddiscussed the results, the corporate strategy,the market developments, the current situationsurrounding the pension funds as well as themerger and integration with Smit InternationaleN.V. with the Works Council.The Supervisory Board has instituted threecore committees - the Audit Committee, theRemuneration Committee and the Selection andAppointment Committee. They performed theirtasks as follows.Royal <strong>Boskalis</strong> Westminster nv27
Report of the Supervisory BoardAudit CommitteeMembers of the Audit CommitteeThe Audit Committee consists of two members: M.Niggebrugge (chairman) and H. Heemskerk.Activities during 2010The Audit Committee met three times during 2010to discuss matters including the 2009 annualaccounts, (interim) financial <strong>report</strong>ing for the2010 financial year, the offer for the remainingstake in Smit Internationale N.V., the recognitionof the acquisition in the financial <strong>report</strong>ing,and in particular the purchase price allocation,the impact of the takeover on group profit,developments in IFRS, risk management, costcontrol, developments in the order book, insurancematters, the company’s tax position, internalcontrol procedures, and financial accounting andrelevant legislation and regulations, including theCorporate Governance Code. The ManagementLetter issued by the auditor as part of the auditof the 2009 annual accounts was discussed, aswas the follow-up of points from previously issuedManagement Letters.In addition, the Audit Committee discussed thefinancing of the takeover of Smit InternationaleN.V., as well as the development of the financialposition of the pension funds with which <strong>Boskalis</strong>is associated. Special attention was paid to thecoverage shortfall of the <strong>Boskalis</strong> pension fundand the proposed plan to remedy this, as well asthe measures taken in connection with the SMITpension fund.The Audit Committee discussed once again theimportance of an internal audit function andthe associated duties and responsibilities, anddocumented these in an Internal Audit Charter. Theactivities of the internal auditor during 2010 werealso discussed, as well the Internal Audit Plan for2011.Inventory of cutter heads on the Khalifa Port project in Abu Dhabi.The chairman of the Board of Management andthe Chief Financial Officer were present at themeetings of the Audit Committee, along with thegroup controller and the external auditor. During theyear under review meetings were also held with the28 <strong>Annual</strong> Report 2010
Report of the Supervisory Boardexternal auditor without the Board of Managementbeing present. Reports and findings of thesemeetings were presented to the entire SupervisoryBoard.Remuneration CommitteeMembers of the Remuneration CommitteeThe Remuneration Committee consists of twomembers: C. van Woudenberg (chairman) andM.P. Kramer.The Remuneration Committee availed itself of theservices of an independent remuneration adviserand ascertained that this remuneration adviser doesnot provide advice to the members of the Board ofManagement.Duties and responsibilities of the RemunerationCommitteeThe Remuneration Committee performs thefollowing duties:• Putting forward a proposal to the SupervisoryBoard with regard to the remuneration policy tobe pursued for the Board of Management. Thepolicy is submitted for approval by the GeneralMeeting of Shareholders.• Putting forward a proposal to the SupervisoryBoard with regard to the remunerationof individual members of the Board ofManagement (in accordance with theremuneration policy adopted by the GeneralMeeting of Shareholders).• Compiling the remuneration <strong>report</strong> on theremuneration policy pursued, subject toadoption by the Supervisory Board. Theremuneration <strong>report</strong> can be found on thewebsite www.boskalis.com under theCorporate Governance section.Activities during 2010The Remuneration Committee met six timesduring 2010, with none of the members of theRemuneration Committee having been absent fromthe meetings. The committee also held regularconsultations outside these meetings.In the course of 2010 the Remuneration Committeeconsidered whether the <strong>Boskalis</strong> remunerationpolicy is appropriate given current and expectedconditions on the Dutch market and whether itcomplies with Corporate Governance guidelines.Based on these considerations and in light of themerger with Smit Internationale N.V. completedin 2010 the Remuneration Committee advisedthe Supervisory Board to make a limited numberof adjustments to the remuneration policy. Theseadjustments, which will be explained further onin this <strong>report</strong>, will help to further enhance thedegree of transparency and accountability withregard to the policy. The Remuneration Committeewill continue to closely monitor developmentsin the Dutch market during 2011 and beyond,and consider whether any internal or externaldevelopments occur which require the policy to berevised.Amongst other activities the RemunerationCommittee:• kept itself up to date with the most recentdevelopments in Corporate Governance, bothin the Netherlands and internationally;• conducted a remuneration survey to informitself about developments with respect toexecutive remuneration policies in the Dutchand international markets (including amount,performance measures, composition ofremuneration package);• submitted an amendment proposal to simplifythe structure and calculation of the quantitativemeasures for short-term and long-termbonuses;• conducted scenario analysesRemuneration policy for the Board of ManagementThe remuneration policy for the Board ofManagement was adopted by the General MeetingRoyal <strong>Boskalis</strong> Westminster nv29
Summary Report of financial the Supervisory information Board2010of Shareholders on 8 May 2006. The remunerationpolicy is appropriate to the strategy and corevalues of <strong>Boskalis</strong>, which are centered on long-termorientation and continuity and take into accountthe interests of <strong>Boskalis</strong>’ shareholders, clients,employees as well as the ‘wider environment.’On the advice of the Remuneration Committee theSupervisory Board proposed to the ExtraordinaryGeneral Meeting of Shareholders on January 212011, that the remuneration policy adopted in 2006be revised.The reason for effecting a limited change to thecurrent remuneration policy lay in the structureand calculation of the quantitative measures forthe short-term and long-term bonuses. In practicethese have proved to be unnecessarily complicatedand based on insufficiently coherent valuationprinciples (Economic Value Added, hereinafterEVA). In addition, the change incorporated thelatest amendments to both the law and the DutchCorporate Governance Code, which are currentlyalready applicable to <strong>Boskalis</strong>.This proposal was adopted by the ExtraordinaryGeneral Meeting of Shareholders on 21 January2011.The rest of the remuneration policy has beenretained unchanged. The full text of the revisedremuneration policy can be found on the <strong>Boskalis</strong>company website (www.boskalis.com).Execution of the remuneration policy in 2010In 2010 the remuneration policy was executed inaccordance with the remuneration policy as adoptedby the General Meeting of Shareholders in 2006.Remuneration policy for the Supervisory BoardThe remuneration policy for the SupervisoryBoard was adopted by the General Meeting ofShareholders in 2007. During 2010 the remunerationpolicy was executed in accordance with the policyas adopted.The full remuneration <strong>report</strong> has been published onthe <strong>Boskalis</strong> website (ww.boskalis.com).Selection and Appointment CommitteeMembers of the Selection and AppointmentCommitteeThe Selection and Appointment Committeeconsists of two members: H. Heemskerk (chairman)and M. van der Vorm.Activities during 2010In 2010 the Selection and Appointment Committeemet once and also consulted by telephone.During the year under review the Selection andAppointment Committee discussed a balancedcomposition of the Board of Management, andalso assessed the size and composition of theSupervisory Board, bearing in mind the descriptionof the Board’s Profile and its retirement rota.In the year under review this involved thepreparation of the following selections andreappointments:In view of the expansion of the company withSmit Internationale N.V. the Supervisory Boarddecided to augment the Supervisory Board to sixmembers. The Supervisory Board simultaneouslyinformed both the shareholders and the WorksCouncil of the resulting vacancy. When it emergedthat the General Meeting of Shareholders didnot have any recommendations with regard tofilling the vacancy and the Supervisory Board’srecommendation had the full backing of the WorksCouncil, the Supervisory Board nominated Mr.Hazewinkel for appointment to the SupervisoryBoard. The selection of Mr. Hazewinkel was madein accordance with the Profile and was basedon Mr. Hazewinkel’s national and internationalexperience as well as the specific knowledgehe gained as chairman of the Supervisory Boardof Smit Internationale N.V. The ExtraordinaryGeneral Meeting of Shareholders of 17 March 2010appointed Mr. Hazewinkel to the Supervisory Board30 <strong>Annual</strong> Report 2010
Summary Report of financial the Supervisory information Board2010for a period of four years as per 27 March 2010.During the year under review <strong>Boskalis</strong> organized anintroduction program to the company forMr. Hazewinkel.The Selection and Appointment Committee alsodiscussed the reappointment of Mr. Kamps tothe Board of Management in the position of ChiefFinancial Officer. Mr. Kamps was first appointedto the post in 2006. The Supervisory Boardadopted the proposal to reappoint him and, havingsought the opinion of the Extraordinary GeneralMeeting of Shareholders on the matter, on 17March 2010 reappointed Mr. Kamps to the Boardof Management in the position of Chief FinancialOfficer for a four-year term.On 17 March 2010 the Supervisory Boardsubmitted the proposal to appoint Mr. Vree to theBoard of Management to the Extraordinary GeneralMeeting of Shareholders. In light of the merger withSmit Internationale N.V., it was considered that theaddition of Mr. Vree to the Board of Managementwould strengthen the Board’s expertise andexperience. Following consultation with theshareholders, the Supervisory Board appointedMr. Vree to the Board of Management for a periodof four years with effect from 1 April 2010.During the year under review the SupervisoryBoard formulated the company’s new CorporateGovernance policy and updated the company’sCorporate Governance documentation accordingly.The new Corporate Governance policy was put onthe agenda as a separate item for discussion bythe General Meeting of Shareholders on 12 May2010. The principal points of the policy can befound on pages 58 to 59 of this <strong>report</strong>.In the opinion of the Supervisory Board,the provisions of the Code regarding theindependence of the members ofthe Supervisory Board have been compliedwith. The Supervisory Board considersMr. M. van der Vorm to be non-independentin the sense of the Code.Outside the presence of the board members theSupervisory Board discussed the performanceof the Board of Management and its individualmembers as well as reviewing the performance ofthe Supervisory Board and its individual membersas measured against the Profile. This evaluationtook place during collective as well as bilateralmeetings between the Supervisory Board, thechairman of the Supervisory Board and theindividual members of the Board of Management.On 17 March the Supervisory Board decided toappoint Mr. M. van der Vorm vice-chairman of theSupervisory Board on the grounds of his extensiveexperience.Dutch Corporate Governance CodeSince the introduction of the Dutch CorporateGovernance Code (the ‘Code’) in 2004, theprinciples of proper corporate governance andbest practice provisions set out in the Code haveregularly been discussed at Supervisory Boardmeetings. A decree of 10 December 2009 declaredthe new Dutch Corporate Governance Code to beapplicable to annual <strong>report</strong>s relating to financialyears commencing on or after 1 January 2009.The Supervisory Board wishes to thank the Boardof Management and the company’s employeesfor their efforts during 2010 and extends itscompliments to them for the results achieved forthe year.Papendrecht / Sliedrecht, 16 March 2011Supervisory BoardMr. H. Heemskerk, chairmanMr. M. van der VormMr. H.J. HazewinkelMr. M.P. KramerMr. M. NiggebruggeMr. C. van WoudenbergRoyal <strong>Boskalis</strong> Westminster nv31
32Land reclamationThe site where the dredged material is brought ashore is called thelandfill. To achieve sufficient power and bearing capacity and be able touse as much of the material as possible calls for maximum cooperationbetween human effort, equipment and technology. Continuous researchat <strong>Boskalis</strong> on the best possible use of the material in the landfill cutsdown the number of shipping movements required. This has a positiveeffect on both efficiency and CO 2emissions.
Summary financial information 201034 <strong>Annual</strong> Report 2010
Report of the Board of ManagementMarket developments 36Financial performance 37Operational performance 46Corporate Social Responsibility 50Risk management 51Corporate Governance 58Outlook 60Statement of Directors’ responsibilities 6135
Summary Report of financial the Board information of Management 2010Market developmentsThe markets in which <strong>Boskalis</strong> operates are drivenby factors such as growth in world trade, energyconsumption, the global population and the effectsof climate change.This applies in particular to energy and commodityrelatedprojects in South America, West Africa andAustralia. Many of these projects are expected tocome onto the market in the next two years.Over the past few years we have been faced withstagnating demand as a result of the cyclicaldownturn at the end of 2008. At the same timewe have seen new production capacity comingonto the market in the past few years. This putspressure on both volumes and margins on newprojects and in certain sections of the market.However, recent market studies confirmed yetagain that structural growth factors for the mediumterm remain positive. In several regions of theworld, clients in various market segments aredeveloping numerous new initiatives for new and inmany cases large maritime infrastructure projects.The demand for harbour towage services isdeveloping positively. Freight volumes are pickingup after dropping off in 2009. The further growthof the terminal activities is connected to thecompletion of new oil and LNG import and exportterminals which are expected to come on streamfrom 2012. The development of the salvage marketis difficult to predict, given the nature of theactivities. Development at Transport & Heavy Liftis in particular dependent on an upturn in the spotmarket, especially the offshore spot market, whichis not expected to occur before 2012.36 <strong>Annual</strong> Report 2010
Report of the Board of ManagementFinancial performanceRoyal <strong>Boskalis</strong> Westminster N.V. achieved a record result in 2010, with net profit rising 36% to an all-time highof € 310.5 million (2009: € 227.9 million). Revenue growth of 23% to € 2.7 billion represented another newrecord (2009: € 2.2 billion). This exceptional performance was partly attributable to a very strong operationalyear as well as the contribution from Smit Internationale N.V. following the acquisition.The operating result (EBIT) rose by 61% to € 401.9 million (2009: € 249.3 million). Our core Dredging &Earthmoving activities achieved an exceptionally strong result, partly thanks to the good quality of the projectsin the order book, a successful operational year and the settlement of a number of projects. The result alsoincluded a pre-tax gain of € 33.6 million in connection with the settlement of a number of long-runninginsurance and other equipment-related claims. In addition, the operating result (EBIT) included a contributionfrom the SMIT business units of € 72.1 million, net of one-time acquisition-related expenses. The result fromthe SMIT activities was lower compared to the same period of last year.The total order book, including the SMIT order book, stood at € 3,248 million at the end of 2010 (end-2009:€ 2,875 million).Operational and financial developmentsIn 2010 <strong>Boskalis</strong> successfully completed theacquisition of Smit Internationale N.V. by meansof a public offer. The SMIT results over the firstquarter were recognized as ‘result of associatedcompanies’ based on the pro rata shareholding.From the second quarter onwards the activities ofthe SMIT group companies were fully, and those ofthe joint ventures proportionately, consolidated inthe results.Revenue by market(in millions of euros) 2010 200992651482961,801Dredging & Earthmoving 1,801 1,814Harbour Towage 155 —Salvage, Transport & Heavy Lift 296 —Terminal Services 148 60Maritime Infrastructure 265 301Non-allocated group costs 9155Group 2,674 2,175bewerkt voor JV2010Revenue by geographical area(in millions of euros) 2010 2009228370348517585The Netherlands 517 316Rest of Europe 585 432Australia / Asia 626 370Middle East 370 662Africa 228 164North and South America 348 231626Group 2,674 2,175bewerkt voor JV2010Royal <strong>Boskalis</strong> Westminster nv37
Report of the Board of ManagementHighlights of 2010Record profit of € 311 millionRecord revenue of € 2.7 billionOrder book steady at high level: € 3.2 billionEarnings per share € 3.11; proposed dividend€ 1.24 per shareRevenueRevenue in the year under review rose by 23% to€ 2.7 billion. SMIT contributed € 533 million torevenue; excluding the SMIT consolidation effect,revenue was € 2.1 billion (2009: € 2.2 billion).The generally good quality of the projects inthe order book at the beginning of 2010 andthe largely successful execution of thoseprojects combined with optimum deployment ofequipment, along with a positive settlement of anumber of projects which had been technicallyconcluded earlier all combined to propel the EBITmargin in the Dredging & Earthmoving segmentto a high level. In addition the result includes apre-tax amount of € 33.6 million arising from thesettlement of a number of long-running insuranceand other equipment-related claims. The SMITactivities contributed a total of € 72.1 million tothe operating result, net of one-time acquisitionrelatedexpenses.SMIT’s contribution to the result can be dividedinto a number of operational and acquisitionrelatedcomponents:EBITDAGroup earnings before the result of associatedcompanies, interest, tax, depreciation, amortizationand impairments (EBITDA) rose 40% to € 622 million(2009: € 445 million). The SMIT activities contributed€ 152 million to the EBITDA result, excluding nonrecurringmerger costs.Operating result (EBIT)The operating result (EBIT) increased by 61% to€ 402 million (2009: € 249 million). This result alsoincludes several extraordinary items in the Dredging &Earthmoving segment.Segment results(in millions of euros) 2010 2009Dredging & Earthmoving 320.5 216.6Harbour Towage 23.2 —Salvage, Transport & Heavy Lift 43.0 —Terminal Services 22.3 28.8Maritime Infrastructure 28.9 12.9Non-allocated group costs -36.0 -9.0• the contribution resulting from the operationalactivities of which € 3.6 million relating tothe first quarter, recognized as ‘result ofassociated companies’, and€ 72.1 million relating to the period from thesecond quarter onwards, recognized in theoperating result. From the second quarteronwards the activities of SMIT were fullyconsolidated;• non-recurring expenses of € 21.3 millionchargeable to the operating result, accountedfor as ‘non-allocated group costs’. Thesecosts, incurred by both SMIT and <strong>Boskalis</strong>,were connected to the acquisition andarrangement of the related financing, as wellas the integration;• a non-cash gain of € 17.3 million from therevaluation of the 29.98% stake in SMIT priorto the bid being declared unconditional. Thisrevaluation gain, representing the differencebetween the valuation of the stake basedGroup 401.9 249.338 <strong>Annual</strong> Report 2010
Financial performanceon the offer price and the book value, wasrecognized as ‘result of associated companies’;and• one-time financing charges of € 12.3 million.Net profitThe operating result achieved amounted to€ 402 million, including the aforementioned€ 21.3 million in one-time items. Excluding overallfinancing charges of € 36.8 million (of which€ 12.3 million were non-recurring) and a result of€ 25.0 million from associated companies (of which€ 20.9 million consisted of SMIT’s share in the resultfor the first quarter and a one-time gain), profit beforetaxation equaled € 390 million. Net profit attributableto shareholders totaled € 311 million (2009:€ 228 million).Order bookOrder intake in 2010 was € 2.1 billion, broadly spreadaround the world and across the various marketsegments. In addition, as a result of the acquisitionof SMIT the contracts held by SMIT were valuedand added to the order book. At end-2010 thesecontracts represented a (revenue) value of€ 494 million.The total order book was worth € 3,248 million at theend of 2010 (end-2009: € 2,875 million).Order book(in millions of euros) 31 Dec 10 31 Dec 09Dredging & Earthmoving 1,923 2,223Harbour Towage — —Salvage, Transport & Heavy Lift 162 —Terminal Services 677 289Maritime Infrastructure 486 363Group 3,248 2,875Dredging & EarthmovingConstruction and maintenance of ports and waterways,land reclamation, coastal defense and riverbankprotection, dry earthmoving, offshore services to the oiland gas industry, soil improvement and underwater rockfragmentation.(in millions of euros) 2010 2009Revenue 1,801 1,814Operating result 321 217Order book 1,923 2,223RevenueRevenue in the Dredging & Earthmoving segmentamounted to € 1,801 million (2009: € 1,814 million).Order book by market(in millions of euros) 2010 2009Home markets in Europe 572 527Home markets outside Europe 118 99International projects 873 948Specialist niche services 238 240Total 1,801 1,814Home marketsRevenue in the home markets totaled € 690 million (2009:€ 626 million).Revenue in the European home markets (the Netherlands,Germany, United Kingdom, Nordic countries) rose by 9%to € 572 million (2009: € 527 million). Projects contributingto this revenue included in the Netherlands Maasvlakte 2,dredging work connected with the construction of the GateLNG Terminal and various coastal protection projects, aswell as several maintenance projects on ports and waterwaysin the other home markets. The home markets of theNetherlands and Germany experienced a strong year, withNordic also posting a strong second half after a difficult firsthalf. In the United Kingdom the volume of work declined asa result of clients’ reluctance to award new projects.Royal <strong>Boskalis</strong> Westminster nv39
Report of the Board of ManagementRevenue in the home markets outside of Europe (Nigeriaand Mexico) rose 19% to € 118 million (2009: € 99 million),with the growth being attributable to the Cuyutlánproject in Mexico. The project involves the constructionof an LNG import terminal on the west coast of Mexico,including the deepening of an existing lagoon. Thevolume of work in Nigeria was slightly lower, a reflectionof reluctance by major oil companies over the past yearto engage in new investments in this region.International project marketRevenue on the international project market declinedby 8% to € 873 million (2009: € 948 million). After thecompletion of various large projects in the MiddleEast, the geographical focus of the projects shiftedto Australasia, and Central and South America. Forexample, last year saw the completion of the KhalifaPort project in Abu Dhabi, while a lot of work wascarried out on the Gorgon project in Western Australiaand four islands in the Maldives were protected againstthe consequences of climate change. Overall, revenueremains geographically well spread and there is abalanced spread across the various market segments.Specialist niche servicesThe specialist niche services generated revenue of€ 238 million, virtually the same as in the previous year(2009: € 240 million). Revenue was generated by workincluding offshore (pipeline) projects in Europe andSouth America. In addition 2010 saw the Fox Riverproject, involving the remediation of PCB-contaminateddredging spoil from the Fox River in Wisconsin (UnitedStates), enter its second year.The utilization rate of the cutter fleet fell back as aresult of maintenance work and fewer deploymentopportunities in comparison to previous years. Theaverage utilization rate was 27 weeks, compared to36 weeks in 2009.Last December <strong>Boskalis</strong> and the insurers reachedagreement on the repurchase by <strong>Boskalis</strong> of thetrailing suction hopper dredger W.D. Fairway.Following payment of the ‘constructive total loss’claim the insurance companies had acquiredownership of the vessel. <strong>Boskalis</strong> is currentlyconducting a thorough inspection of the ship andinvestigating the possibility of recommissioning it.Segment ResultThe operating result (EBIT) of the Dredging &Earthmoving segment totaled € 321 million (2009:€ 217 million). This exceptionally strong result wasattributable to the generally good quality of theprojects in the order book at the beginning of 2010and the largely successful execution of those projectscombined with optimum deployment of equipment,along with a positive settlement of a number ofprojects which had been technically concludedearlier. In addition the result includes a pre-taxamount of € 33.6 million arising from the settlementof a number of long-running insurance and otherequipment-related claims.Order bookNew order intake in 2010 amounted to€ 1,501 million.Fleet developmentsThe revenue was realized with good equipmentutilization levels. The hopper fleet was expanded withthe commissioning of the 12,000m 3 Gateway in March,the 4,500m 3 Shoalway in April and the12,000m 3 Willem van Oranje in September. In 2010 thehopper fleet achieved an annual utilization rate of 43weeks (2009: 48 weeks).Order book by market(in millions of euros) 31 Dec 10 31 Dec 09Home markets in Europe 628 843Home markets outside Europe 133 77International projects 965 1,132Specialist niche services 197 171Total 1,923 2,22340 <strong>Annual</strong> Report 2010
Financial performanceIn the oil and gas market additional work wascontracted on the Nord Stream project for theprotection of sections of the gas pipelines to be laidbetween Russia and northern Germany as well asextra trenching work in the Bay of Pomerania. <strong>Boskalis</strong>was also awarded the contracts for the second phaseof the dredging work for the construction of the LNGimport terminal in Cuyutlán (Mexico), the constructionof an LNG import port in Swinoujscie (Poland) andthe expansion of the Soyo LNG port in Angola.Significant additional work was also contracted onthe Gorgon project (Australia), where work started inearly 2010. At the end of August <strong>Boskalis</strong> was askedto assist in protecting the coast of Louisiana (UnitedStates) against the oil slick caused by the disasterwith the Deepwater Horizon rig. The <strong>Boskalis</strong> trailerhopper suction dredger Stuyvesant, which sailsunder the American flag, was the first American trailerhopper suction dredger to be deployed and helpedto construct a long sand berm to protect vulnerableswamps around New Orleans from oil pollution. Finally,just before the end of the year, the company wasawarded the ‘sand motor’ project in the Netherlands.This project involves creating a sand motor consistingof 21.5 million cubic meters of sand, deposited in theshape of a hook attached to the coast. Wind, wavesand sea currents will gradually distribute the sandalong the coast of the province of Zuid-Holland. In thisway the sand motor contributes in a natural way tocoastal safety, whilst at the same time creating morespace for both nature and recreational purposes.At the end of 2010 there was an order backlog of€ 1,923 million (end-2009: 2,223 million).Harbour TowageBerthing and unberthing of oceangoing ships, providingassistance to special objects and port servicesRevenue<strong>Boskalis</strong> is active in this segment through SMITHarbour Towage (consolidated from the secondquarter of 2010). In 2010 Harbour Towage sawa recovery from the recession with an increasein activities at its most important locations:Rotterdam, Belgium, Panama and Canada.Container line shipping in particular postedan increase activities at various locations. InBelgium this recovery was clearly visible in theports of Ghent and Zeebrugge, although revenuedevelopment in the port of Antwerp lagged behindas a result of a less rapid recovery of volumesand increased local competition. Revenue in thefinal three quarters of 2010, including the pro rataconsolidation of joint ventures, was € 155 million.Segment resultThe operating result was € 23.2 million, with goodresults being achieved once again by the jointventures in Singapore (Keppel SMIT Towage andMaju). Rebras, the joint venture in Brazil, alsoposted a good result. In mid-2010 we announcedthat <strong>Boskalis</strong> SMIT had reached an agreementin principle to acquire the remaining 50% stakein Rebras (Rebocadores do Brasil SA). Thistransaction was completed recently.Salvage, Transport & Heavy LiftSalvage: emergency response, wreck clearance,environmental care and consultancyTransport: chartering, hiring out work vessels,heavy transport and (ocean) towage servicesHeavy Lift: lifting work, maritime projects, marinesupport and subsea activities(in millions of euros) 2010*(in millions of euros) 2010*Revenue 155Operating result 23.2Revenue 296Operating result 43.0Order book 162* SMIT activities included from the second quarter onwards* SMIT activities included from the second quarter onwardsRoyal <strong>Boskalis</strong> Westminster nv41
Report of the Board of ManagementRevenue<strong>Boskalis</strong> is active in this segment through therelevant SMIT activities. Revenue in the finalthree quarters of 2010, including the pro rataconsolidation of joint ventures, was € 296 million.Despite a quiet second quarter, by the end of2010 Salvage was able to look back on a busyyear. The workload for emergency response wasrelatively low during the past year. By contrast,there was a lot of work in wreck clearance. In theGulf of Mexico the salvage of a sunken oil platformwas successfully completed, whilst work gotunderway off the coast of Indonesia to salvagethe sunken car carrier Hyundai 105. The wreck isbeing sawn into sections which are subsequentlyremoved. Finally, in India work started on salvaginga container ship which started listing heavily aftera collision and eventually ran aground in shallowwaters off the coast. Very recently the SMITsalvage team succeeded in refloating the ship andthe project is expected to be completed within thenext few weeks.Traditionally the Transport and Heavy Lift activitiesoperate largely on spot contracts for the oil andgas industry. Due to restricted maintenancebudgets and delayed investments in new activitiesby oil and gas companies both the workload andin particular price levels came under pressure in2010. The activities in the North Sea were affectedmost, while the level of activity in and aroundSingapore and South Africa held up reasonablywell thanks to medium- and long-term contracts.Segment resultThe operating result, including the pro rataconsolidation of joint ventures, was € 43.0 million.Terminal ServicesTowage and mooring services, surface and subsurfacemaintenance and associated maritime and managementservices for onshore and offshore oil and gas terminals(in millions of euros) 2010* 2009Revenue 148 60Operating result 22.3 12.9Order book 677 289* SMIT activities included from the second quarter onwardsRevenueIn 2010 <strong>Boskalis</strong> was active in Terminal Services viaSMIT Terminals (consolidated from the second quarterof 2010) and through its 50% stake in strategic partnerLamnalco. In 2010 the revenue from Terminal Servicesrose to € 148 million. Excluding the contribution fromSMIT Terminals revenue in 2010 amounted to€ 75.8 million (2009: € 60.0 million).About one-third of the revenue growth at Lamnalco wasattributable to currency effects, but the growth alsoreflected an increase in activities. For example, in 2010a start was made on the new contract for CPC in theRussian Black Sea nearby Novorossiysk.At SMIT Terminals two contracts were not extended in2010 (in Nigeria and Pakistan), but the performance onthe other (long-term) contracts was good.Segment resultThe operating result rose to € 22.3 million. Excludingthe contribution from SMIT Terminals the resultincreased to € 16.4 million (2009: € 12.9 million). Dueto continued weakness in the spot market for terminalservices certain regions are experiencing temporaryunderutilization of tugs.Order bookThe order book in this segment declined in thesecond half to € 162 million (half year 2010:€ 191 million).Order bookThe volume of the order book rose substantiallycompared to the end of 2009 as a result of the additionof SMIT Terminals. At the end of 2010 the order book42 <strong>Annual</strong> Report 2010
Financial performancestood at € 677 million. Excluding the recently addedorder book of SMIT Terminals the Terminals Servicesorder book (50% stake in Lamnalco) rose to€ 345 million (end-2009: € 289 million).as a result of new contracts in the Middle East as wellas currency effects. The value of the order book at theend of the <strong>report</strong>ing period was € 486 million (end-2009: € 363 million).Maritime InfrastructureMaritime infrastructure-related facilities, including theconstruction of quay walls, berths, breakwaters, waterpurification plants, sewer systems, dams and bridges.Industrial construction including power stations anddesalination plants(in millions of euros) 2010 2009HoldingNon-allocated head office activities(in millions of euros) 2010* 2009Revenue 9.1 —Operating result -36.0 -9.0* SMIT activities included from the second quarter onwardsRevenue 265 301Operating result 28.9 28.8Order book 486 363RevenueRevenue in the Maritime Infrastructure segment isgenerated through our strategic partner Archirodon, inwhich we hold a 40% stake. Our share in Archirodon’srevenue amounted to € 265 million in 2010 (2009:€ 301 million). As a result of the changed marketconditions in the Middle East, where there hasbeen a sharp rise in competition, combined withArchirodon’s selective contracting policy, revenuein 2010 was somewhat lower than the record levelsachieved in 2009. In 2010 Archirodon completed thearchitecturally impressive Sheik Zayed bridge in AbuDhabi (UAE), as well as Abu Dhabi’s new offshoreKhalifa Port, which was realized in conjunction with<strong>Boskalis</strong> and Hyundai.Segment resultArchirodon’s contribution to the operating resultremained stable at € 28.9 million (2009:€ 28.8 million).Order bookThe order book rose compared with end-2009 levelsSegment resultThe operating result for the period under reviewcomprises the customary non-allocated costs ofthe <strong>Boskalis</strong> and SMIT head offices. It also includesone-off expenses equalling € 21.3 million connectedwith the acquisition and integration of SMIT. No furthermaterial merger-related costs are expected in theperiod after 2010.Other financial informationIn 2010 total depreciation, amortization andimpairments came to € 220 million (2009: € 196 million,including a € 48.6 million impairment charge relatingto the fleet rationalization program). The increase iswholly attributable to the consolidation of SMIT.The result from associated companies equaled€ 25.0 million and consisted mainly of the pro ratashare (28%) in the result of Smit Internationale N.V.for the first quarter of 2010 (€ 3.6 million) and anexceptional gain of € 17.3 million relating to therevaluation of the stake in SMIT immediately prior tothe offer being declared unconditional. This revaluationresult represents the difference between the valuationof the stake based on the offer price and the bookvalue. In 2009 the result from associated companiestotaled € 58.3 million, and consisted mainly of anRoyal <strong>Boskalis</strong> Westminster nv43
Report of the Board of Managementextraordinary gain on the stake in SMIT and<strong>Boskalis</strong>’ share in SMIT’s full-year result.been raised to partly finance the acquisition ofSMIT.The tax burden rose to € 77.1 million (2009:€ 66.0 million), while the effective tax rate fell to19.8% (2009: 22.4%).Return on equity in 2010 amounted to 21.7% (2009:21.1%).Capital expenditure and balance sheetA total amount of € 330 million was invested in2010. Major investments included the constructionof two 12,000m 3 hoppers (Gateway and Willemvan Oranje), a 4,500m 3 hopper (Shoalway), a newbackhoe (Baldur), the construction of a fallpipevessel and the repurchase of the W.D. Fairway(35,500m 3 hopper). The Gateway, Willem van Oranje,Shoalway and Baldur were all taken into serviceduring the year under review. In addition, someadjustments were made to the Taurus (self-propelledcutter), ahead of further modifications to the ship.The group invested in 25 new vessels for SMIT’sterminal services and harbour towage activities.Furthermore, one of the Taklift floating sheerlegsbelonging to the heavy lift activities was upgraded,with a life extension program being carried out atthe same time.At € 93 million, capital expenditure commitments at31 December 2010 were lower than a year earlier(end-2009: € 182 million).Cash flow increased to € 532.5 million (2009:€ 424.9 million).The cash position at the end of 2010 stood at€ 358 million, of which € 203 million was freelyavailable and € 155 million was tied up inassociated companies and projects being executedin conjunction with third parties.The company’s solvency ratio was 37.1% at 31December 2010. At the end of 2009 the solvencyratio was 46.5% as a result of the equity that hadInterest-bearing debt totaled € 808 million at 31December 2010 and the net debt position stoodat € 450 million. The majority of the debt positionconsists of long-term USPP loans and drawingson the three- and five-year bank facility taken out,partly in connection with the financing of the SMITacquisition. <strong>Boskalis</strong> must comply with variouscovenants agreed with the syndicate of banksand the USPP investors. At 31 December 2010it comfortably met these agreements. The maincovenants relate to the net debt / EBITDA ratio,with a limit of 3, and the EBITDA / net interest ratio,with a minimum of 4. At 31 December 2010 the netdebt / EBITDA ratio stood at 0.9 and the EBITDA /net interest ratio at 17.5.US Private PlacementIn July 2010 <strong>Boskalis</strong> placed a US PrivatePlacement loan amounting to USD 450 millionwith 26 institutional investors in the UnitedStates and the United Kingdom. The substantiallyoversubscribed placement consisted of threetranches, with maturities of 7, 10 and 12 years. Theproceeds in US dollars and pounds sterling wereswapped to euros for a total amount of€ 354 million. The weighted average annualinterest rate is 4.76%. The proceeds of the privateplacement were used to repay the existing bridgefacility taken out for the partial financing of theacquisition of Smit Internationale N.V.Dividend policy and proposalThe main principle of the <strong>Boskalis</strong> dividendpolicy is to distribute 40% to 50% of net profitfrom ordinary operations as dividend, whereby<strong>Boskalis</strong> aims to achieve a stable developmentof the dividend for the longer term. The choice ofdividend form (in cash and/or entirely or partly inshares) takes into account the company’s desiredbalance sheet structure as well as the interests ofshareholders.44 <strong>Annual</strong> Report 2010
Financial performanceIn light of this, <strong>Boskalis</strong> will propose to the <strong>Annual</strong>General Meeting of Shareholders on 12 May 2011that a dividend of € 1.24 per share be distributed inthe form of ordinary shares, unless the shareholderopts to receive a cash dividend. The dividend willbe payable from 8 June 2011.and such like. The first synergy effects alreadybecame visible in 2010 with savings of around€ 10 million. We have therefore decided to raise oursynergy target. Based on the synergies achievedto date we now expect the annual level to reacharound € 25 million in the next two years.Other developmentsIntegration of SMITOn 27 March 2010 the merger with SMIT was afact. Right from the start a lot of work has gone intoshaping and substantiating the cooperation. Shortlyafter the merger a Steering Committee was set upcomprising the senior management of <strong>Boskalis</strong> andSMIT, including the Board of Management. TheSteering Committee heads up 10 working groups of<strong>Boskalis</strong> and SMIT employees who have analyzedwhere the joint synergy opportunities lie, both in themarket and on the cost side, and how these canbe realized. They have exchanged best practicesand established which corporate staff activities andfunctions will be integrated. This analysis providesthe basis for the integration plan which will befurther implemented during 2011 and 2012.The two companies are already turning to eachother, for example when it comes to hiring eachother’s equipment, which results in cost synergieson the projects. This is happening for example onthe Maasvlakte 2 project in the Netherlands, whereSMIT equipment is being deployed by the PUMAconsortium. In addition <strong>Boskalis</strong> survey equipmentis in use on SMIT salvage projects in both Indonesiaand India.On releasing our half-year results we expected torealize annual synergies of € 15-20 million, mainly inthe form of cost savings, in the period 2011-2013.However, the synergies achieved to date are greaterthan expected. The combined purchasing powerof <strong>Boskalis</strong> and SMIT is creating more favorableconditions in procurement relating to the primaryprocesses, such as engine parts, lubricants, hiredservices, as well as in non-technical categoriessuch as insurance, office space, travel expensesNew Corporate Business PlanA new Corporate Business Plan has been draftedto create focus and cohesion within the group inits new composition, and to enable us to set theright priorities with regard to the various investmentopportunities. On Tuesday 5 April 2011 <strong>Boskalis</strong>will present this strategy update at the <strong>Boskalis</strong>Capital Market Day and information regarding thenew strategy will be made available on the website.Event after the balance sheet dateRebras: At the publication of our semi-annualresults we announced that a conditional agreementhad been reached to increase the stake in theBrazilian Harbour Towage joint venture Rebras(Rebocadores do Brasil SA) from 50% to 100%.This transaction was completed recently.SMIT has been active in Brazil since 2006 whenthe joint venture with Rebras was first established.The volume of sea trade has grown significantlyin Brazil and the country has substantial offshoreinvestment plans that will further drive the demandfor towage services.Rebras currently provides services at the followingsix locations in Brazil: Santos, Paranaguá, Sepetiba(Itaguaí), Angra dos Reis, São Luis (Itaqui & Pontada Madeira) and Vitória (Tubarão & Praia Mole). Thecompany operates a fleet of 18 state-of-the-artASD (azimuth stern drive) tugs of 50-70 tons bollardpull, with another three tugs having been hired out.Almost all the 200 crew and staff members are ofBrazilian nationality, thus giving <strong>Boskalis</strong> a trulylocal footprint in the Brazilian growth market.Royal <strong>Boskalis</strong> Westminster nv45
Report of the Board of ManagementOperational performanceIn 2010 much attention was focused on preparing for the integration of the SMIT activities. Our CSR <strong>report</strong>deals with this in more detail. Our CSR <strong>report</strong> also provides a detailed account of all aspects of our SHE-Qand HR policy as well as the environmental measures being taking to lower emissions and the energyconsumption by our fleet. Furthermore you can read how we seek to prevent or mitigate the environmentalimpact of our activities through innovative developments and the dissemination of knowledge and expertise.Safety, Health, Environment and Quality (SHE-Q)In July 2010 <strong>Boskalis</strong> launched its new safetyprogram amongst its staff. The name of the programreveals its objective: No Injuries, No Accidents - or‘NINA’ for short. Whilst our safety performancehas improved sharply over the past 10 years,<strong>Boskalis</strong> wants to take another leap forward. Aninternational culture survey amongst employees,interviews with clients and a large number ofin-house workshops revealed which areas offerscope for further improvement by <strong>Boskalis</strong>. Theopportunities lie mainly in the area of building ashared safety culture that is based on values. The<strong>Boskalis</strong> safety culture rests on five values andfive rules which are communicated both internallyand externally. With a strong personal element,the values appeal directly to the employees’ senseof responsibility for both their own behavior andthat of others. The rules are mainly there to backup the values and are aimed at the prevention ofincidents, primarily through risk management.NINA training courses allow management andstaff to familiarize themselves with the new valuesand rules. <strong>Boskalis</strong>’ senior management, whichbroadly supports NINA, attended the first coursein the summer of 2010. Between September andthe end of the year around 1,000 employeesattended a NINA course or workshop at variouslocations around the world. Following the trainingcourses, start-up meetings were held on projectsand on board our vessels in order to translatethe ‘values and rules’ into everyday practice.LTIFReporting, recording and following up on incidentsform an integral part of the safety systems within<strong>Boskalis</strong>. The SHE-Q department coordinates thisprocess and maintains contact on the subject withthe management concerned. Following an incidentor an analysis of incidents the department mayissue an advice on possible measures to corrector improve the situation. The incident <strong>report</strong>s areconveyed as ‘Lost Time Injury Frequency’ (LTIF).The LTIF figure expresses the number of incidentsresulting in sick leave for every 200,000 hoursworked. <strong>Boskalis</strong> is one of the few market partiesto include incident <strong>report</strong>s from its subcontractorsin its LTIF counts. In 2010 LTIF at <strong>Boskalis</strong> was0.67 (2009: 0.74). For a detailed analysis of LTIFin 2010 and historical figures for the past fiveyears, please refer to the 2010 CSR Report.Personnel & OrganizationOver the last few years RBW’s training programshave been strongly focused on developing the skillsand competencies appropriate to achieving thequality that RBW wants to deliver. A full summarycan be found in our CSR <strong>report</strong>.One of the first joint HR initiatives by <strong>Boskalis</strong>and SMIT was the design of a new <strong>Boskalis</strong>/SMITLeadership Development Program. The program waslaunched for 20 talented senior-managers from bothcompanies on 1 January 2011.In 2010 <strong>Boskalis</strong> added a few more new courses tothe program.September 2010 saw the launch of the MaritimeLeadership Course at <strong>Boskalis</strong>. Specially developedfor an international group of first officers, chiefengineers and recently appointed captains,this international program focuses on personaleffectiveness on board, leadership, communications46 <strong>Annual</strong> Report 2010
Operational performanceand cooperation. The 12 participants are mainlyfrom the Baltic states and Russia.The <strong>Boskalis</strong> Homemarket Development Programwas developed for project workers and managersinvolved in projects led from <strong>Boskalis</strong>’ Europeanoffices. As well as leadership skills and puttingthem into practice, key areas covered in theprogram include commercial skills and contractmanagement. By bringing together people fromdifferent countries <strong>Boskalis</strong> hopes to bridge culturaldifferences and to strengthen mutual synergiesand internal networks. Shipbuilding for Dredgersis another new course launched in 2010. <strong>Boskalis</strong>technical staff who are involved in designing,building or rebuilding or the technical aspects ofoperating a ship are introduced to a wide range ofshipbuilding aspects relevant to the fleet.In the spring of 2010 the new International DredgingAcademy was launched for <strong>Boskalis</strong> engineers anddeck officers.SMIT makes targeted investments in the instructionand training of both its crews and members ofthe onshore organization. Examples include theTugmaster Training Program it has developedin-house to train crew members from around theworld to become tugboat captains, and the trainingcourse in Contracting organized for onshore staffin 2010 aimed at further improving the quality ofcontracts entered into.WorkforceAt the end of 2010, the total number of peopleemployed by the Group was 13,832. ExcludingSMIT, Lamnalco and Archirodon we employed 4,674(2009: 4,858). This is a decline of 4%.Works CouncilsCommunications with the Works Councils of<strong>Boskalis</strong> and SMIT were intensive in 2010. At theend of September both works councils issued apositive advice on the integration plan.The Works Councils’ approach and the way inwhich they fulfilled their duties are very muchappreciated.EquipmentThe modernization of the <strong>Boskalis</strong> fleet isproceeding according to plan. In 2010 the trailingsuction hopper dredgers Gateway, Shoalwayand Willem van Oranje were taken into service,along with the backhoe Baldur. The Willem vanOranje was named and launched by Her MajestyQueen Beatrix on 10 February 2010 in a ceremonywhich commemorated the 100th anniversary ofthe company. In 2010 progress was made withthe construction of the new fall pipe vessel. Theself-propelled jumbo cutter Taurus was modified andthe mega hopper W.D. Fairway was repurchasedfrom the insurance companies. As part of the fleetrationalization program announced in 2009 the W.D.Medway II, a trailing suction hopper dredger witha capacity of 3,513 cubic meters, was taken out ofservice and dismantled using an environmentallyfriendly procedure which is described in our 2009CSR <strong>report</strong>.In 2010 the new version of the Maximo maintenancesystem was further rolled out across the <strong>Boskalis</strong>fleet. The system is one of the cornerstones of ValueDriven Maintenance, our maintenance control toolthat allows us to arrange the maintenance processmore accurately and to optimize the availability ofour vessels.During 2010 a total of 25 new SMIT units weredelivered, mainly as part of a fleet renewal drive andexpansion in the Harbour Towage, Terminal Servicesand Transport & Heavy Lift activities. The companytook delivery of new build comprising 20 tugboatswith a bollard pull ranging from 45 to 80 tonnes, twomultipurpose work vessels (95 tbp), a smaller workvessel (28 tbp) and two transport pontoons.Six of the tugboats taken delivery of were destinedfor the 50%-owned venture Keppel SMIT Towage inSingapore.Research and development<strong>Boskalis</strong> makes targeted investments in the researchand development of new and innovative workingmethods and information technology. This enablesthe company to meet the challenges associated withcomplex large-scale projects.Royal <strong>Boskalis</strong> Westminster nv47
Operational performance• EchoscopeOn several projects <strong>Boskalis</strong> uses an Echoscope,a camera which can take acoustic underwaterimages. This new technology allows accuratepictures of the seabed to be taken, even whenturbidity is high. The camera is used for exampleon projects which require the removal or accurateplacing of large blocks of stone. <strong>Boskalis</strong> usesthe camera on the Maasvlakte 2 project whenremoving blocks from the existing sea wall; theimages are integrated into the automated dredgingprocess, enabling the lifting work to be carried outquickly and efficiently and without mistakes.• Blockbuster operating softwareWe use the Blockbuster to place the blocks inthe hard sea wall of Maasvlakte 2. Thanks toits unique construction this ‘E-crane’ is ableto lift blocks weighing 50 tonnes and movethem across a distance of up to 63 meters. Thetechnical adjustments needed to achieve this werethe brainchild of an employee in the DredgingDevelopment Department, which is responsiblefor technology development at <strong>Boskalis</strong>. Anotherin-house development by <strong>Boskalis</strong> is theadvanced operating system which enables theBlockbuster to place the blocks in the new seawall with great precision. The software factors inthe size of the rocks and ensures that the craneis able to place them quickly and efficiently bypresenting them in the correct position.In 2010 SMIT was involved in various projectsfocused on three different areas: Environment, Safetyand Equipment. In the area of Environment the E3Tug (hybrid and diesel-electric tugboat), H3T/GreenTug (hydrogen-fuelled hybrid tugboat) and the LNGTug projects involve researching solutions aimedat finding more environmentally friendly ways ofpowering tugboats.Other studies are aimed at the development anduse of simulation programs in order to enhancesafety, assess feasibility more accurately and deployequipment more efficiently. More detailed informationon these projects can be found in the CSR <strong>report</strong>.48 <strong>Annual</strong> Report 2010
Verslag van de Raad van BestuurSMIT Heavy Lift installing a 220 meter long section forthe Brandangersund Bridge in Norway. Taklift 4 andTaklift 7 used a tandem lift to successfully place the1,860 ton section of the arch bridge.Royal <strong>Boskalis</strong> Westminster nv49
Report of the Board of ManagementCorporate Social ResponsibilitySustainable and responsible enterprise is an integral part of the way in which we conduct our business.In our Corporate Social Responsibility (CSR) <strong>report</strong> we provide details of our economic, social andenvironmental performance in line with the international guidelines set out in the Global Reporting Initiative(version G3). After publishing our first CSR <strong>report</strong> in 2010, we have broadened the scope of the 2010 <strong>report</strong>in line with our ambitions. In addition to the <strong>Boskalis</strong> activity Dredging & Earthmoving this <strong>report</strong> includesthe activities of our 50%-owned associate company Lamnalco (Terminal Operations). The CSR <strong>report</strong> can befound on the corporate website www.boskalis.com.Artist impression of Sand MotorAt the end of 2010 the contract to realize the Sand Motor and further elaborate the design was awarded to a group of contractors including <strong>Boskalis</strong>. The Sand Motor is a new,innovative form of coastal defense, which uses natural forces such as tide, currents and waves to deposit sand for coastal replenishment.50 <strong>Annual</strong> Report 2010
Summary Report of financial the Board information of Management 2010Risk managementStrategic and market risks<strong>Boskalis</strong>’ strategy is aimed at being prepared forboth opportunities and challenges in the market.The strategy is focused on profitable growth inattractive market segments as well as expanding andreinforcing the core business.The <strong>Boskalis</strong> markets are heterogeneous and oftendevelop differently. In most cases, the (ultimate)clients are national, regional, and local governments,or associated institutions such as port authoritiesor private port operators, major international oiland gas companies and other large private clientssuch as container shipping companies and miningcompanies. Our markets are mainly driven by longtermeconomic factors, such as growth of the globalpopulation, the expansion of the global economyand the growth of international trade and transportvolumes, particularly over water. The long-termprospects for these factors are favorable.In the shorter term, factors outside our control mayhave a negative impact on our markets, despite thelong-term growth trends. These include general orregional geopolitical developments, such as politicalunrest, regime changes, government-imposed tradebarriers, financial markets turmoil or crises in thefinancial sector, and similar developments. Suchdevelopments may negatively affect our activities incertain regions or even globally if they have majornegative consequences for the global economy or forexploration and exploitation activities in the energyproducts and commodities markets. <strong>Boskalis</strong> aimsto respond as effectively as possible to both positiveand negative developments in individual marketsegments through a global spread of its activities, anextensive, versatile and internationally based fleet,and strong positions in the home markets. Moreover,our activities are largely focused on the maintenanceand development of infrastructure, which means thatlonger-term developments will generally outweighshort-term economic fluctuations.<strong>Boskalis</strong> does not include contracts in the orderbook until agreement has been reached with theclient. Although historically speaking cancellations orsubstantial reductions in the size of contracts afteragreement has been reached have been relativelyrare, such cancellations or substantial reductions ofwork in portfolio cannot be ruled out. In the wakeof such a cancellation or substantial reduction,losses may arise from the unwinding or settlementof the financial derivatives taken out to cover therelated currency risks and/or fuel cost risks but forwhich the underlying transaction or cash flows willno longer be realized. As part of implementing itsstrategy, <strong>Boskalis</strong> acquires other companies. Inorder to be able to realize the anticipated results,<strong>Boskalis</strong> attaches great importance to integratingsuch acquisitions with care. Creating value for ourstakeholders and retaining key personnel are animportant part of this process.<strong>Boskalis</strong> deals with large, internationally operatingcompetitors as well as more regional or localcompetitors with activities restricted to one or severalsubmarkets. In most cases, projects and servicecontracts are brought to the market using publicor private tender procedures. With the majority ofcontracts, competition is price-based. However,clients - primarily in the oil and gas industry andprivate port operators - are increasingly taking otherfactors, including qualitative ones, into considerationwhen awarding contracts. <strong>Boskalis</strong>’ activities arecapital-intensive, with dredging in particular beinga capital-intensive business with high entry and exitbarriers, especially for companies operating in theinternational arena. Because of the capital-intensivenature of the activities, market prices are to a greatextent influenced by the relation between the demandfor dredging services and the available capacity orutilization levels of the equipment. This means that abroad international spread of market positions, anda leadership position in terms of equipment, costsand standardization of equipment, such as tugs, arekey success factors. <strong>Boskalis</strong> places a great deal ofemphasis on these, both as a critical focal point inoperational management and in terms of investmentstrategy. Our solid financial position also provides astrong basis for the absorption of risks.Royal <strong>Boskalis</strong> Westminster nv51
Report of the Board of ManagementOperational risksThe operational risks faced by <strong>Boskalis</strong> are varied innature, particularly as the group operates in variousactivity segments around the world. This means thatthe activities are exposed to economic, legal andpolitical risks in the countries where the companyoperates.The main operational risks for <strong>Boskalis</strong> concernthe acceptance and execution of projects fromclients, as outlined above. For most of our activities,particularly in the Dredging & Earthmoving andMaritime Infrastructure segments as well as severalactivities in the other segments, such as salvagingsunken or stranded vessels, the most commontype of contract is ‘fixed price/lump sum’. Withthis type of contract, the contractor must includenearly all the operating and (procurement) costrisks in the price. Opportunities to claim paymentfrom the client for any unexpected costs arisingduring the course of a project tend to be scarceor non-existent. Furthermore, many contractsinclude ‘milestones’ - as well as penalty clauses ifthey are not achieved. Which is why considerableemphasis is placed on identifying, analyzing andquantifying operating, cost and delay risks of thiskind when calculating the cost price and duringthe tendering procedure. Operating risks mainlyconcern unexpected soil and settlement conditions,variable weather or working conditions, technicalsuitability of the equipment, wear and tear due tothe processing of dredged materials, and damageto equipment and property of third parties. <strong>Boskalis</strong>focuses on controlling such risks, first of all byadopting a structured approach in the tender phaseto identify risks and their possible consequences.Each tender is assigned to a particular risk categorybased on its size and risk profile. Proceduresexist for each risk category prescribing howthe tenders should be processed, and whichmanagement level is entitled to authorize the tenderand set the relevant price and conditions. Duringpreparations for the tender, and depending on therisk classification and nature of the projects, weuse resources such as soil investigations, readilyaccessible databases containing historical data, andextensive risk analysis techniques. The results of therisk analysis are then used as a factor in determiningthe cost price and/or selling price, and in setting thetender and/or contract conditions. When a contractis awarded, an updated risk analysis is part of thethorough project preparation process, leading toconcrete actions being taken where necessary.In addition, there is a strong focus on instructionand training of staff, a certified quality and safetyprogram, and optimal equipment maintenance.Where possible, certain risks are insured.Risks related to price developments on theprocurement side, such as increased wage costs,costs of materials, sub-contracting costs andfuel, are also taken into account in cost-pricecalculations. Wherever possible and especiallyon projects with a long completion time, costindexation clauses are included in the contract,particularly with regard to labor and fuel costs.Material fuel costs are hedged in a number ofdifferent ways. Where possible, fuel cost variationclauses are included in the contract. Somecontracts may also require fuel to be supplied bythe client. In other cases, where substantial fuelrisks exist, these are usually hedged with financialinstruments such as forward contracts or futures.The ability to manage operating risks effectively andresponsibly is key to the company’s professionalismand expertise.Within SMIT’s Salvage activities related to shippingaccidents, contracts with insurance companiesconcerning vessels in distress are often concludedbased on a standardized ‘Lloyd's Open Form’(LOF). In that case compensation is based on avaluation mechanism related to various factorsincluding the salvage value of the ship and its cargo,the technical complexity of the salvage operation,environmental risks and the use of own equipmentand subcontractors. This valuation produces a lump52 <strong>Annual</strong> Report 2010
Risk managementsum, which is finalized through negotiations with theclient or an arbitration process. Should it transpirein the course of a salvage operation that the finalsalvage fee will not be sufficient to cover the costsinvolved, then the LOF (contract) can be convertedto a contract based on a daily hire fee. This limitsthe financial risks.The other major operating risks at the HarbourTowage division are characterized by a broadgeographical spread of the activities, with towagecontracts often being carried out under longtermcontracts with fees being reviewed eachyear. This allows for changes in local wage costdevelopments, fuel price developments and theavailable capacity of the equipment involved - forexample tugboats - to be reflected.Terminal services are usually performed underlong-term contracts with a fixed price for thecontract period, corresponding to the wishes andspecifications of the client. Most contracts includesome form of price indexation.Within the Transport and Heavy Lift segmentequipment often tends to be leased for relativelyshort periods (spot markets), meaning that theoperational risks in general, certainly as comparedto the other activities, are relatively limited.Local management on projects and operationsis expected to have a grasp of the complexity ofworking under the specific local circumstances.The scale of local operations is often too small towarrant a fully fledged organization, complete withextensive support services and staff departments.Regular visits by responsible managers andemployees from the relevant business unitsand support from highly qualified central staffdepartments at head office make up for this.In 2010 SMIT Salvage started work on salvaging the container ship MSC Chitra in India. As a result of a collision the ship started listing heavily beforeeventually running aground just outside the port of Mumbai.Royal <strong>Boskalis</strong> Westminster nv53
Report of the Board of Managementpolicy for political and payment risks. Except wherefirst-class clients with an excellent credit ratingare involved, these risks are in principle coveredby measures such as credit insurance, bankguarantees and advance payments. Revenue andprofits are only accounted for once realization issufficiently certain.A large proportion of projects, particularly dredgingprojects, are not contracted in euros. Generally,positions in non-euro currencies are fully hedgedas soon as they occur, usually with forwardexchange contracts. The US dollar exchange ratein relation to the euro is particularly relevant. Alarge proportion of the projects are contracted inUS dollars or in currencies that are linked, to agreater or lesser extent, to the US dollar. Within thedredging industry most of our major internationalcompetitors also have a cost structure largelybased on the euro. This means that exchangerate fluctuations have no major impact on ourrelative competitive position. In a number of marketsegments there is competition from parties whosecost structures are not based on the euro. Theimpact of currency fluctuations is greater in thesemarket segments. However, on balance, exchangeratefluctuations only have a limited impact on thecompany’s competitive position.Financial risksWhen executing projects <strong>Boskalis</strong> is exposed tofinancial as well as operating risks. The main risksinclude disruption by political developments andviolence, and the risk of non-payment by clients.<strong>Boskalis</strong> has a strict risk acceptance and hedgingSeveral important affiliated companies of <strong>Boskalis</strong>(Archirodon, Lamnalco, Keppel Smit Towage,Asian Lift) are largely or entirely based on theUS dollar or Singapore dollar. However, both therevenue structure and the cost structure of thesecompanies are also largely or entirely based onthese same currencies. These holdings are viewedfrom a long-term perspective. Exchange rate risksrelated to the investments in these holdings are nothedged. It is assumed that currency fluctuationsand developments in interest rates and inflationwill offset each other in the long term. The incomestatements of these affiliates are translated ataverage exchange rates. Translation differences arecharged or credited directly to shareholders’ equity.54 <strong>Annual</strong> Report 2010
Risk managementFinancial derivatives (such as forward contracts,options, interest rate swaps and futures) forhedging currency risks, fuel cost risks and/orother risks are only used where there is a physicalunderlying transaction. However, there is a riskthat, in the wake of a cancellation or substantialreduction in the size of contracts, losses may arisefrom the unwinding or settlement of the financialderivatives taken out but for which the underlyingtransaction or cash flows will no longer be realized.As is customary in the contracting industry,<strong>Boskalis</strong> also has large amounts outstandingin the form of bank guarantees or surety bonds(guarantees from insurance companies), usuallyin favor of clients. Given that the availability ofadequate credit and in particular bank guaranteefacilities is essential to the uninterrupted conductof business, <strong>Boskalis</strong>’ funding policy is aimed atmaintaining a solid financial position. The companyhas ample credit and bank guarantee facilities at itsdisposal.<strong>Boskalis</strong> has taken out a satisfactory package ofinsurance facilities to cover its tangible fixed assetsand potential third-party liability.auspices of the SHE-Q department. Reportsabout these audits are a regular item onthe agenda during meetings of the Board ofManagement with the business unit managers.2. The daily management of the <strong>Boskalis</strong>organization involves clear responsibilitiesand short, clear lines of command which aredefined unambiguously. Both competitively andin project implementation speed, knowledge,and decisiveness are of the essence. Dailymanagement is hands-on.3. The progress and development of the operatingresults and the company’s financial position,as well as operational and financial risks, aremonitored by means of structured periodical<strong>report</strong>ing, analysis of the financial results, andperformance reviews at senior management level.Internal risk management and control systemsThe internal risk management and controlsystems are based on the principles of effectivemanagement control and tailored to the day-to-dayworking environment in which <strong>Boskalis</strong> operatesworldwide. Given the hands-on nature of thecompany and its short lines of communication,three factors are important in the assessment andevaluation of the internal risk management andcontrol practices and systems at <strong>Boskalis</strong>:1. With regard to daily operations, an extensiveframework of quality assurance rules,procedures and systems that include clearguidelines for responsibilities, authorization andrisk control, forms the backbone of operationalrisk management and control. In addition toaudits by external agencies, <strong>Boskalis</strong> alsoperforms regular internal audits under theSatellite picture of the new offshore Khalifa port in Abu Dhabi. <strong>Boskalis</strong>was involved in designing and building the port. Preservation of the nearbycoral reef was an essential aspect of the project, which was completedsuccessfully in 2010 and won the ‘Environment Protection Award’.Royal <strong>Boskalis</strong> Westminster nv55
Risk managementRisks with regard to financial <strong>report</strong>ingStructure of the financial <strong>report</strong>ingFinancial <strong>report</strong>ing at <strong>Boskalis</strong> is structured withina tight framework of budgeting, <strong>report</strong>ing andforecasting. Reports may be for external or internaluse. External <strong>report</strong>ing consists of an annual<strong>report</strong>, including financial statements audited bythe external auditor, as well as a half-yearly <strong>report</strong>containing abridged financial information, bothconsolidated and segmented. The external <strong>report</strong>sare drawn up in accordance with EU-IFRS on thebasis of the internal financial <strong>report</strong>ing.Internal financial <strong>report</strong>ing - or ‘management<strong>report</strong>ing’ - consists of extensive consolidatedquarterly <strong>report</strong>s dealing with actual developmentscompared to quarterly (cumulative) budgets.Quarterly forecasts are also drawn up of the annualresults, cash flows and balance sheet positions atthe end of the financial year. The quarterly budgetsare part of the annual group budget, which is setevery year by the Supervisory Board and the Boardof Management. The internal financial <strong>report</strong>ing hasa layered structure - in accordance with the internalallocation of management responsibilities - withconsolidation taking place level by level, startingwith the projects, moving on to the business unitsand divisions and ending with group consolidated<strong>report</strong>s. Project and contract managers areresponsible for budgets, income statements andbalance sheets for their projects or contracts,which are drawn up in accordance with applicableguidelines and instructions. In turn, business unitmanagers are responsible for the financial <strong>report</strong>sof their business units.Part of the equity consists of investments inassociated companies. <strong>Boskalis</strong> is represented onthe board of those associated companies in whichit holds a significant participating interest, and as aresult has access to (interim) <strong>report</strong>ing. The figuresof significant holdings are verified by an externalauditor.The Board of Management discusses the quarterly<strong>report</strong>s in formal quarterly meetings with therelevant business unit managers. These meetingsare minuted. The consolidated group <strong>report</strong>s arediscussed with the Supervisory Board every quarter.The structure and quality of the financial accountingand control systems of <strong>Boskalis</strong> and its groupcompanies are safeguarded by unambiguousand regular internal and external audits. Relevantaspects of the financial accounting and controlsystems are set out in manuals, guidelines andprocedures, all of which are available electronically.Internal audits to monitor and improve quality anddiscipline are conducted on the basis of randomand ad hoc investigations (‘financial audits’) thatalso contain elements of instruction and training.Moreover, the quality of the financial controlsystems is evaluated regularly in the context of theactivities of the external auditors, who <strong>report</strong> on it.Statement regarding the risks relating tofinancial <strong>report</strong>ingIn spite of the risk management and controlsystems that <strong>Boskalis</strong> has put in place, there can beno absolute certainty that mistakes, losses, fraud orunlawful activities will be prevented.The topic of internal risk management and controlhas been discussed with the Supervisory Board.No material changes were introduced in the riskmanagement and internal control systems duringthe course of the year under review. Given thestructure and operation of the financial <strong>report</strong>ingand control systems at <strong>Boskalis</strong>, the Board ofManagement is of the opinion that:• the internal risk management and controlsystems provide a reasonable degree ofassurance that the financial <strong>report</strong>ing does notcontain any errors of material importance; and• the risk management and control systemsworked properly during the year under review.56 <strong>Annual</strong> Report 2010
Trailing suction hopper dredger Seaway in Rio de Janeiro, Brazil.Royal <strong>Boskalis</strong> Westminster nv57
Report of the Board of ManagementCorporate Governance<strong>Boskalis</strong> operates a two-tier board model, whichmeans that management and supervision aresegregated.The Board of Management is responsible for theday-to-day management of the business and forsetting out and realizing the company’s long-termstrategy along with the associated risks, theresult and entrepreneurial aspects relevant to thecompany. The Board of Management is responsiblefor establishing the company’s objectives,implementing its business policies and for theresulting performance.The Board of Management is accountable to theSupervisory Board and the General Meeting ofShareholders. In performing its tasks, the Boardof Management is guided by the interests of thecompany and its activities, and takes into accountany relevant interests of parties involved with thecompany.The Supervisory Board is responsible forsupervising management performance and advisingthe Board of Management. The SupervisoryBoard is supported in its work by three so-calledcore committees: the Audit Committee, theRemuneration Committee and the Selection andAppointment Committee. For a summary of thecommittees’ activities in 2010 please refer to pages28 to 31 of this <strong>report</strong>.At <strong>Boskalis</strong> there is close collaboration betweenthe Supervisory Board and its committees, theBoard of Management and the stakeholders. TheBoard of Management and the Supervisory Boardare jointly responsible for looking after the interestsof our stakeholders, which includes creatingshareholder value in the long term.Our stakeholders are those groups and individualsthat directly or indirectly influence the company’sactivities, or are influenced by them. They includethe employees, shareholders and other financiers,suppliers, clients, government bodies and thecommunities in which <strong>Boskalis</strong> operates.At least one General Meeting of Shareholders takesplace every year. Its tasks include the adoptionof financial statements and it holds authoritywith regard to the appointment and dismissal ofSupervisory Board members.The interests of employees are promoted by theWorks Council, which provides ongoing employeerepresentation as required under the WorksCouncils Act. It is the task of the Works Councilto ensure that management objectives are alignedwith those of the employees.The general standards and values relating to ourbusiness activities are set out in the ‘Statement ofGeneral Business Principles’ which can be foundon the company’s website. In addition, the corevalues and rules for safety at work are set out in oursafety program, NINA (No Injuries, No Accidents).The Board of Management regularly stresses theimportance of complying with the general businessprinciples and the NINA principles. The Board ofManagement also provides employees with theopportunity to <strong>report</strong> any alleged irregularitiesof a general, operational or financial nature toan independent confidential counsellor, withoutjeopardizing their legal position.Compliance<strong>Boskalis</strong> shares are listed and traded on NYSEEuronext Amsterdam N.V.The Dutch Corporate Governance Code (the‘Code’) applies to all Dutch companies listed onthe stock exchange and comprises a code ofconduct for governance best practice. This Codeincludes both specific principles and best practiceprovisions, as well as guidelines for their propersupervision.<strong>Boskalis</strong> subscribes to the notion that a sound andtransparent system of checks and balances is keyto maintaining confidence in companies operatingon the capital market. <strong>Boskalis</strong> believes clarityand openness in accountability and supervision58 <strong>Annual</strong> Report 2010
Corporate Gover nanceThe cutter suction dredger Taurus II on the Gorgon project in Australia.are the cornerstones of good management andentrepreneurship.As required since the introduction of the Code in2004, <strong>Boskalis</strong> published an ‘Apply or Explain’<strong>report</strong> that sets out how the principles and bestpractice provisions are applied at <strong>Boskalis</strong>. This<strong>report</strong> is available on the website and copies canalso be requested from the company. In light of thechanges to the Corporate Governance Code whichcame into effect on 1 January 2010 <strong>Boskalis</strong> revisedits ‘Apply or Explain’ <strong>report</strong> as well as all its othercorporate governance documentation, and tabledthis under Corporate Governance as a separateitem on the agenda for discussion at the <strong>Annual</strong>General Meeting of Shareholders on 12 May 2010.<strong>Boskalis</strong> subscribes to and applies all the principlesand best practice provisions contained in theCorporate Governance Code, with the exception ofthe following provisions:• In deviation of best practice II.1.1., thechairman of the Board of Management hasbeen appointed for an indefinite period of time.This appointment predates the introduction ofthe Corporate Governance Code. The contractof employment of this member of the Boardof Management was also entered into prior tothe introduction of the Corporate GovernanceCode and applies for an indefinite period oftime. <strong>Boskalis</strong> does apply this best practiceprovision to the other members and newmembers of the Board of Management;• The contracts of employment of two of themembers of the Board of Management deviatefrom best practice provision II.2.8. The contractof the chairman provides for a severancepayment equal to 18 months and the contractof the Chief Financial Officer provides fora 24-month severance payment. <strong>Boskalis</strong>does apply this best practice provision to thecontracts of other members and new membersof the Board of Management;• One Supervisory Board member, namelyMr. van der Vorm, has been a member of theBoard since 1993. In the best interests of thecompany, <strong>Boskalis</strong> has elected to deviate frombest practice provision III.3.5.The Corporate Governance Declaration can befound on the corporate website www.boskalis.com.Royal <strong>Boskalis</strong> Westminster nv59
Report of the Board of ManagementOutlookOutlook€ 350 million and can be funded from our cashflow.Market prospects positive for the medium term2011 to be year of transitionThe financial position of <strong>Boskalis</strong> remains verysolid, even after the acquisition of SMIT. Capitalexpenditure in 2011 is expected to total aroundGiven the current market conditions and theproject-based nature of a large part of our activitieswe are unable to provide a specific forecastfor the current year at this time. We do, however,anticipate that we will be unable to match therecord result of 2010 in 2011. Based on currentinformation we see 2011 as a year of transition,from challenging market conditions to morepositive prospects in the medium term.SMIT divers provided assistance on the Magellan project in Argentina.60 <strong>Annual</strong> Report 2010
Report of the Board of ManagementStatement of Directors’ responsibilitiesThe Board of Management of Royal <strong>Boskalis</strong>Westminster N.V. hereby declares, in accordancewith article 5:25c of the Financial Supervision Act,that to the best of its knowledge:1. the financial statements, which have beenprepared in accordance with the applicablestandards for preparing financial statementsand as included on pages 65 to 129 of the<strong>Annual</strong> Report, provide a true and fair viewof the assets, liabilities and financial positionas at 31 December 2010 as well as the profitor loss for the 2010 financial year of Royal<strong>Boskalis</strong> Westminster N.V. and all the businessundertakings included in the consolidation;2. the annual <strong>report</strong> provides a true and fair viewof the condition, the business situation duringthe financial year of Royal <strong>Boskalis</strong> WestminsterN.V. and the companies associated with it whosedetails are included in the financial statements, asat the balance sheet date of 31 December 2010;3. the annual <strong>report</strong> provides a description of thematerial risks faced by the company.Papendrecht / Sliedrecht, 16 March 2011Board of Managementdr. P.A.M. Berdowski, chairmanT.L. BaartmansJ.H. Kamps, CFOJumbo cutter suction dredger Phoenix in the port of Fremantle, Australia.Royal <strong>Boskalis</strong> Westminster nv61
62Trailing suction hopper dredgersTrailing suction hopper dredgers fill their own holds by sucking upmaterial from the seabed using a trailing suction head while the ship sails.The dredged material can be transported over large distances. Dumpingmethods include rainbowing, as shown in the large photograph. <strong>Boskalis</strong>has a fleet of around 30 trailing suction hopper dredgers, including one ofthe world’s largest, the Queen of the Netherlands, whose assignments in2010 included the four islands project in the Maldives.
Jaarrekening over 201064Jaarverslag 2010
Financial statements 2010Financial statements 2010Royal <strong>Boskalis</strong> Westminster nv65
Financial statements 2010Table of contentsConsolidated income statement 68Consolidated statement of recognized and unrecognized income and expenses 69Consolidated balance sheet 70Consolidated statement of cash flows 71Consolidated statement of changes in equity 72Explanatory notes to the consolidated financial statements 741. General 742. Compliance with International Financial Reporting Standards 742.1 Compliance statement 742.2 Amendments to the principles of financial <strong>report</strong>ing 742.3 New standards and interpretations not yet adopted 753. Principles of financial <strong>report</strong>ing 753.1 Format and valuation 753.2 Consolidation 763.3 Foreign currencies 763.4 Derivatives and hedging 773.5 Impairment 773.6 Intangible assets 783.7 Property, plant and equipment 783.8 Associated companies 793.9 Non-current receivables 793.10 Inventories 793.11 Due from and due to customers 793.12 Trade and other receivables 803.13 Cash and cash equivalents 803.14 Share capital 803.15 Interest-bearing borrowings 803.16 Employee benefits 803.17 Share-based remuneration plans 813.18 Provisions 813.19 Trade and other payables 813.20 Revenue 823.21 Other income 823.22 Raw materials, consumables and services 823.23 Personnel expenses 823.24 Lease payments 823.25 Finance income and expenses 823.26 Share in result of associated companies 833.27 Taxation / deferred income tax assets and liabilities 833.28 Profit per share 833.29 Dividends 833.30 Determination of fair value 833.31 Consolidated statement of cash flows 843.32 Segment <strong>report</strong>ing 844. Business combination 865. Segment <strong>report</strong>ing 885.1 Operational segments 885.2 Revenue by region 895.3 Movement in work in progress 896. Other income 897. Raw materials, consumables and services 898. Personnel expenses 899. Finance income and expenses 9010. Taxation 9011. Income tax receivable and payable 9112. Deferred income tax assets and liabilities 9166 <strong>Annual</strong> Report 2010
Financial statements 201013. Intangible assets 9313.1 Goodwill 9313.2 Other intangible assets 9414. Property, plant and equipment 9415. Associated companies 9516. Other non-current receivables 9617. Inventories 9618. Due from and due to customers 9719. Trade and other receivables 9720. Cash and cash equivalents 9721. Group equity 9821.1 Issued capital and share premium 9821.2 Retained earnings 9821.3 Dividends 9821.4 Earnings per share 9921.5 Other reserves 9921.5.1 Other legal reserve (legal reserve) 10021.5.2 Hedging reserve (legal reserve) 10021.5.3 Revaluation reserve (legal reserve) 10021.5.4 Currency translation reserve (legal reserve) 10021.5.5 Actuarial reserve 10022. Interest-bearing borrowings 10023. Employee benefits 10123.1 Defined benefit pension schemes 10224. Provisions 10425. Trade and other payables 10526. Financial instruments 10526.1 Financial risk management 10526.2 On-balance financial instruments and fair value 11126.3 Capital management 11326.4 Other financial instruments 11327. Commitments and contingent liabilities 11428. Subsequent events 11529. Related parties 11529.1 Identity of related parties 11529.2 Related party transactions 120Company income statement 123Company balance sheet before profit appropriation 124Statement of changes in shareholders’ equity 125Explanatory notes to the company financial statements 1261. General 1262. Principles of financial <strong>report</strong>ing 1262.1 Accounting policies 1262.2 Format 1262.3 Investment in Group companies 1262.4 Amounts due from Group companies 1262.5 Amounts due to Group companies 1262.6 Result of Group companies 1263. Investments in Group companies 1274. Issued capital and share premium 1275. Reserves 1286. Profit for the year 1287. Financial instruments 1288. Remuneration of members of the Board of Management and members of the Supervisory Board 1289. Auditor's remuneration 12910. Commitments and contingent liabilities 129Other information 130Royal <strong>Boskalis</strong> Westminster nv67
Financial statements 2010Consolidated income statement(in € 1,000) Note 2010 2009Operating incomeRevenue [5] 2,674,439 2,175,179Other income [6] 38,289 7,4172,712,728 2,182,596Operating expensesRaw materials, consumables and services [7] - 1,594,802 - 1,454,344Personnel expenses [8] - 496,452 - 283,304Depreciation, amortization and impairment losses [13/14] - 219,604 - 195,677- 2,310,858 - 1,933,325Operating result 401,870 249,271Finance income and expensesFinance income [9] 23,238 1,195Finance expenses [9] - 60,074 - 13,664- 36,836 - 12,469Share in result of associated companies (after taxation) [15] 24,973 58,344Profit before taxation 390,007 295,146Taxation [10] - 77,125 - 65,981Net group profit 312,882 229,165Net group profit attributable to:Shareholders 310,517 227,852Non-controlling interests 2,365 1,313312,882 229,165Average number of shares [21.4] 99,962,337 88,371,852Earnings per share [21.4] € 3.11 € 2.58Diluted earnings per share [21.4] € 3.11 € 2.58The notes on pages 74 to 122 are an integral part of these consolidated financial statements.68 <strong>Annual</strong> Report 2010
Financial statements 2010Consolidated statement of recognized and unrecognized income and expenses(in € 1,000) Note 2010 2009Net group profit for the period 312,882 229,165Unrecognized income and expenses for the periodCurrency translation differences on foreign operations [21.5] 37,864 - 5,800Actuarial gains and losses and asset limitation on defined benefit pension schemes [23.1] - 28,593 21,826Movement in fair value of cash flow hedges [26.2] - 11,554 1,473Income tax on unrecognized income and expenses [12] 6,624 - 472Unrecognized income and expenses for the period, net of income tax 4,341 17,027Total recognized and unrecognized income and expenses for the period 317,223 246,192Attributable to:Shareholders 313,340 244,270Non-controlling interests 3,883 1,922Total recognized and unrecognized income and expenses for the period 317,223 246,192The notes on pages 74 to 122 are an integral part of these consolidated financial statements.Royal <strong>Boskalis</strong> Westminster nv69
Financial statements 2010Consolidated balance sheetDecember 31(in € 1,000) Note 2010 2009AssetsNon-current assetsIntangible assets [13] 593,677 13,595Property, plant and equipment [14] 2,178,625 1,059,788Investments in associated companies [15] 20,617 298,674Non-current receivables [16] 40,373 6,019Derivatives [26] 106 354Deferred income tax assets [12] 18,706 6,7132,852,104 1,385,143Current assetsInventories [17] 86,906 69,671Due from customers [18] 197,170 140,086Trade and other receivables [19] 793,339 601,636Derivatives [26] 4,930 3,279Income tax receivable [11] 23,060 8,899Cash and cash equivalents [20] 357,744 594,8361,463,149 1,418,407Total assets 4,315,253 2,803,550Group equityIssued capital [21] 80,779 78,921Share premium [21] 231,335 232,076Other reserves [21] 150,803 77,181Retained earnings [21] 1,102,053 907,589Shareholders' equity 1,564,970 1,295,767Non-controlling interests 34,324 9,154Total group equity [21] 1,599,294 1,304,921LiabilitiesNon-current liabilitiesInterest-bearing borrowings [22] 705,003 57,438Employee benefits [23] 35,896 13,740Deferred income tax liabilities [12] 104,135 29,232Provisions [24] 42,986 6,384Derivatives [26] 21,496 6,959909,516 113,753Current liabilitiesDue to customers [18] 479,264 507,213Interest-bearing borrowings [22] 102,766 22,645Bank overdrafts [20] 1,475 1,347Income tax payable [11] 163,107 105,324Trade and other payables [25] 1,022,113 727,668Derivatives [26] 23,211 18,915Provisions [24] 14,507 1,7641,806,443 1,384,876Total liabilities 2,715,959 1,498,629Total group equity and liabilities 4,315,253 2,803,550The notes on pages 74 to 122 are an integral part of these consolidated financial statements.70 <strong>Annual</strong> Report 2010
Financial statements 2010Consolidated statement of cash flows(in € 1,000) Note 2010 2009Cash flows from operating activitiesNet group profit 312,882 229,165Depreciation, amortization and impairment losses 219,604 195,677Cash flow 532,486 424,842Adjustments for:Finance income and expenses 36,836 12,469Taxation 77,125 65,981Results from disposals of property, plant and equipment - 4,710 - 7,417(Reversal of) impairment losses on associated companies — - 35,268Movement non-current receivables - 21,924 2,508Movement provisions (including direct equity movements) - 15,556 - 2,333Movement in inventories 2,028 5,869Movement trade and other receivables - 28,394 82,456Movement trade and other payables 89,227 - 41,268Movement due from and due to customers - 43,206 139,917Result of associated companies - 24,973 - 23,076Cash generated from operating activities 598,939 624,680Dividends received 17,611 1,500Interest received 5,094 1,195Interest paid - 29,975 - 10,864Income taxes paid - 64,210 - 83,818Net cash from operating activities 527,459 532,693Cash flows from investing activitiesPurchases of intangible assets and property, plant and equipment, excluding recognized borrowing costs - 329,205 - 293,371Proceeds from disposals of property, plant and equipment 38,173 15,739Net investment in group companies, net of cash acquired - 675,146 —Net investments in associated companies - 50,383 - 17,574Net cash used in investing activities - 1,016,561 - 295,206Cash flows from financing activitiesProceeds from loans 2,194,756 181,078Repayment of loans - 1,869,500 - 412,134Transaction costs relating to the arrangement of credit facilities - 17,179 - 5,133Proceeds from share issue — 227,351Dividends paid to the company's shareholders - 44,137 - 35,972Dividends paid to non-controlling interests - 2,031 - 348Net cash used in / from financing activities 261,909 - 45,158Net (decrease) / increase in cash and cash equivalents - 227,193 192,329Net cash and cash equivalents as at January 1 [20] 593,489 402,097Net (decrease) / increase in cash and cash equivalents - 227,193 192,329Currency translation differences - 10,027 - 937Movement in net cash and cash equivalents - 237,220 191,392Net cash and cash equivalents as at December 31 [20] 356,269 593,489The notes on pages 74 to 122 are an integral part of these consolidated financial statements.Royal <strong>Boskalis</strong> Westminster nv71
Financial statements 2010Consolidated statement of changes in equity(in € 1,000)IssuedcapitalSharepremiumOtherreservesRetainedearningsTotalNoncontrollinginterestTotalequityNote [21.1] [21.1] [21.5] [21.2]Balance as at January 1, 2010 78,921 232,076 77,181 907,589 1,295,767 9,154 1,304,921Total recognized and unrecognized income and expensesfor the periodNet group profit for the period — — — 310,517 310,517 2,365 312,882Unrecognized income and expenses for the periodForeign currency translation differences for foreign operations — — 36,909 — 36,909 1,518 38,427Effective cash flow hedges, after taxation — — - 10,616 — - 10,616 — - 10,616Defined benefit plan actuarial gains (losses) and asset limitation,after taxation — — - 23,470 — - 23,470 — - 23,470Movement other legal reserve — — 70,799 - 70,799 — — —Total unrecognized income and expenses for the period — — 73,622 - 70,799 2,823 1,518 4,341Total recognized and unrecognized income and expensesfor the period — — 73,622 239,718 313,340 3,883 317,223Transactions with shareholdersDistributions to shareholdersCash dividend — — — - 44,137 - 44,137 - 2,031 - 46,168Stock dividend 1,858 - 741 — - 1,117 — — —Movements in interests in subsidiariesNew in consolidation — — — — — 2,750 2,750Non-controlling interest in Smit Internationale N.V. — — — — — 20,568 20,568Total transactions with shareholders 1,858 - 741 — - 45,254 - 44,137 21,287 - 22,850Balance as at December 31, 2010 80,779 231,335 150,803 1,102,053 1,564,970 34,324 1,599,294The notes on pages 74 to 122 are an integral part of these consolidated financial statements.72 <strong>Annual</strong> Report 2010
Financial statements 2010(in € 1,000)IssuedcapitalSharepremiumOtherreservesRetainedearningsTotalNoncontrollinginterestTotalequityNote [21.1] [21.1] [21.5] [21.2]Balance as at January 1, 2009 68,639 13,261 35,389 742,829 860,118 7,580 867,698Total recognized and unrecognized income and expensesfor the periodNet group profit for the period — — — 227,852 227,852 1,313 229,165Unrecognized income and expenses for the periodForeign currency translation differences for foreign operations — — - 4,665 — - 4,665 609 - 4,056Effective cash flow hedges, after taxation — — 2,527 — 2,527 — 2,527Defined benefit plan actuarial gains (losses) and asset limitation,after taxation — — 18,556 — 18,556 — 18,556Movement other legal reserve — — 25,374 - 25,374 — — —Total unrecognized income and expenses for the period — — 41,792 - 25,374 16,418 609 17,027Total recognized and unrecognized income and expensesfor the period — — 41,792 202,478 244,270 1,922 246,192Transactions with shareholdersIssue of ordinary shares 7,216 220,135 — — 227,351 — 227,351Distributions to shareholdersCash dividend — — — - 35,972 - 35,972 - 348 - 36,320Stock dividend 3,066 - 1,320 — - 1,746 — — —Total transactions with shareholders 10,282 218,815 — - 37,718 191,379 - 348 191,031Balance as at December 31, 2009 78,921 232,076 77,181 907,589 1,295,767 9,154 1,304,921The notes on pages 74 to 122 are an integral part of these consolidated financial statements.Royal <strong>Boskalis</strong> Westminster nv73
Financial statements 2010Explanatory notes to the consolidated financial statements1. GeneralRoyal <strong>Boskalis</strong> Westminster N.V. is a leadingglobal services provider operating in the dredging,maritime infrastructure and maritime servicessectors. Royal <strong>Boskalis</strong> Westminster N.V. (the‘company’) has its registered office in Sliedrecht,the Netherlands, and its head office is located inPapendrecht, the Netherlands. The company is apublic limited company listed on the NYSE EuronextAmsterdam stock exchange. The consolidatedfinancial statements of Royal <strong>Boskalis</strong> WestminsterN.V. for 2010 include the company and groupcompanies (hereinafter referred to jointly as the‘Group’ and individually as the ‘Group entities’) andthe interests of the Group in associated companiesand entities over which it has joint control.The consolidated financial statements wereprepared by the Board of Management and havebeen signed on March 16, 2011. The 2010 financialstatements will be submitted for approval tothe <strong>Annual</strong> General Meeting of Shareholders ofMay 12, 2011.2. Compliance with International FinancialReporting Standards2.1 Compliance statementThe consolidated financial statements and theaccompanying explanatory notes have beenprepared in accordance with the InternationalFinancial Reporting Standards (IFRS), as adoptedby the European Union, and with Part 9 of Book 2 ofthe Netherlands Civil Code.2.2 Amendments to the principles of financial<strong>report</strong>ingWith effect from January 1, 2010 the Group hasamended the principles of financial <strong>report</strong>ing in thefollowing areas:• Accounting for business combinations• Accounting for acquisitions of non-controllinginterests;Accounting for business combinationsFrom 1 January 2010 the Group has applied IFRS 3Business Combinations (revised) in accounting forbusiness combinations. The change in accountingpolicy has been applied prospectively and has hadan effect of € 0.1 million negative on net groupprofit (see also note 4).Business combinations are accounted for using theacquisition method as at the acquisition date, whichis the date on which control is transferred to theGroup. Control is the power to govern the financialand operating policies of an entity so as to obtainbenefits from its activities. In assessing control,the Group takes into consideration potential votingrights that currently are exercisable.Acquisitions on or after 1 January 2010For acquisitions on or after 1 January 2010, theGroup measures goodwill at the acquisition date as:• the fair value of the consideration transferred;plus• the recognised amount of any non-controllinginterests in the acquiree; plus• if the business combination is achieved instages, the fair value of the existing equityinterest in the acquiree; less• the net recognised amount (generally fairvalue) of the identifiable assets acquired andliabilities assumed.When the excess is negative, a bargain purchasegain is recognised immediately in profit or loss.The consideration transferred does not includeamounts related to the settlement of preexistingrelationships. Such amounts are generallyrecognised in profit or loss.Costs related to the acquisition, other thanthose associated with the issue of debt or equitysecurities, that the Group incurs in connection witha business combination are expensed as incurred.Any contingent consideration payable is recognisedat fair value at the acquisition date. If the contingentconsideration is classified as equity, it is notremeasured and settlement is accounted forwithin equity. Otherwise, subsequent changes tothe fair value of the contingent consideration arerecognised in profit or loss.Acquisitions between 1 January 2004 and1 January 2010For acquisitions between 1 January 2004 and 1January 2010, goodwill represents the excess ofthe cost of the acquisition over the Group’s interestin the recognised amount (generally fair value) of74 <strong>Annual</strong> Report 2010
Financial statements 2010the identifiable assets, liabilities and contingentliabilities of the acquiree. When the excess wasnegative, a bargain purchase gain was recognisedimmediately in profit or loss.Transaction costs, other than those associatedwith the issue of debt or equity securities, thatthe Group incurred in connection with businesscombinations were capitalised as part of the cost ofthe acquisition.Acquisitions prior to 1 January 2004 (date oftransition to IFRSs)As part of its transition to IFRSs, the Groupelected not to restate business combinations thatoccurred on or after 1 January 2004. In respectof acquisitions prior to 1 January 2004, goodwillrepresents the amount recognised under theGroup’s previous accounting framework.Accounting for acquisitions of non-controllinginterestsFrom 1 January 2010 the Group has applied IAS 27Consolidated and Separate Financial Statements(2008) in accounting for acquisitions of noncontrollinginterests. The change in accountingpolicy has been applied prospectively and has hadno impact on earnings per share.Under the new accounting policy, acquisitionsof non-controlling interests are accounted foras transactions with owners in their capacity asowners and therefore no goodwill is recognised as aresult of such transactions. The adjustments to noncontrollinginterests are based on a proportionateamount of the net assets of the subsidiary.Previously, goodwill was recognised on theacquisition of non-controlling interests in asubsidiary, which represented the excess of thecost of the additional investment over the carryingamount of the interest in the net assets acquired atthe date of the transaction.The principles for financial <strong>report</strong>ing subsequentlydisclosed are applied consistently for all periodsdisclosed in these consolidated financial statementsand have been applied consistently by theGroup entities.2.3 New standards and interpretations not yetadoptedA number of new standards, amendments tostandards and interpretations are effective forannual periods beginning after 1 January 2010,and have not been applied in preparing theseconsolidated financial statements. None ofthese is expected to have a significant effecton the consolidated financial statements of theGroup, except for IFRS 9 Financial Instruments,which becomes mandatory for the Group’s 2013consolidated financial statements and could changethe classification and measurement of financialassets. The Group does not plan to adopt thisstandard early and the extent of the impact has notbeen determined.3. Principles of financial <strong>report</strong>ing3.1 Format and valuationThe consolidated financial statements are drawnup in euros, the Group’s functional currency.The consolidated financial statements are basedupon historical cost to the extent that IFRS doesnot prescribe another accounting method forspecific items. Preparing financial statements inaccordance with IFRS means that estimates andassumptions made by the management partlydetermine the recognized amounts under assets,liabilities, revenues and costs. The estimates andassumptions are mainly related to the measurementof property, plant and equipment (useful life andimpairment), goodwill, valuation of investmentsin associated companies, results on completionof work in progress, pension liabilities, taxation,provisions and financial instruments. Judgementsmade by management within the application of IFRSwith an material effect on the Financial statementsare the qualifications of investments as Groupcompanies, joint ventures or associated companies.Details are incorporated in the explanatory notesto these items. Next to the elements alreadyexplained in the explanantory notes to the Financialstatements, there are no other critical valuationjudgements in the application of the principlesthat need further explanation. The estimatesmade and the related assumptions are based onmanagement’s experience and understandingand the development of external factors thatcan be considered reasonable under the givenRoyal <strong>Boskalis</strong> Westminster nv75
Financial statements 2010circumstances. Estimates and assumptions aresubject to alterations as a result of changes tofacts and understanding and may have differentoutcomes per <strong>report</strong>ing period. Any differencesare recognized in the balance sheet or incomestatement, depending on the nature of the item.The actual results may deviate from results<strong>report</strong>ed previously on the basis of estimates andassumptions. Unless stated otherwise, all amountsin the notes in these financial statements are statedin thousands of euros.3.2 Consolidation3.2.1 Business combinationsThe Group has changed its accounting policy withrespect to accounting for business combinations.See note 2.2 for further details.3.2.2 Group companiesGroup companies are included in the consolidationfor 100% on the basis of existing control, takinginto account any minority interests. The financialstatements of Group companies are included inthe consolidated financial statements from thedate that control commences until the date thatcontrol ceases. The accounting policies of Groupcompanies have been changed when necessary toalign them with the policies adopted by the Group.3.2.3 Joint venturesJoint ventures are those entities over which theGroup has joint control, whereby this control hasbeen laid down in a contract and strategic decisionson financial and operational policy should be takenby unanimous agreement. Joint ventures – bothstrategic alliances and contractual project-drivenconstruction consortiums – are included in theconsolidation on a proportional basis in accordancewith the share in joint control. Amounts receivablefrom and payable to project-driven constructionconsortiums are eliminated in the consolidation.Elimination differences as a result of imbalancesbetween partners in current account relationwith project-driven construction consortiums,for example timing differences in supply, arerecognized in the consolidated balance sheet underOther receivables or Other creditors.3.2.4 Associated companiesShareholdings that are not eligible for consolidationbased on control, but where there is significantinfluence on the financial and operating policy,are recognized under associated companies.Significant influence is presumed to exist whenthe Group holds 20 percent or more of the votingpower of another entity. The consolidated financialstatements include the Group’s share in the resultof associated companies, after adjustments to alignthe accounting policies with those of the Group,from the date that significant influence commencesuntil the date that significant influence ceases.3.2.5 Elimination of transactions upon consolidationIntragroup receivables and payables, as well asintragroup transactions and finance income andexpenses and unrealized results within the Groupand with associated companies and joint ventures,are eliminated in preparing the consolidatedfinancial statements to the extent of the Group’sshare in the entity.3.2.6 Change in consolidation baseIn 2010 the composition of the consolidated Groupchanged as a result of the increased interest inSmit Internationale N.V. (hereinafter referred to as“SMIT”) from 26.76% at the end of 2009 to 98.19%at the end of 2010. The Group gained a controllinginterest in SMIT at the start of the second quarterof 2010 and ever since SMIT has been recognizedas such in the consolidation of the Group. Anon-controlling interest has been recognized inthe balance sheet for the interest in SMIT not yetacquired by the Group.3.3 Foreign currenciesThe assets and liabilities of foreign Groupcompanies and joint ventures that are denominatedin functional currencies other than the euro havebeen translated at the exchange rates as at theend of the <strong>report</strong>ing period. The income statementitems of the foreign Group companies and jointventures concerned have been translated ataverage exchange rates, which approximate theapplicable exchange rates at transaction settlementdate. Resulting currency translation differencesare added or charged directly to the currency76 <strong>Annual</strong> Report 2010
Financial statements 2010translation reserve in group equity. Exchange ratedifferences as a result of operational transactionsare included in the consolidated income statementof the <strong>report</strong>ing period. The foreign currency gainor loss on monetary items is the difference betweenamortized cost in the functional currency at thebeginning of the year, adjusted for effective interestand payments during the year, and the amortizedcost in foreign currency translated at the exchangerate at the end of the year. Non-monetary items thatare measured in terms of historical cost in a foreigncurrency are translated using the exchange rate atthe date of the transaction.3.4 Derivatives and hedgingIt is the policy of Royal <strong>Boskalis</strong> Westminster N.V.to use cash flow hedges to cover all operationalcurrency risks that mainly relate to future cash flowsfrom contracts that are highly probable and that aredenominated in currencies other than the relevantfunctional currency. Fuel price risks and interestrate risks in future cash flows can be hedged fromtime to time using specific derivatives.Hedge accounting is applied to the majority ofcash flow hedges as follows. On initial designationof the hedge, the Group formally documents therelationship between the hedging instrument(s)and hedged item(s), including the risk managementobjectives and strategy in undertaking the hedgetransaction, together with the methods that will beused to assess the effectiveness of the hedgingrelationship. The Group makes an assessment,both at the inception of the hedge relationship aswell as on an ongoing basis, whether the hedginginstruments are expected to be “effective” inoffsetting the changes in the fair value or cash flowsof the respective hedged items during the periodfor which the hedge is designated, and whether theactual results of each hedge are within a range of80-125 percent. For a cash flow hedge of a forecasttransaction, the transaction should be highlyprobable to occur and should present an exposureto variations in cash flows that could ultimatelyaffect <strong>report</strong>ed net income.The application of hedge accounting means thatmovements in the market value of cash flow hedgesnot yet settled – including results realized on the“rolling forward” of existing hedges as a result ofdifferences between the duration of the hedgesconcerned and the underlying cash flows – will bedirectly added or charged to the hedging reservein group equity, taking taxation into account. If acash flow hedge added or charged to the groupequity either expires, is closed or is settled, or thehedge relation with the underlying cash flows canno longer be considered effective, the accumulatedresult will continue to be recognized in groupequity as long as the underlying cash flow is stillexpected to take place. When the underlyingcash flow actually takes place, the accumulatedresult is included directly in the income statement.Movements in the market value of cash flowhedges to which no hedge accounting is applied(ineffective cash flow hedges and the ineffectiveportion of effective cash flow hedges) are includedin the income statement for the <strong>report</strong>ing period.Results from settled effective cash flow hedges andthe movements in the market value of ineffectivecash flow hedges are recognized in the relateditems within the operating result. The purchase orsale of financial instruments is generally recordedat transaction rate. Derivatives are stated at fairvalue; attributable transaction costs are recognizedin profit or loss as incurred. Subsequent to initialrecognition, derivatives are measured at fairvalue, and changes therein are accounted for asdescribed.3.5 ImpairmentThe book value of the assets of the Group,excluding inventories, assets arising from employeebenefits and deferred income tax assets is reviewedat each balance sheet date to determine whetherthere is any indication of impairment. If any suchindication exists, an estimate of the realizableamount of the asset is made. For goodwill, assetswith an indefinite useful life and intangible assetsnot yet ready for use, the realizable amountis estimated annually. An impairment loss isrecognized when the book value of an asset or itscash-generating unit to which it belongs exceeds itsrealizable amount.Royal <strong>Boskalis</strong> Westminster nv77
Financial statements 2010Impairment losses are recognized in the incomestatement. Impairment losses recognized in respectof cash generating units are allocated first to reducethe book value of any cash-generating units (orgroups of units) goodwill and then proportionallydeducted from the book value of the assets of theunit (or group of units).The realizable amount of receivables accountedfor at amortized cost is calculated as the presentvalue of expected future cash flows, discounted atthe effective interest rate. For the other assets orcash-generating units, the realizable amount equalsthe fair value less costs to sell or value in use,whichever is higher. In determining the value in use,the present value of estimated future cash flows iscalculated using a discount rate that reflects currentmarket assessments of the time value of money andthe risks specific to the asset. For floating and otherconstruction material the discount rate takes intoaccount risks to the extent they have not alreadybeen included in the estimated future cash flows.Indications of impairment of floating and otherconstruction material are based on long-termexpectations for the utilization of equipment or ofinterchangeable equipment. If there is any indicationof impairment, the realizable value of the assetconcerned is determined on the basis of the netrealizable value or present value of the estimatedfuture cash flows over the remaining useful life ofthe equipment from the utilization of the relevantequipment or group of interchangeable equipment.In respect of goodwill no impairment losses arereversed. An impairment loss in respect of anreceivable account for at amortized cost is reversedif the reversal can be related objectively to an eventoccurring after the impairment loss was recorded.For other assets, impairment losses are reversedif the estimates used to determine the realizableamount give cause to do so, but only to the extentthat the book value of the asset does not exceedthe book value net of depreciation or amortizationthat would have applied if no impairment loss hadbeen recognized.3.6 Intangible assetsGoodwill arises upon acquiring Group companies,joint ventures and associated companies and iscalculated as the difference between the acquisitionprice and the fair value of the assets and liabilitiesacquired, according to the accounting principles ofRoyal <strong>Boskalis</strong> Westminster N.V. Goodwill and otherintangible assets are capitalized net of accumulatedamortization and accumulated impairment losses.Goodwill and intangible assets with an infiniteuseful life are not systematically amortized, but aretested for impairment every year or in case of anindication for impairment (see note 3.5). Negativegoodwill that may arise upon acquisition is addeddirectly to the income statement. In respect ofassociated companies, the book value of goodwill isincluded in the book value of the investment.Other intangible assets are capitalized onlywhen it is probable that future economic benefitsembodied in an asset, will flow to the Group andthe cost of the asset can be reliably measured.Other intangible assets with a finite useful life arestated at cost less accumulated amortization andaccumulated impairment losses. Amortization oftrademarks valued at acquisition takes place overfour years, the amortization of customer portfoliosand contracts valued at acquisition takes place over7 to 13 years.Expenditure on research activities, undertakenwith the prospect of gaining new scientific ortechnical knowledge and understanding, isexpensed as incurred. Development expenditure iscapitalized when material. Development activitiesare particularly related to investments in dredgingequipment.3.7 Property, plant and equipmentProperty, plant and equipment are stated at costprice less accumulated depreciation calculatedfrom the date of commissioning and accumulatedimpairment losses. The cost price is based onthe purchase price and / or internally generatedcost based on directly attributable expenses. Thedepreciation, allowing for an assumed residualvalue, is calculated over the estimated remaininguseful lives assigned to the various categories78 <strong>Annual</strong> Report 2010
Financial statements 2010of assets. Modifications and capacity enhancinginvestments are also capitalized at cost andamortized over the remaining life of the asset.Property, plant and equipment under constructionare included in the balance sheet on the basisof installments paid, including interest duringconstruction. Where property, plant and equipmentconsist of components with different useful lives,they are accounted for as separate items.Buildings are depreciated over periods ranging fromten to fifty years. The depreciation periods of themajority of floating and other construction materialranges from ten to twenty years. Furniture and otherfixed assets are depreciated over a period betweenthree and ten years. Land is not depreciated.The wear of dredging equipment is highlydependent on unpredictable project-specificcombinations of soil conditions, materials tobe processed, maritime circumstances and theintensity of the deployment of the equipment. As aresult of this erratic and time-independent patterns,the maintenance and repair expenses for upkeepthe assets are predominantly charged to the incomestatement. In exceptional cases, maintenance andrepair expenses are eligible for capitalization andlinear depreciation.Upon its disposal the revaluation surplus of an itemof property, plant and equipment is transferred fromthe revaluation reserve to the retained earnings.Methods for depreciation, useful life and residualvalue are reassessed at the end of each financialyear and amended if necessary.Leases in terms of which the Group assumessubstantially all the risks and rewards of ownershipare classified as finance leases. Upon initialrecognition the leased asset is measured at anamount equal to the lower of its fair value and thepresent value of the minimum lease payments.Subsequent to initial recognition, the asset isaccounted for in accordance with the accountingpolicy applicable to that asset.Other leases are operating leases and are notrecognised in the Group’s consolidated balancesheet.3.8 Associated companiesAssociated companies, in which the Grouphas a significant influence on the financial andoperating policy, are initially recognized at costincluding the goodwill determined at acquisitiondate. Subsequently associated companies areaccounted for using the equity method, adjustedfor differences with the accounting principles ofthe Group, less any accumulated impairment.When the Group’s share of losses exceeds thebook value of the associated company, the bookvalue is reduced to zero and recognition of furtherlosses is discontinued except to the extent that theGroup has incurred legal or constructive obligationsor made payments on behalf of the associatedcompany.3.9 Non-current receivablesThe non-current receivables are mainly held on along-term basis and/or until maturity and are carriedat amortized cost. Accumulated impairment lossesare deducted from the book value.3.10 InventoriesInventories, which mainly consist of fuel, auxiliarymaterials and spare parts, are stated at the lower ofcost and net realizable value. Net realizable value isthe estimated selling price in the ordinary course ofbusiness, less the estimated costs of selling.3.11 Due from and due to customersDue from and due to customers concerns the grossamount yet to be charged which is expected tobe received from customers for contractual workdone up to the <strong>report</strong>ing date (hereinafter: "work inprogress"). Work in progress is valued at the costprice of the work done, plus a part of the expectedresults upon completion of the project in proportionto the progress made and less progress billings,advances and provisions. Provisions are recognizedfor expected losses on work in progress as soonas they are foreseen, and deducted from the costprice; if necessary, any profits already recognizedare reversed. The cost price includes projectRoyal <strong>Boskalis</strong> Westminster nv79
Financial statements 2010costs, consisting of payroll costs, materials, costsof subcontracted work, rates for rental chargesand maintenance costs for the equipment usedand other project costs. The rates used are basedon the expected average occupation in the longrun. The progress of a project is determined onthe basis of the cost of the work done in relationto the expected cost price of the project as awhole. Profits are not recognized unless a reliableestimate can be made of the result on completionof the project. The balance of the value of work inprogress, progress billings and advance paymentsis determined per project. For projects where theprogress billings and advance payments exceed thevalue of work in progress, the balance is recognizedunder current liabilities instead of under currentassets. The respective balance sheet items are “duefrom customers for work in progress” and “dueto customers”.Salvage work that is completed at the balancesheet date, but for which the proceeds are not yetfinally determined between parties, is recognizedat expected proceeds taking into accoutnthe estimation uncertainty. If the revenue of acompleted salvage contract cannot be estimatedreliably, revenue is recognized to the extent ofcontract cost recognized.3.12 Trade and other receivablesTrade and other receivables are stated initially atfair value and subsequently at amortized cost lessaccumulated impairment losses, such as doubtfuldebts. Amortized cost is determined using theeffective interest rate.3.13 Cash and cash equivalentsCash and cash equivalents consist of cash andbank balances and deposits with terms of no morethan three months. The explanatory notes disclosethe extent to which cash and cash equivalentsare not freely available as a result of transferrestrictions, joint control or other legal restrictions.Bank overdrafts are included as a component ofcash and cash equivalents for the purpose of theconsolidated statement of cash flows.3.14 Share capitalOrdinary shares are classified as equity. Incrementalcosts directly attributable to the issue of ordinaryshares are recognized as a deduction from equity,net of any tax effects.3.15 Interest-bearing borrowingsInterest-bearing borrowings are liabilities tofinancial institutions. At initial recognition, interestbearingborrowings are stated at fair value lesstransaction costs. Subsequently, interest-bearingborrowings are stated at amortized cost with anydifference between cost and redemption valuebeing recognized in the income statement overthe period of the borrowings on an effectiveinterest basis.3.16 Employee benefitsDefined contribution pension schemesA defined contribution pension scheme is a postemploymentbenefit scheme under which an entitypays fixed contributions into a separate entity andwill have no legal or constructive obligation to payfurther amounts if the pension fund has insufficientfunds to pay employee benefits in connection withservices rendered by the employee in the currentof prior periods. Obligations for contributionsto defined contribution pension schemes arerecognized as an employee benefit expense as partof the personnel expenses in the income statementwhen they are due. Prepaid contributions arerecognized as an asset to the extent that a cashrefund or a reduction in future payment is available.Contributions to a defined contribution pensionscheme payable more than twelve months afterthe period during which the employee rendered theservices, are discounted.Defined benefit pension schemesA defined benefit pension scheme is every postemploymentbenefit scheme other than a definedcontribution scheme. For each separate definedbenefit pension scheme, the net asset or liability isdetermined as the balance of the discounted valueof the future payments to employees and formeremployees, less the fair value of plan assets. Thecalculations are done by qualified actuaries usingthe projected unit credit method. The discount rateequals the yield on high quality corporate bondsas at the balance sheet date, with the period tomaturity of the bonds approximating the durationof the liability. If the calculation results in a positivebalance for the group, the asset is included up80 <strong>Annual</strong> Report 2010
Financial statements 2010to an amount equal to any unrecognized pastservice pension costs and the discounted value ofeconomic benefits in the form of possible futurerefunds or lower future pension premiums fromthe fund. In calculating the discounted value ofeconomic benefits, the lowest possible financingobligations are taken into account as applicable tothe individual schemes in force within the group.An economic benefit is receivable by the Group ifit can be realized within the period to maturity ofthe scheme or upon settlement of the scheme’sobligations. Actuarial gains and losses, includingany movements in limitations on the net pensionassets, are recognized in the unrecognized resultswithin the Consolidated statement of recognizedand unrecognized income and expenses. Pastservice costs are charged to the income statementon a straight-line basis over the average period untilthe benefits become vested, insofar as the benefitsare not granted unconditionally.Short-term employee benefitsShort-term employee benefit obligations aremeasured on an undiscounted basis and areexpensed as the related service is provided.A liability is recognized for the amount expectedto be paid under short-term cash bonus or profitsharingplans if the Group has a present legal orconstructive obligation to pay this amount as aresult of past services provided by the employee,and the obligation can be estimated reliably.Other long-term employee benefitsThe other long-term employee benefits consistmainly of jubilee benefits. The calculation of theseliabilities is based upon the actuarial assumptionsfor the predominant defined benefit scheme.3.17 Share-based remuneration plansMembers of the Board of Management are granteda conditional number of notional shares which aredistributed in cash. This conditional awarding ofnotional shares is linked to meeting the long-term(three years) performance criteria as explained inthe paragraph ‘Remuneration Committee’ in the<strong>report</strong> of the Supervisory Board over 2010.The fair value of the conditional number of notionalshares is determined on the date they are awardedand adjusted at each <strong>report</strong>ing date based onthe value development of the conditional numberof notional shares. If applicable, the impact ofthis determination and possible adjustment overa three-year period is recognized in the incomestatement. The fair value of the conditional numberof notional shares is recognized as an liability.3.18 ProvisionsProvisions are determined on the basis of estimatesof future outflows of economic benefits relatingto operational activities for legal or constructiveobligations of an uncertain size or with an uncertainsettlement date that arise from past events and forwhich a reliable estimate can be made. Provisions,if applicable, relate to reorganization, warranties,provisions for onerous contracts, legal proceedingsand submitted claims.Provisions for reorganization costs are recognizedwhen a detailed and formal plan is announced atbalance sheet date to all those concerned or whenthe execution of the plan has commenced.Provisions for warranties are recognized forwarranty claims relating to completed projects withagreed warranty periods applying to some of theconsolidated/proportionally consolidated entities.The book value of these provisions is based oncommon practice in the industry and the company’shistory of warranty claims over the past ten yearsfor relevant projects.A provision for onerous contracts is recognizedwhen the expected benefits to be derived bythe Group form a contract are lower than theunavoidable cost of meeting its obligations underthe contract.In accordance with the Group’s policy andapplicable legal requirements, a provision for siterestoration in respect of contaminated land, andthe related expenses, is recognized when the landis contaminated.Provisions are discounted insofar as the differencebetween the discounted value and nominal valueis material.3.19 Trade and other payablesTrade and other payables are recognized initiallyat fair value and subsequently at (amortized) cost.Insofar as the difference between the discountedand nominal value is not material, trade and otherpayables are stated at cost.Royal <strong>Boskalis</strong> Westminster nv81
Financial statements 20103.20 RevenueRevenue of the operational segments Dredging &Earthmoving and Maritime Infrastructure mainlyconsists of the cost price of the work done duringthe <strong>report</strong>ing period, plus a part of the expectedresults upon completion of the project in proportionto the progress made during the <strong>report</strong>ing period,and including and/or deducting the provisionsrecognized and/or used and released during the<strong>report</strong>ing period for expected losses. The applied“percentage-of-completion” method is, by itsnature, based on an estimation process. Revenuealso includes services rendered to third partiesduring the <strong>report</strong>ing period. The revenue fromservices relates in particular to hire personneland equipment and is recognized in the incomestatement in proportion to the stage of completionof the work performed at the <strong>report</strong>ing date.The stage of completion is determined based onassessments of the work performed.Revenue from salvage work that is completed atthe balance sheet date, but for which the proceedsare not finally determined between parties, isrecognized at expected proceeds taking intoaccount the estimation uncertainty.Revenue does not include any direct taxes. When itis uncertain whether the economic benefits of workdone or services rendered will flow to the Group,the relevant revenue is not recognized.3.21 Other incomeOther income mainly consists of book profits fromdisposals of and insurance results on property,plant and equipment.3.22 Raw materials, consumables and servicesRaw materials, consumables and services consist ofthe cost price of the work done during the <strong>report</strong>ingperiod, excluding personnel expenses, amortizationand depreciation. Raw materials, consumables andservices also include equipment utilization costs,cost of operational leases, general overhead costs,external costs for research and development wherenot capitalized, currency translation differences ontransactions in foreign currency and other results/late results. The limited costs for research anddevelopment are by their nature directly charged tothe income statement.3.23 Personnel expensesPersonnel expenses consist of wages and salariesfor own personnel and the related social securitycharges and pension costs, including paidand accrued contributions for defined pensioncontribution plans and the movement in the assetsand liabilities from defined benefit plans, excludingactuarial gains and losses and the limitation on netpension plan assets added or charged directly togroup equity.3.24 Lease paymentsPayments made under operating leases arerecognised in profit or loss on a straight-linebasis over the term of the lease. Lease incentivesreceived are recognised as an integral part of thetotal lease expense, over the term of the lease.Minimum lease payments made under financeleases are apportioned between the financeexpense and the reduction of the outstandingliability. The finance expense is allocated to eachperiod during the lease term so as to produce aconstant periodic rate of interest on the remainingbalance of the liability. Contingent lease paymentsare accounted for by revising the minimum leasepayments over the remaining term of the lease whenthe lease adjustment is confirmed.3.25 Finance income and expensesFinance income comprises interest received andreceivable from third parties, positive changes infair value of financial assets at fair value with fairvalue adjustments through the income statementand gains on financial instruments to hedge interestrate risks through the income statement. Interestincome is recognized in the income statement as itaccrues, using the effective interest rate method.Finance costs include interest paid and payableto third parties, which are allocated to <strong>report</strong>ingusing the effective interest rate method, negativechanges in fair value of financial assets at fair valuewith fair value adjustments through the incomestatement, arrangement fees and losses on financialinstruments to hedge interest rate risks through theincome statement.Borrowing costs not directly attributable to theacquisition, construction or production of aqualifying asset are recognized in the incomestatement using the effective interest rate method.82 <strong>Annual</strong> Report 2010
Financial statements 2010The interest component of finance lease paymentsis recognized in the income statement using theeffective interest rate method.3.26 Share in result of associated companiesShare in result of associated companiescomprises the share in the results after taxationof the participating interests not included in theconsolidation and, if applicable, (the reversal of)impairment losses recognized in the <strong>report</strong>ingperiod.3.27 Taxation / deferred income tax assets andliabilitiesTaxation is calculated on the basis of the resultbefore taxation for the <strong>report</strong>ing period, takinginto account the applicable tax provisions and taxrates, and also includes adjustments on taxationfrom previous <strong>report</strong>ing periods and movements indeferred taxes recognized in the <strong>report</strong>ing period.Taxation is included in the income statement unlessit relates to items directly recognized in equity, inwhich case taxation is included in equity. Temporarydifferences are accounted for in deferred tax assetsand/or deferred tax liabilities. Deferred tax assetsare only recognized to the extent that it is probablethat taxable profit will be available for realizationin the foreseeable future. Deferred tax assets arereviewed at each <strong>report</strong>ing date and are reducedto the extent that it is no longer probable that therelated tax benefit will be realized. Deferred taxassets and liabilities are offset if there is a legallyenforceable right to offset tax liabilities and assets,and they relate to income taxes levied by the sametax authority on the same taxable entity, or ondifferent tax entities, but they intend to settle taxliabilities and assets on a net basis or their taxassets and liabilities will be realized simultaneously.Deferred income tax assets and liabilities arerecognized at nominal value. Additional incometaxes that arise from the distribution of dividendsare recognized at the same time that the liability topay the related dividend is recognized.3.28 Profit per shareThe Group discloses profit per ordinary share aswell as diluted profit per ordinary share. The netprofit per ordinary share is calculated based onthe result attributable to the Group’s shareholdersdivided by the calculated average of the number ofissued ordinary shares during the <strong>report</strong>ing period.In calculating the dilluted profit per share the resultattributable to the Group’s shareholders and thecalculated average number of issued ordinaryshares are adjusted for all potentially diluting effectsfor ordinary shares.3.29 DividendsDividends are recognized as a liability in the periodin which they are declared.3.30 Determination of fair valueA number of the Group’s accounting policies anddisclosures require the determination of fair value,for both financial and non-financial assets andliabilities. Fair values have been determined formeasurement and/or disclosure purposes based onthe following methods:Property, plant and equipmentThe fair value of property, plant and equipmentrecognized as a result of a business combinationis based on market values. The market valueof property is the estimated amount for whicha property could be exchanged on the date ofvaluation between a willing buyer and a willingseller in an arm’s length transaction after propermarketing wherein the parties had each actedknowledgeably, prudently and without compulsion.Intangible assetsThe fair value of other intangible assets is based onthe discounted cash flows expected to be derivedfrom the use and eventual sale of the assets.Trade and other receivablesThe fair value of trade and other receivables, exceptdue from customers, is estimated as the presentvalue of future cash flows, discounted at the marketrate of interest at the <strong>report</strong>ing date. This fair valueis determined for disclosure purposes.Share-based payment transactionsThe fair value is determined based on quotedprices.DerivativesThe fair value of derivatives is based on theestimated amount to be paid or received for asettlement of the contract as at <strong>report</strong>ing dateRoyal <strong>Boskalis</strong> Westminster nv83
Financial statements 2010taking into account the actual interest rate en andthe credit rating of the counterparty. These fairvalue is based on broker quotes. Those quotes aretested for reasonableness by discounting estimatedfuture cash flows based on the terms and maturityof each contract and using market interest rates fora similar instrument at the measurement date.Non-derivative financial liabilitiesFair value, which is determined for disclosurepurposes, is calculated based on the presentvalue of future principal and interest cash flows,discounted at the market rate of interest at the<strong>report</strong>ing date.3.31 Consolidated statement of cash flowsThe consolidated statement of cash flows is drawnup using the indirect method. Cash is definedas cash and cash equivalents including bankoverdrafts as presented in the explanatory notesto the cash and cash equivalents and the interestbearingborrowings. Cash flows are presentedseparately in the statement of cash flows as cashflows from operating activities, investing activitiesand financing activities. Interest on long-termfinancing is recognized in the cash flow fromoperating activities. Dividends paid to shareholdersand holders of minority interests are recognized inthe cash flow from financing activities.3.32 Segment <strong>report</strong>ingFollowing the acquisition of SMIT in the first halfof 2010 the Group recognizes five operationalsegments which, as described below, constitutethe strategic business units of the Group. Thesestrategic business units offer different productsand services and are managed separately becausethey require different strategies. Each of thestrategic business units is reviewed by the Boardof Management based on internal management<strong>report</strong>ing at least once every quarter. Thefollowing is a brief summary of the activities of theoperational segments:• Dredging & EarthmovingThe main operational segment is Dredging& Earthmoving, which also includes portdevelopment, pipeline intervention activities,land reclamation, and coastal and riverbankprotection. This segment is active around theworld and can be divided into home markets(inside and outside Europe), international projectsand specialist niche services.• Harbour TowageThe second operational segment in whichRoyal <strong>Boskalis</strong> Westminster N.V. operates isHarbour Towage. The activities concern assistingincoming and departing seagoing vessels andother vessels including large container ships,roll-on roll-off ships, tankers carrying oil orchemicals, other bulk carriers and cargo ships, aswell as offshore oil and gas drilling platforms.• Salvage, Transport & Heavy LiftThis segment provides transport services withan array of different seaworthy transport vessels,some of which are self-propelled. With itsspecialist technical know-how, Heavy Lift carriesout specialist activities around the world usingfloating sheerlegs. Marine project operations areincluded in this segment (including various typesof transport, hoisting and installation activitiescarried out offshore) and subsea (underwateractivities with divers and remote controlequipment). Finally, this segment also includesthe salvage activities, consisting of providingwreck removal and emergency response services.• Terminal servicesThe fourth operational segment in which Royal<strong>Boskalis</strong> Westminster N.V. operates is Terminalservices. There is a strategic partnership withLamnalco, one of the world’s leading suppliersof maritime and terminal services to the oil andgas industry. The terminal services acquired fromSMIT are a key strategic addition to the existingactivities in this segment.• Maritime InfrastructureThe fifth operational segment is MaritimeInfrastructure. Royal <strong>Boskalis</strong> Westminster N.V.is involved in this segment through its strategicpartnership with Archirodon, a leading contractorin this sector.84 <strong>Annual</strong> Report 2010
Financial statements 2010The operational segments are monitored basedon the segment result before interest and taxes.The segment result is used for performancemeasurement of the operational segments, betweensegments as well as compared to other companiesin the same industries. Inter-operational segmentservices, if any, take place at arm’s length basis.During the <strong>report</strong>ing period there were no materialinter-operational segment services.In 2010 there were no changes to the bases ofsegmentation or to the method of determiningprofit or loss for the segments, other than theaforementioned recognition of operationalsegments.Royal <strong>Boskalis</strong> Westminster nv85
Financial statements 20104. Business combinationThe Group gained control of SMIT with effect from 1 April 2010 after acquiring nearly all outstanding SMIT sharesand voting rights (98.10%). This involved an increase in the stake in SMIT from 26.76% at the start of 2010 to98.19% at year-end 2010.SMIT is a global provider of services to the maritime sector. Its main client groups are active in shipping, oil andgas production, (offshore) construction, the insurance sector and shipyards. The business combination creates aworld-class maritime services provider that offers a platform for further growth.By acquiring control over SMIT, the Group is able to accelerate the realization of its corporate strategy. The Groupalso expects synergy effects to result in cost savings.It is expected that the Group’s potential will be strengthened further through economies of scale, the use of bestpractices, the optimization of the regional branch office network and joint purchasing opportunities.During 2010 SMIT contributed € 532.8 million to Group revenue and € 46.4 million to the net group profit. Thisdoes not include costs related to the acquisition and the result arising from the fair value revaluation of theGroup’s existing stake in SMIT at the date of acquisition. If the acquisition had taken place at the start of 2010,revenue for the <strong>report</strong>ing period would have totaled € 2,823 million and consolidated net group profit would havebeen € 322 million. In determining these amounts the same fair value adjustments as at the date of acquisitionwere assumed.The following main categories of considerations paid and amounts of acquired assets and liabilities wererecognized at the date of acquisition:Considerations paidAfter previously building up stakes SMIT in 2008 and 2009, <strong>Boskalis</strong> acquired SMIT through stock marketpurchases and a public offer for all remaining SMIT shares. In 2010 a total amount of € 788.1 million was involvedin these purchases plus associated costs, of which € 56.0 million up to the moment that control over SMITwas acquired.Identifiable assets and liabilities acquired(in € 1,000)Intangible assets 128,091Property, plant & equipment 982,416Investments in associated companies 17,843Deferred income tax assets 12,594Non-current receivables 10,990Stocks 18,403Trade and other receivables 206,940Cash, cash equivalents and bank overdrafts 56,930Loans and other financial obligations - 417,686Provisions - 45,423Employee benefits - 4,877Deferred tax liabilities - 85,541Trade and other payables - 224,098Non-controlling interests - 2,750Balance of identifiable assets 653,83286 <strong>Annual</strong> Report 2010
Financial statements 2010Review in the 12 months following the date of acquisition may lead to an adjustment of the fair value applied andthe goodwill referred to below.Trade accounts and other receivables consisted of a gross amount of contractual obligations of € 222.5 million, ofwhich an amount of € 15.6 million was deemed irrecoverable at the date of acquisition.GoodwillGoodwill arising from the acquisition:(in € 1,000)Total considerations paid 732,076Fair value of existing shareholding in SMIT 349,571Non-controlling interest 20,5681,102,215Minus: balance of identifiable assets - 653,832Goodwill 448,383The value of the non-controlling interest is based on the fair value of the SMIT share at the date of acquisition, i.e.€ 60.00 plus acquisitions costs.Revaluation to fair value of the Group’s existing stake in SMIT resulted in a recognized gain of € 17.3 million whichis included in the item Share in result of associated companies. This item is included in ‘Holding & eliminations’ inthe table ‘Operational segments’ in note 5.1.Goodwill recognized as a result of the acquisition is mainly related to the expertise and technical skills of SMIT’semployees and the synergies which are expected to ensue from the integration of the company into the Group’sexisting activities. The goodwill recognized is not expected to be tax deductible.Transactions related to the acquisitionThe Group incurred acquisition-related expenses of € 21.3 million in connection with the costs of externaladvisors, due diligence, fees paid to the institutions involved and other integration costs. These costs arerecognized in the income statement in the item Raw materials, consumables and services. This item is included in‘Holding & eliminations’ in the table ‘Operational segments’ in note 5.1.Royal <strong>Boskalis</strong> Westminster nv87
Financial statements 20105. Segment <strong>report</strong>ing5.1 Operational segments2010Dredging andearthmovingHarbourTowageSalvage,Transport &Heavy LiftTerminalservicesMaritimeinfrastructureHolding &eliminationsGroupRevenue 1,801,082 155,451 296,533 147,543 264,690 9,140 2,674,439Segment result 320,468 23,177 42,986 22,340 28,851 - 35,952 401,870Operating result 401,870Share in result of associated companies 3,475 74 323 227 — 20,874 24,973Non-allocated finance income and expenses - 36,836Non-allocated taxation - 77,125Net group profit 312,882Segment assets 2,145,717 765,090 790,357 533,891 220,623 - 207,842 4,247,836Investments in associated companies 8,002 8,121 1,851 2,187 — 456 20,617Non-allocated assets 46,800Total assets 4,315,253Segment liabilities 972,255 359,246 207,923 65,881 114,774 - 125,313 1,594,766Non-allocated liabilities 1,121,193Total liabilities 2,715,959Investments in property, plant and equipment 183,856 20,906 46,902 41,616 6,684 30,383 330,347Depreciation on property, plant and equipment 103,371 27,608 31,964 22,861 18,006 915 204,725Amortisation of intangible assets — 2,296 1,138 2,238 — 478 6,150Impairment losses on property, plant and equipment 8,729 — — — — — 8,729219,6042009Dredging andearthmovingHarbourTowageSalvage,Transport &Heavy LiftTerminalservicesMaritimeinfrastructureHolding &eliminationsGroupRevenue 1,813,909 — — 60,022 301,248 — 2,175,179Segment result 216,566 — — 12,955 28,758 - 9,008 249,271Operating result 249,271Share in result of associated companies, including reversalof impairment loss - 3,006 — — - 473 — 61,823 58,344Non-allocated finance income and expenses - 12,469Non-allocated taxation - 65,981Net group profit 229,165Segment assets 2,039,460 — — 161,822 287,982 — 2,489,264Investments in associated companies 8,409 — — 1,312 — — 9,721Non-allocated assets 304,565Total assets 2,803,550Segment liabilities 1,082,423 — — 27,752 172,468 — 1,282,643Non-allocated liabilities 215,986Total liabilities 1,498,629Investments in property, plant and equipment 253,522 — — 26,517 15,665 — 295,704Depreciation on property, plant and equipment 115,890 — — 6,980 24,174 — 147,044Impairment losses on property, plant and equipment 48,633 — — — — — 48,633195,677The non-allocated assets comprise deferred tax assets, income tax receivable and derivatives. The non-allocated liabilitiescomprise deferred tax liabilities, income tax payable, derivatives and interest-bearing borrowings.88 <strong>Annual</strong> Report 2010
Financial statements 2010The revenue of the segments Dredging and earthmoving and Maritime infrastructure mainly comprises revenuesfrom work in progress. Movements in the value of work in progress, consisting of cumulative incurred costs plusprofit in proportion to progress less provisions for losses, together with the work done and completed during the<strong>report</strong>ing period, determine the revenue for these segments.The revenue from services rendered to third parties is mainly realized in the remaining operational segments.If certain projects are executed together in a joint venture, the segments only <strong>report</strong> their own share in therevenue and results recognized, resulting in no material related party transactions that need to be eliminated.A large part of the Group’s projects in progress is directly or indirectly with public sector authorities in variouscountries and geographical areas. Because of the spread of the contracts none of these clients qualifies as amaterial client in relation to the total revenue of the Group.5.2 Revenue by regionNetto-omzet2010 2009Netherlands 517,238 316,218Rest of Europe 585,283 431,842Australia / Asia 625,566 370,310Middle East 371,005 662,236Africa 227,534 163,828North and South America 347,813 230,7452,674,439 2,175,1795.3 Movement in work in progressRevenue includes the movements in work in progress of € 102.5 million (2009: € 950.9 million).6. Other incomeOther income comprises insurance results amounting to € 29.4 million (2009: nil), the settlement of claimsamounting to € 4.2 million (2009: nil) and book results on the disposal of equipment.7. Raw materials, consumables and servicesDuring 2010 € 6.7 million was recognized as an expense in the consolidated income statement of operatingleases (2009: nil) through limited partnerships (Dutch: ‘CV-contructions’). The Group has an option to purchasethese vessels 8 years after the commencement of the lease period at a fixed price.Raw materials, consumables and services include an amount of € 14.1 million (2009: nil) with regard to anonerous contract concerning a leased vessel.In respect of other operational lease agreements € 45.3 million was recognized in the consolidated incomestatement (2009: € 19.7 million).8. Personnel expenses2010 2009Wages and salaries - 430,921 - 242,002Social security costs - 38,132 - 20,001Pension costs for defined benefit pension schemes - 11,456 - 10,995Pension costs for defined contribution pension schemes - 15,943 - 10,306- 496,452 - 283,304For the costs of remuneration of the Board of Management and the Supervisory Board reference is made tonote 29.2.Royal <strong>Boskalis</strong> Westminster nv89
Financial statements 20109. Finance income and expenses2010 2009Interest income on short-term bank deposits 5,005 1,195Other finance income 18,233 —Finance income 23,238 1,195Interest expenses - 28,833 - 8,531Other finance expenses - 31,241 - 5,133Finance expenses - 60,074 - 13,664Net finance expense recognized in consolidated income statement - 36,836 - 12,469Other finance income of € 18.2 million relates to currency gains on loans denominated in U.S. dollars andBritish pounds.The other finance expenses concern in particular the fair value adjustments on hedging instruments on loansdenominated in U.S. dollars and British pounds for € 18.2 million (2009: nil) and the settlement of a forward startinterest rate swap for € 9.6 million (2009: nil). The remaining comprise mainly commitment fees.10. Taxation2010 2009Current tax expenseCurrent year - 82,470 - 67,789Over / under(-) provided in prior years 12,197 2,045Reclassification from deferred to current tax liabilities - 13,718 11,029- 83,991 - 54,715Deferred tax expenseOrigination and reversal of temporary differences - 5,124 - 454Reduction in tax rate - 38 —Reclassification to current tax expense 13,718 - 11,029Movement of recognized tax losses carried forward - 1,690 2176,866 - 11,266Taxation in the consolidated income statement - 77,125 - 65,981The operational activities of Royal <strong>Boskalis</strong> Westminster N.V. are subject to various tax regimes with tax ratesvarying from 0% to 40% (2009: 0% to 40%). These different tax rates, together with fiscal facilities in variouscountries and the treatment of tax losses, results not subject to taxation and non-deductible costs, lead to aneffective tax rate in the <strong>report</strong>ing period of 19.8% (2009: 22.4%). The changing geographic spread of activitiesaffects the effective tax rate as a consequence of the application of different local nominal tax rates. The effectivetax rate is calculated as the taxation charge divided by the profit before taxation, as shown in the consolidatedincome statement. The reconciliation between the Dutch nominal tax rate and the effective tax rate is as follows:2010 2009Nominal tax rate in the Netherlands 25.5% 25.5%Application of local nominal tax rates - 4.7% 5.2%Non-deductible expenses 3.0% 2.7%Effect of previously non-balancing and unrecognized tax losses 0.7% 1.2%Effect of previously non-recognized tax losses - 0.3% - 1.4%Special taxation regimes - 3.3% - 4.8%Effect of share in result of associated companies - 1.1% - 6.0%Effective tax rate 19.8% 22.4%90 <strong>Annual</strong> Report 2010
Financial statements 201011. Income tax receivable and payableThe current income tax receivable and income tax payable relate to the fiscal positions of the Group companiesconcerned and consist of fiscal years still to be settled less withholding taxes or tax refunds.12. Deferred income tax assets and liabilitiesBalance as at January 1, 2010Movement in temporarydifferences during the yearBalance as atDecember 31, 2010AssetLiabilityCharged (-)/added tonet profitCharged toequityBusinesscombinationCurrencytranslationdifferences Asset LiabilityIntangible assets — — 980 — - 27,082 - 788 — - 26,890Property, plant and equipment 1,832 - 13,073 9,869 — - 57,053 709 7,508 - 65,224Due from and due to customers — - 6,298 - 146 — - 815 - 492 — - 7,751Trade and other receivables 67 — - 197 — 211 5 239 - 153Hedging reserve — - 2,282 - 2,708 938 3,808 2 645 - 887Actuarial gains and losses and assetlimitation on defined benefit pension schemes 5,234 — - 305 5,358 — — 10,287 —Employee benefits 982 - 5,230 - 2,564 - 235 1,448 - 155 950 - 6,704Provisions 1,929 - 568 310 — 5,164 169 7,648 - 644Interest-bearing borrowings — — 23 — - 1,212 - 101 550 - 1,840Trade and other payables 914 - 4,775 5,761 — — 207 2,237 - 130Other assets and liabilities 3,446 - 878 - 3,983 563 2,852 - 3,531 476 - 2,007Fiscal reserves — — - 407 — - 787 — — - 1,194Foreign branch results — - 6,125 1,923 — — — — - 4,202Tax losses carried forward 2,306 — - 1,690 — 519 522 1,659 - 216,710 - 39,229 6,866 6,624 - 72,947 - 3,453 32,199 - 117,628Offsetting deferred tax assets and liabilities - 9,997 9,997 - 13,493 13,493Net in the consolidated balance sheet 6,713 - 29,232 18,706 - 104,135Balance as at January 1, 2009Movement in temporarydifferences during the year Balance as at December 31, 2009AssetLiabilityCharged (-)/added tonet profitCharged toequityBusinesscombinationCurrencytranslationdifferences Asset LiabilityProperty, plant and equipment 321 - 8,971 - 2,739 168 — - 20 1,832 - 13,073Due from and due to customers — - 2,531 - 3,788 — — 21 — - 6,298Trade and other receivables 31 — 37 — — - 1 67 —Hedging reserve 652 - 3,078 - 897 1,054 — - 13 — - 2,282Actuarial gains and losses and assetlimitation on defined benefit pension schemes 8,177 — — - 2,943 — — 5,234 —Employee benefits 824 - 4,903 163 - 327 — - 5 982 - 5,230Provisions 705 - 729 1,446 — — - 61 1,929 - 568Trade and other payables 997 — - 5,145 — — 287 914 - 4,775Other assets and liabilities 309 - 1,570 2,693 1,576 — - 440 3,446 - 878Foreign branch results — - 2,872 - 3,253 — — — — - 6,125Tax losses carried forward 2,150 — 217 — — - 61 2,306 —14,166 - 24,654 - 11,266 - 472 — - 293 16,710 - 39,229Offsetting deferred tax assets and liabilities - 7,566 7,566 - 9,997 9,997Net in the consolidated balance sheet 6,600 - 17,088 6,713 - 29,232Royal <strong>Boskalis</strong> Westminster nv91
Financial statements 2010Deferred tax assets are not recognized as long as it is not probable that economic benefits can be expected infuture periods. Deferred tax assets and liabilities within fiscal entities are offset in the balance sheet.The following movements in deferred tax assets and liabilities, including applicable tax rate changes, together withthe items they relate to, are recognized directly in group equity:2010Before taxTax (expense)benefitNet of taxForeign currency translation differences for foreign operations 37,864 563 38,427Cash flow hedges - 11,554 938 - 10,616Defined benefit plan actuarial gains (losses) and asset limitation - 28,593 5,123 - 23,470- 2,283 6,624 4,3412009Before taxTax (expense)benefitNet of taxForeign currency translation differences for foreign operations - 5,800 1,744 - 4,056Cash flow hedges 1,473 1,054 2,527Defined benefit plan actuarial gains (losses) and asset limitation 21,826 - 3,270 18,55617,499 - 472 17,027Unrecognized deferred income tax assetsUnrecognized deferred tax assets regarding tax losses carried forward of Group companies amount to € 58.4million (2009: € 43.5 million), of which € 1.4 million (2009: € 0.0 million) expires within one year, € 17.3 million(2009: € 12.2 million) in between one and five years, and € 40.1 million (2009: € 31.3 million) after more than fiveyears. These deferred tax assets are not recognized in the balance sheet as long as recovery through taxableprofit or deductible temporary differences before expiration is not probable.92 <strong>Annual</strong> Report 2010
Financial statements 201013. Intangible assetsGoodwill Other TotalBalance as at January 1, 2010Cost 13,595 — 13,595Accumulated depreciation — — —Book value 13,595 — 13,595MovementsAcquisitions through business combinations 448,383 128,091 576,474Amortisation — - 6,150 - 6,150Currency translation differences and other movements — 9,758 9,758448,383 131,699 580,082Balance as at December 31, 2010Cost 461,978 137,849 599,827Accumulated depreciation — - 6,150 - 6,150Book value 461,978 131,699 593,677Goodwill Other TotaalBalance as at January 1, 2009Cost 13,595 5,800 19,395Accumulated depreciation — — —Book value 13,595 5,800 19,395MovementsCurrency translation differences and other movements — - 5,800 - 5,800— - 5,800 - 5,800Balance as at December 31, 2009Cost 13,595 — 13,595Accumulated depreciation — — —Book value 13,595 — 13,59513.1 GoodwillThe goodwill recognized in 2010 completly relates to the business combination with SMIT. The goodwill hasbeen allocated to the cash generating unit representing the lowest level within the Group at which the goodwill ismonitored for internal management purposes, which does not exceed the level of the Group’s operating units.Goodwill already recognized at the end of 2009 which has been allocated to the Mexico home market and relatesto the increased shareholdings in Dragamex SA de CV and Codramex SA de CV from 50% to 100% in 2008, wassubject to impairment testing at the end of 2010.Royal <strong>Boskalis</strong> Westminster nv93
Financial statements 2010The goodwill per cash generating unit amounts to:2010 2009SMIT Harbour Towage 186,435 —SMIT Salvage, Transport & Heavy Lift 178,965 —SMIT Terminals 82,983 —448,383 —Home market Mexico 13,595 13,595Total 461,978 13,595In the impairment testing of goodwill the value in use of the cash generating unit is determined by discountingexpected future cash flows from continuing operations of the unit. Management has projected cash flows basedon past trends and estimates of market developments. The calculation includes cash flow projections for a periodof five years, after which the cash flows are extrapolated using an assumed growth rate for the revenue of 2%per year and an unchanged operating profit. This growth rate does not exceed the long-term average growth ratewhich may be expected for the activities of the cash generating unit. The average discount rate used reflectsthe risks specific to the cash generating units and is 8.0% for SMIT Harbour Towage, 10.0% for SMIT Salvage,Transport & Heavy Lift, 8.0% for SMIT Terminals and 11.1% for the Mexico home market.After performing the assessment indicated that no impairment is necessary since the recoverable amount ishigher than to the recognized goodwill and the carrying amount of the assets and liabilities attributable to thecash generating unit. Reasonable cause for change in the principles of calculating recoverable amount at yearend as an increase in the discount rate by 1% or a decrease in growth rate by 1% does not give any indicationfor impairment.13.2 Other intangible assetsOther intangible assets mainly comprise intangible assets which were recognized as a result of acquisitions. Thisbalance item primarily relates to customer portfolios and trademarks recognized during the business combinationwith SMIT.14. Property, plant and equipmentLand andbuildingsFloatingand otherconstructionequipmentOther fixedassetsProperty, plant& equipmentunderconstructionTotalBalance as at January 1, 2010Cost 66,512 1,815,358 34,926 257,945 2,174,741Accumulated depreciation and impairment losses - 22,974 - 1,053,867 - 26,552 - 11,560 - 1,114,953Book value 43,538 761,491 8,374 246,385 1,059,788MovementsAdditions 7,918 92,743 4,472 225,214 330,347Acquisitions through business combinations 3,015 823,596 25,407 130,398 982,416Put into operation 279 482,210 - 7,456 - 475,033 —Impairment losses recognised — - 8,393 - 336 — - 8,729Depreciation - 3,477 - 194,952 - 6,296 — - 204,725Disposals and other movements - 2,656 - 27,462 242 1,032 - 28,844Currency translation differences 196 40,094 408 7,674 48,3725,275 1,207,836 16,441 - 110,715 1,118,837Balance as at December 31, 2010Cost 71,611 3,205,416 57,504 147,252 3,481,783Accumulated depreciation and impairment losses - 22,798 - 1,236,089 - 32,689 - 11,582 - 1,303,158Book value 48,813 1,969,327 24,815 135,670 2,178,62594 <strong>Annual</strong> Report 2010
Financial statements 2010Land andbuildingsFloatingand otherconstructionequipmentOther fixedassetsProperty, plant &equipment underconstructionTotalBalance as at January 1, 2009Cost 72,425 1,590,851 60,865 239,190 1,963,331Accumulated depreciation and impairment losses - 27,747 - 905,731 - 50,564 — - 984,042Book value 44,678 685,120 10,301 239,190 979,289MovementsAdditions 2,348 38,218 5,000 250,138 295,704Put into operation 387 214,943 105 - 215,435 —Impairment losses recognised — - 37,073 — - 11,560 - 48,633Depreciation - 3,247 - 139,226 - 4,571 — - 147,044Disposals and other movements - 657 - 576 - 2,524 - 15,259 - 19,016Currency translation differences 29 85 63 - 689 - 512- 1,140 76,371 - 1,927 7,195 80,499Balance as at December 31, 2009Cost 66,512 1,815,358 34,926 257,945 2,174,741Accumulated depreciation and impairment losses - 22,974 - 1,053,867 - 26,552 - 11,560 - 1,114,953Book value 43,538 761,491 8,374 246,385 1,059,788As a result of radically changed market conditions ensuing from the global recession, a study into rationalizationof the dredging fleet was performed in 2009 and the realizable value of the floating equipment and otherconstruction equipment was further assessed. The resulting impairment loss was recognized in the 2009income statement.The Group leases various assets through financial lease agreements. The book value of the leased vessels was€ 5.5 million at the end of 2010 (2009: nil).The securities provided for financing granted by means of mortgage rights on property, plant and equipment aredisclosed in note 22.15. Associated companies2010 2009Balance as at January 1 298,674 218,366New in consolidation 17,843 —Dividends received - 17,611 - 1,500Investment in Smit Internationale N.V. 56,061 17,425Other net investments - 5,678 149Share in result of associated companies 7,657 23,076Revaluation of existing participation prior to business combination 17,316 —Reversal of impairment losses — 35,26824,973 58,344Share in direct equity movements — 1,17724,973 59,521Reduction due to expansion of participation resulting in acquiring controlover the associated company - 349,571 —Currency translation and other differences - 4,074 4,713Balance as at December 31 20,617 298,674Royal <strong>Boskalis</strong> Westminster nv95
Financial statements 2010The key associated companies of the Group are:Ownership interestCompany Country of incorporation 2010 2009IRSHAD Abu Dhabi, United Arab Emirates 20% 20%RW Aggregates Ltd United Kingdom 50% 50%Dafeng Smit Towage Company Ltd China 40% —Taizhou Smit Towage Services Co Ltd China 40% —Damietta for Maritime Services Company S.A.E. Egypt 31% —Fleetcare Services Pte Ltd Singapore 45% —Smit Internationale N.V. The Netherlands — 27%At year-end 2009 the Group has a 26.76% shareholding in SMIT. In the course of 2010 this interest was increasedto 98.19%, with the Group gaining control of SMIT on April 1, 2010. Ever since, SMIT has been included in theGroup consolidation.The voting rights in associated companies are equal to the ownership interests. The share of the Group in assets,liabilities, revenue and result of the aforementioned associated companies is stated below:2010 2009Assets 26,932 338,431Liabilities - 18,153 - 160,419Equity 8,779 178,012Revenues 53,963 156,443Share in result 7,657 23,07616. Other non-current receivables2010 2009Balance as at January 1 6,019 8,527New in consolidation 10,990 —Movements 23,022 - 3,146Movement in measurement at amortized cost — 781Currency translation differences 342 - 143Balance as at December 31 40,373 6,019The other non-current receivables comprise loans to associated companies, long-term advance payments tosuppliers and long-term retentions from customers, which are due in agreed time periods.17. Inventories2010 2009Fuel and materials 29,686 24,539Spare parts 54,585 42,726Other inventories 2,635 2,40686,906 69,671During 2010 € 96.0 million (2009: € 64.3 million) of inventories was recognized as an expense and € 4.5 million(2009: € 4.5 million) was written off through the income statement, while € 0.4 million was reversed through theincome statement (2009: € 1.6 million).96 <strong>Annual</strong> Report 2010
Financial statements 201018. Due from and due to customers2010 2009Cumulative incurred costs plus profit in proportion to progress less provisions for losses 3,781,111 3,635,811Progress billings 3,984,425 3,849,483Advances received 78,780 153,455Progress billings and advances received 4,063,205 4,002,938Balance - 282,094 - 367,127Due from customers 197,170 140,086Due to customers - 479,264 - 507,213Balance - 282,094 - 367,127As at year-end 2010 the items related to payments due from customers amounted to a total of € 11.6 million(2009: € 23.0 million) which will not be paid until specified conditions are fulfilled (retentions) in respect ofcontracts for work in progress for third parties. The determination of the profit in proportion to the stage ofcompletion and the provision for losses is based on estimates of the costs and revenues of the relating projects.These estimates are uncertain.19. Trade and other receivables2010 2009Trade receivables 550,080 427,505Amounts due from associated companies 9,672 2,623Other receivables and prepayments 233,587 171,508793,339 601,63620. Cash and cash equivalents2010 2009Bank balances and cash 200,018 199,254Short-term bank deposits 157,726 395,582Cash and cash equivalents 357,744 594,836Bank overdrafts - 1,475 - 1,347Net cash and cash equivalents in the consolidated statement of cash flows 356,269 593,489Cash and cash equivalents include € 59.2 million (2009: € 72.5 million) held by project-driven constructionconsortiums and € 93.8 million (2009: € 89.5 million) held by strategic alliances, which are subject to jointcontrol. The remaining funds were freely disposable at year-end 2010.Royal <strong>Boskalis</strong> Westminster nv97
Financial statements 201021. Group equity21.1 Issued capital and share premiumThe authorized share capital of € 240 million is divided into 150,000,000 ordinary shares with a par value of€ 0.80 each and 50,000,000 cumulative protective preference shares with a par value of € 2.40 each.Issued capital increased by 2,322,974 ordinary shares in the course of 2010 as a result of the distribution ofstock dividend. The movement in issued share capital is as follows:(in number of shares) 2010 2009On issue and fully paid at January 1 98,651,289 85,799,361Optional dividend 2,322,974 3,832,322Issue of ordinary shares — 9,019,606On issue and fully paid at December 31 100,974,263 98,651,289The issued capital as at December 31, 2010 consists of 100,974,263 ordinary shares with a par value of € 0.80each and consequently amounts to € 80.8 million (2009: € 78.9 million).Of the issued capital as at December 31, 2010, six ordinary shares were owned by Royal <strong>Boskalis</strong>Westminster N.V.The as yet unexercised option right to take cumulative protective preference shares in Royal <strong>Boskalis</strong> WestminsterN.V. has been assigned to the Stichting Continuiteit KBW.Share premium comprises additional paid-in capital exceeding the par value of outstanding shares. Sharepremium is distributable free of tax.21.2 Retained earningsRetained earnings consist of additions and distributions based on profit appropriations, effects of changes inaccounting principles and losses and movements in the legal reserve. The balance is at the disposal of theshareholders. Retained earnings also comprises the yet unappropriated current year profit. A proposal for profitappropriation is included in note 28 relating to subsequent events.21.3 DividendsRoyal <strong>Boskalis</strong> Westminster N.V. announced and distributed the following dividends to holders of ordinary shares:2010 2009Dividends previous year € 1.19 respectively € 1.19 per ordinary share 117,395 102,101Total announced and distributed dividend 117,395 102,101Stock dividend 73,258 66,129Cash dividend 44,137 35,972Total distributed dividend 117,395 102,10198 <strong>Annual</strong> Report 2010
Financial statements 201021.4 Earnings per shareEarnings per share over 2010 amount to € 3.11 (2009: € 2.58). Because there are no dilution effects, the dilutedearnings per share also amount to € 3.11 (2009: € 2.58). The calculation of earnings per share is based on theprofit attributable to shareholders of € 310.5 million (2009: € 227.9 million) and the weighted average number ofordinary shares for the year 2010, 99,962,337 (2009: 88,371,852). This number is calculated as follows:(in number of shares) 2010 2009Issued ordinary shares as at January 1 98,651,289 85,799,361Weighted effect of ordinary shares issued due to optional dividend 1,311,048 2,152,400Weighted effect of ordinary shares issued — 420,091Weighted average number of ordinary shares during the fiscal year 99,962,337 88,371,85221.5 Other reservesMovement in other reserves:Legal reserves(in € 1,000)Other legalreserveHedgingreserveRevaluationreserveCurrencytranslationreserveActuarialreserveTotal otherreservesNote [21.5.1] [21.5.2] [21.5.3] [21.5.4] [21.5.5]Balance as at January 1, 2010 132,725 8,262 3,834 - 37,542 - 30,098 77,181Foreign currency translation differences for foreign operations — — — 36,909 — 36,909Cash flow hedges, after taxation — - 10,616 — — — - 10,616Defined benefit plan actuarial gains (losses) and asset limitation,after taxation — — — — - 23,470 - 23,470Movement legal reserve 70,799 — — — — 70,799Total movement 70,799 - 10,616 — 36,909 - 23,470 73,622Balance as at December 31, 2010 203,524 - 2,354 3,834 - 633 - 53,568 150,803Legal reserves(in € 1.000)Other legalreserveHedgingreserveRevaluationreserveCurrencytranslationreserveActuarialreserveTotal otherreservesNote [21.5.1] [21.5.2] [21.5.3] [21.5.4] [21.5.5]Balance as at January 1, 2009 107,351 5,735 3,834 - 32,877 - 48,654 35,389Foreign currency translation differences for foreign operations — — — - 4,665 — - 4,665Cash flow hedges, after taxation — 2,527 — — — 2,527Defined benefit plan actuarial gains (losses) and asset limitation,after taxation — — — — 18,556 18,556Movement legal reserve 25,374 — — — — 25,374Total movement 25,374 2,527 — - 4,665 18,556 41,792Balance as at December 31, 2009 132,725 8,262 3,834 - 37,542 - 30,098 77,181Royal <strong>Boskalis</strong> Westminster nv99
Financial statements 201021.5.1 Other legal reserve (legal reserve)With regard to the difference between the cost price and equity value of entities, consolidated eitherproportionally as well as associated companies recognized in accordance with the equity method, a legallyrequired reserve is recognized because of a lack of control over the distribution of profits only to the extent thatthese differences are not included in the accumulated currency translation differences on foreign operations.21.5.2 Hedging reserve (legal reserve)The hedging reserve comprises the fair value of effective cash flow hedges, not yet realized at balance sheetdate, net of taxation, including results realized on the “rolling forward” of existing hedges as a result of differencesbetween the duration of the hedges concerned and the underlying cash flows. Details about the movements inthe hedging reserve are disclosed in note 26.2.21.5.3 Revaluation reserve (legal reserve)This reserve relates to the revaluation of property, plant and equipment prior to the business combination during2008 through which the shareholding in Dragamex SA de CV and Codramex SA de CV were raised from 50%to 100%.21.5.4 Currency translation reserve (legal reserve)The currency translation reserve comprises all accumulated currency translation differences arising from thetranslation of investments in foreign operations, which are denominated in <strong>report</strong>ing currencies other thanthose used by the Group, including the related intragroup financing. These currency translation differences areaccumulated as from the IFRS transition date (January 1, 2004) and are taken into the income statement atdisposal or termination of these foreign operations.21.5.5 Actuarial reserveThe actuarial reserve relates to the limitation on net plan assets of defined benefit pension schemes and theactuarial gains and losses, which originated from the difference between the realized and the expected movementin defined benefit obligations and the return on plan assets.22. Interest-bearing borrowings2010 2009Non-current liabilitiesMortgage loans 181,451 4,538Other bank loans 523,552 52,900705,003 57,438Current liabilitiesMortgage loans (current portion) 35,173 1,263Other bank loans (current portion) 67,593 21,382102,766 22,645Total interest-bearing borrowings 807,769 80,083100 <strong>Annual</strong> Report 2010
Financial statements 2010To finance the acquisition of SMIT and the refinancing or replacement of existing bank facilities provided to SMITand the Group, in March 2010 the Group arranged a combination of a three-year and five-year bank facility (€ 350million and € 300 million, respectively) and a temporary bridge facility (€ 400 million) with a consortium of banks. InJuly 2010 the temporary bridge facility was repaid and terminated.In July 2010 the Group closed an inaugural US$ 433 million and GBP 11 million US private placement with 26institutional investors in the United States and the United Kingdom. The placement consists of three tranches withmaturities of 7, 10 and 12 years, respectively. The US dollar and sterling proceeds have been swapped by meansof a cross currency swap into euros, for a total amount of € 354 million.As security for the mortgage loans, mortgage rights are vested on property, plant and equipment, mainly vessels,with a book value of € 333.6 million (2009: € 47.0 million). For certain loans, additional securities have beenprovided by means of the assignment of revenues from rental contracts to third parties and insurance policiesregarding this property, plant and equipment.If applicable, financial ratio and negative pledge clause requirements are met as at December 31, 2010.Effective interest rates, remaining terms and currencies of the interest-bearing borrowings are disclosed in theexplanatory notes to the financial instruments in the interest rate risk paragraph. As at December 31, 2010, theaverage interest rate for the non-current portion of mortgage loans and other bank loans was 5.04% (2009:4.13%) and 3.65% (2009: 5.14%) respectively. The non-current portions of mortgage loans and other bank loansdue over more than five years amount to € 53.8 million (2009: € 0.0 million) and € 348.7 million (2009: € 3.3 million)respectively.23. Employee benefitsThe liabilities associated with employee benefits consist of defined benefit pension schemes and other liabilitiesrelating to a number of defined contribution schemes in foreign countries and jubilee benefits. They amount to atotal of:Toelichting 2010 2009Defined benefit pension schemes [23.1] 26,861 8,378Other liabilities on account of employee benefits 9,035 5,362Employee benefits 35,896 13,740The other liabilities on account of employee benefits changed during 2010 mainly due to the liabilities new inconsolidation amounting to € 3.7 million.Royal <strong>Boskalis</strong> Westminster nv101
Financial statements 201023.1 Defined benefit pension schemesDefinedbenefitobligationFair valueplan assetsSurplus/deficit (-)UnfundedpensionliabilitiesTotalCharged toconsolidatedincomestatementRecognizeddirectlyin equityBalance as at January 1, 2010 327,872 327,935 63 - 8,288 - 8,225Current service cost 10,318 — - 10,318 - 790 - 11,108 11,108 —Interest cost on obligation 24,289 — - 24,289 - 431 - 24,720 24,720 —Contributions received — 22,576 22,576 — 22,576 — —Expected return on plan assets — 24,372 24,372 — 24,372 - 24,372 —Net actuarial gains / losses 35,936 18,770 - 17,166 - 289 - 17,455 — 17,455Benefits paid - 25,170 - 25,170 — 969 969 — —Other movements 1,084 — - 1,084 — - 1,084 — —New in consolidation 209,740 209,155 - 585 - 44 - 629 — —Foreign currency exchange rate changes 2,501 2,519 18 - 284 - 266 — —Total movement 258,698 252,222 - 6,476 - 869 - 7,345 11,456 17,455Balance as at December 31, 2010 586,570 580,157 - 6,413 - 9,157 - 15,570 11,456 17,455Limitation on net plan assets as at January 1 - 153Movement in limit on net plan assets - 11,138 — 11,138Limitation on net plan assets as at December 31 - 11,291Balance as at December 31, 2010 after limitation on net plan assets - 26,861Total result defined benefit pension schemes 40,049 11,456 28,593DefinedbenefitobligationFair valueplan assetsSurplus/deficit (-)UnfundedpensionliabilitiesTotalCharged toconsolidatedincomestatementRecognizeddirectlyin equityBalance as at January 1, 2009 301,853 287,007 - 14,846 - 7,598 - 22,444Current service cost 8,296 — - 8,296 - 853 - 9,149 9,149 —Interest cost on obligation 15,839 — - 15,839 - 413 - 16,252 16,252 —Contributions received — 10,486 10,486 — 10,486 — —Expected return on plan assets — 14,406 14,406 — 14,406 - 14,406 —Net actuarial gains / losses 13,592 27,081 13,489 - 290 13,199 — - 13,199Benefits paid - 14,539 - 14,539 — 792 792 — —Foreign currency exchange rate changes 2,831 3,494 663 74 737 — —Total movement 26,019 40,928 14,909 - 690 14,219 10,995 - 13,199Balance as at December 31, 2009 327,872 327,935 63 - 8,288 - 8,225 10,995 - 13,199Limitation on net plan assets as at January 1 - 8,780Movement in limit on net plan assets 8,627 — - 8,627Limitation on net plan assets as at December 31 - 153Balance as at December 31, 2009 after limitation on net plan assets - 8,378Total result defined benefit pension schemes - 10,831 10,995 - 21,826102 <strong>Annual</strong> Report 2010
Financial statements 2010Some of the Dutch staff participate in three multi-employer pension funds, i.e. “Stichting Bedrijfstak pensioenfondsvoor de Waterbouw”, "Stichting Bedrijfspensioenfonds voor de Koopvaardij" and “Stichting Bedrijfspensioenfonds voor de Rijn- en binnenvaart”. These pension funds qualify under IFRS as defined benefit pensionschemes. However, the funds have indicated they are not able to provide sufficient information for a calculationin accordance with IFRS because there is no reliable and consistent basis to attribute the pension obligations,plan assets, income and expenses to the individual member companies of these pension funds. Therefore thesepension schemes are treated as defined contribution schemes. On the basis of the information that is available,including the 2009 financial statements and the 2010 preliminary financial information of the funds, it is notprobable that any pension liability or asset to be recognized would arise under IFRS. There is also no reason toexpect that the financial position of these funds as at December 31, 2010 will affect the amount of contributionsto be charged in the future.The defined benefit pension schemes that are funded are the company pension funds in the Netherlands,Belgium, the United Kingdom, United States of America, Canada and South Africa. The defined benefit pensionschemes that are unfunded are small pension schemes for two German Group companies and Archirodon. Theremaining pension schemes in the Group do not qualify as defined benefit pension schemes.Plan assets consist of the following:2010 2009Equities 140,104 73,488Bonds 419,317 197,015Real estate 21,237 15,981Cash (non-interest-bearing) 3,628 44,777Other receivables and payables - 4,129 - 3,326580,157 327,935As per December 31, 2010 and December 31, 2009 the plan assets do not include shares which were issued byRoyal <strong>Boskalis</strong> Westminster N.V.The recognition of pension costs from defined benefit pension schemes in the consolidated financial statementsis presented in the statement below:2010 2009Total result defined benefit schemes 40,049 - 10,831Pension costs for defined benefit pension schemes charged to the consolidated income statement - 11,456 - 10,995Actuarial gains and losses and asset limitation recognized directly in equity 28,593 - 21,826Taxation - 5,123 3,270Actuarial gains and losses and asset limitation recognized directly in equity net of tax 23,470 - 18,556Actual return on plan assets 43,142 41,487The accumulated actuarial gains and losses and the balance of the limitation on net plan assets amount to:2010 2009Accumulated actuarial gains and losses as per December 31 - 52,564 - 35,109Asset limitation on net plan assets as per December 31 - 11,291 - 153- 63,855 - 35,262Royal <strong>Boskalis</strong> Westminster nv103
Financial statements 2010The Group expects € 24.4 million in contributions to be paid to the funded defined benefit pension schemes and€ 0.9 million in benefits to be paid for the unfunded schemes in 2010.The expected return on plan assets is the weighted average of actuarially proven expected returns on fixedinterest securities and shares based, in part, on external sources. The principal actuarial assumptions used forthe calculations are:2010 2009Discount rate 4.70% - 6.75% 5.12% - 5.70%Expected return on plan assets past year 4.70% - 5.70% 5.25% - 5.70%Expected future salary increases (excluding individual merit) 0.50% - 2.00% 1.00% - 2.00%Expected future inflation 1.00% - 3.40% 2.00% - 2.75%Expected future pension increases active participants 0.20% - 3.50% 1.50% - 2.00%Expected future pension increases inactive participants 0.20% - 3.50% 1.50% - 2.75%Historical information:2010 2009 2008 2007 2006Defined benefit obligation - 586,570 - 327,872 - 301,853 - 314,186 - 317,821Fair value of plan assets 580,157 327,935 287,007 345,014 351,183Surplus / deficit (-) - 6,413 63 - 14,846 30,828 33,362Unfunded pension liabilities - 9,157 - 8,288 - 7,598 - 6,931 - 6,979Total surplus / deficit (-) - 15,570 - 8,225 - 22,444 23,897 26,383Experience adjustments arising on plan liabilities - 16,512 - 1,264 7,929 - 25,747 - 25,235Experience adjustments arising on plan assets 18,770 27,081 - 56,011 - 10,165 - 908Experience adjustments are defined as all gains / losses (-) due to changes other than changes in thediscount rate.24. ProvisionsOnerouscontractClaimsGuaranteeobligationsSoildecontamination Other TotalBalance as at January 1 — — 3,824 4,063 261 8,148New in consolidation 28,490 9,606 — — 7,327 45,423Provisions made during the year 14,109 711 3,268 23 1,886 19,997Provisions used during the year - 10,646 - 8 - 1,712 — - 1,382 - 13,748Provisions reversed during the year - 1,900 — — — - 604 - 2,504Exchange rate differences 328 — 265 — - 389 204Discount to present value — — - 27 — — - 27Balance as at December 31 30,381 10,309 5,618 4,086 7,099 57,493Non-current 20,205 10,309 2,911 4,086 5,475 42,986Current 10,176 — 2,707 — 1,624 14,507Balance as at December 31 30,381 10,309 5,618 4,086 7,099 57,493104 <strong>Annual</strong> Report 2010
Financial statements 2010The provisions relate mainly to warranty liabilities, expected costs for cleaning up soil contamination and in theyear and in previous years received claims for completed projects. The Group disputes these claims and hasmade an assessment of the projected costs resulting from these claims. The results of the claims are uncertainand may differ from the above listed provisions. in the context of the business combination in 2010 provisionsare made by measuring at fair value projects which classified as onerous. Also, a provison was made for anonerous contract regarding a leased vessel.25. Trade and other payables2010 2009Trade payables 214,182 188,168Taxes and social security payables 69,418 46,750Amounts due to associated companies 343 2,372Other creditors and accruals 738,170 490,3781,022,113 727,668Trade and other payables are generally not interest-bearing.26. Financial instrumentsGeneralPursuant to a financial policy maintained by the Board of Management, Royal <strong>Boskalis</strong> Westminster N.V. and itsGroup companies use several financial instruments in the ordinary course of business. The policy with respectto financial instruments is disclosed in more detail in the <strong>Annual</strong> Report in the “Corporate Governance” chapter.The Group’s financial instruments are cash and cash equivalents, trade and other receivables, bank loans andoverdrafts, trade and other payables and derivatives. The Group enters into derivative transactions, mainly foreigncurrency forward contracts and to a limited extent interest rate swaps, to hedge against the related risks as theGroup’s policy is not to trade in derivatives.26.1 Financial risk managementThe Group has exposure to the following risks from its use of financial instruments:• Credit risk• Liquidity risk• Market risk:• Currency risk• Interest rate risk• Price risk26.1.1 Credit riskRoyal <strong>Boskalis</strong> Westminster N.V. has a strict acceptance and hedging policy for credit risks, resulting frompayment and political risks. In principle, credit risks are covered by means of bank guarantees, insurance,advance payments, et cetera, except in the case of creditworthy, first class debtors. These procedures andthe geographical diversification of the operations of the Group companies reduce the risk with regard tocredit concentration.Exposure to credit riskCredit risk is the risk of financial loss to the Group if a customer or counterparty to a financial instrument failsto meet its contractual obligations, and arises principally from the Group’s trade and other receivables. A largepart of the Group’s projects in progress within the operational segments Dredging & Earthmoving and MaritimeInfrastructure is directly or indirectly with state controlled authorities in various countries and geographical areas.Activities relating to harbor towage activities are often performed for major ship owing companies and harboragents. Receivables relating to transport, terminal services and heavy lift activities are generally outstandingwith oil and gas producers, therefore a significant portion of the receivables relates to clients from theseindustries. Salvage receivables are mainly outstanding with shipping companies and their Protection & IndemnityAssociations, or “P&I Clubs”. In general there is healthy diversification of receivables with different customers inRoyal <strong>Boskalis</strong> Westminster nv105
Financial statements 2010several countries in which the Group is performing its activities. Ongoing credit evaluation is performed on thefinancial condition of accounts receivable. The credit history of the Group over the recent years indicates that baddebts incurred are insignificant compared to the level of activities. Therefore, management is of the opinion thatcredit risk is adequately controlled through the currently applicable procedures.The maximum credit risk as per balance sheet date, without taking into account the aforementioned financial riskcoverage instruments and policy, consists of the book values of the financial assets as stated below:Book value2010 2009Other financial fixed assets 40,373 6,019Trade receivables 550,080 427,505Amounts due from associated companies 9,672 2,623Other receivables and prepayments 233,587 171,508Derivatives (receivable) 5,036 3,633Income tax receivable 23,060 8,899Cash and cash equivalents 357,744 594,8361,219,552 1,215,023The maximum credit risk on trade debtors at <strong>report</strong>ing date by operational segment was as follows:2010 2009Dredging & Earthmoving 398,082 340,858Harbour Towage 26,926 —Salvage, Transport & Heavy Lift 65,340 —Terminal Services 41,781 22,335Maritime Infrastructure 21,613 64,312Holding - 3,662 —550,080 427,505The aging of trade debtors as at December 31 was as follows:2010 2009Gross Impairment Gross ImpairmentNot past due 323,935 — 260,191 —Past due 0-90 days 148,690 2,806 51,786 484Past due 90-180 days 23,577 4,504 39,829 104Past due 180-360 days 13,382 2,416 67,573 260More than 360 days 60,884 10,662 12,561 3,587570,468 20,388 431,940 4,435Impairment - 20,388 - 4,435Trade receivables at book value 550,080 427,505With respect to the receivables that are neither impaired nor past due, there are no indications as of the <strong>report</strong>ingdate that these will not be settled.The movement in the allowance for impairment in respect of trade debtors during the year was as follows:106 <strong>Annual</strong> Report 2010
Financial statements 20102010 2009Balance at January 1 4,435 7,094MovementsNew in consolidation 15,555 —Provisions made during the year 3,738 1,984Provisions used during the year - 4,058 - 1,759Provisions released during the year - 88 - 2,591Exchange rate differences 806 - 29315,953 - 2,659Balance at December 31 20,388 4,435Concentration of credit risk.As at <strong>report</strong>ing date there is no concentration of credit risk with certain customers.26.1.2 Liquidity riskLiquidity risk is the risk that the Group will not be able to meet its financial obligations as they fall due.The Group’s approach to managing liquidity is to ensure that it will have sufficient liquidity to meet its liabilitieswhen due, under both normal and stressed conditions. Liquidity projections including available credit facilitiesare incorporated in the regular management information reviewed by the Board of Management. The focus of theliquidity review is on the net financing capacity, being free cash plus available credit facilities in relation to thefinancial liabilities. Furthermore, based on the Group’s financial ratios it can be concluded that the Group hassignificant debt capacity available under an (implied) investment grade credit profile.The following are the contractual maturities of financial liabilities, including estimated interest payments andexcluding the impact of netting agreements:Book valueContractualcash flowsOne yearor less 1 - 2 years 2 - 3 years 3 - 4 years 4 - 5 yearsMore than5 yearsAs at December 31, 2010Mortgage loans - 216,624 - 265,515 - 46,030 - 55,107 - 36,278 - 39,444 - 22,102 - 66,554Other bank loans - 591,145 - 738,900 - 89,211 - 19,667 - 190,548 - 14,193 - 14,162 - 411,119Bank overdrafts - 1,475 - 1,564 - 1,564 — — — — —Trade and other payables - 1,022,113 - 1,022,113 - 1,022,113 — — — — —Current tax payable - 163,107 - 163,107 - 163,107 — — — — —Derivatives - 44,707 - 44,707 - 23,213 - 1,168 - 216 121 28 - 20,259- 2,039,171 - 2,235,906 - 1,345,238 - 75,942 - 227,042 - 53,516 - 36,236 - 497,932Book valueContractualcash flowsOne yearor less 1 - 2 years 2 - 3 years 3 - 4 years 4 - 5 yearsMore than5 yearsAs at December 31, 2009Mortgage loans - 5,801 - 6,513 - 1,505 - 1,323 - 1,276 - 1,229 - 1,180 —Other bank loans - 74,282 - 85,221 - 25,174 - 15,878 - 15,505 - 10,927 - 14,261 - 3,476Bank overdrafts - 1,347 - 1,630 - 1,630 — — — — —Trade and other payables - 727,668 - 727,668 - 727,668 — — — — —Current tax payable - 105,324 - 105,324 - 105,324 — — — — —Derivatives - 25,874 - 25,874 - 18,915 - 6,134 - 825 — — —- 940,296 - 952,230 - 880,216 - 23,335 - 17,606 - 12,156 - 15,441 - 3,476Royal <strong>Boskalis</strong> Westminster nv107
Financial statements 201026.1.3 Market riskMarket risk concerns the risk that group income or the value of investments in financial instruments is adverselyaffected by changes in market prices, such as exchange rates and interest rates. The objective of managingmarket risks is to keep the market risk position within acceptable boundaries while achieving the bestpossible return.Currency riskA significant proportion of the projects is denominated in foreign currencies. That means that <strong>report</strong>ed financialresults and cash flows are exposed to risks ensuing from changes in exchange rates. The Board of Managementhas established a detailed currency risk management policy stipulating as main principle that currency risk,arising from transactions, must be hedged as soon as they occur, usually with forward contracts. Financialderivatives are used exclusively insofar as there are underlying real transactions, mainly future cash flows fromcontracted projects. Hedge accounting is applied to the majority of these cash flow hedges.Exposure to currency riskThe Group’s currency risk management policy was carried out during 2010 and resulted in a non-materialsensitivity of the Group to currency transaction risk.The following significant exchange rates applied during the year under review:Average rateReporting date spot rateEuro 2010 2009 2010 2009US dollar 1.334 1.391 1.342 1.435Arab Emirates Dirham 4.901 5.109 4.928 5.270Singapore dollar 1.814 2.022 1.720 2.010South African Rand 9.716 11.827 8.880 10.570Australian dollar 1.450 1.800 1.310 1.650Currency translation riskThe currency translation risk as per year-end can be summarized as follows:Euro 2010 2009Expected cash flows in US Dollars 139,626 161,914Expected cash flows in Australian Dollars 39,061 30,625Expected cash flows in Singapore Dollars 55,573 36,836Expected cash flows in Arab Emirates Dirhams — 130,384Expected cash flows in other currencies 97,243 27,850Expected cash flows in foreign currencies 331,503 387,609Cash flow hedges 325,970 382,296Net position 5,533 5,313Because of the relative linkage between the exchange rates of the Arab Emirates Dirhams and the US Dollars,the cash flows in Arab Emirates Dirhams are mainly hedged by means of US Dollar cash flow hedges.108 <strong>Annual</strong> Report 2010
Financial statements 2010Currency translation riskThe currency translation risk arises mainly from the net asset position of subsidiaries, associated companiesand joint ventures, whose functional currency is different from the presentation currency of the Group. Theseinvestments are viewed from a long term perspective. Currency risk associated with investments in theseaffiliated companies are not hedged , under the assumption that currency fluctuations and interest and inflationdevelopments balance out in the long run. Items in the income statements of these subsidiaries are translated ataverage exchange rates. Currency translation differences are charged or credited directly to equity.At <strong>report</strong>ing date the net asset positions of the main subsidiaries, associated companies and joint ventures inmain functional currencies other than the Euro were as follows:Euro 2010 2009US dollar 215,395 164,525Singapore dollar 243,250 —South African rand 39,644 —Total net equity 498,289 164,525Sensitivity analysisFor the year 2010, profit before taxation, excluding the effect of non-effective cash flow hedges, would have been€ 2.6 million higher (2009: € 1.8 million higher) if the corresponding functional currency had strengthened by 5%against the Euro with all other variables, in particular interest rates, held constant. The total effect on the currencytranslation reserve amounts to about € 25 million ( 2009: about € 8 million).A 5% weakening of the corresponding functional currency against the Euro at December 31 would have had theequal but opposite effect assuming that all other variables remain constant.Interest rate riskThe Group has both fixed and variable interest rate liabilities. In respect of controlling interest rate risks, thepolicy is that, in principle, interest rates for loans payable are primarily fixed for the entire maturity period. This isachieved by contracting loans that carry a fixed interest rate or by using derivatives such as interest rate swaps.The effective interest rates and the maturity term profiles of bank loans, deposits and cash and cash equivalents arestated below:Effectiveinterest rateOne yearor less 1 - 2 years 2 - 3 years 3 - 4 years 4 - 5 years Over 5 years TotalAs at December 31, 2010Cash and cash equivalents 0.41% 200,018 — — — — — 200,018Short-term deposits 0.60% 157,726 — — — — — 157,726Mortgage loans (euro) 4.47% - 8,167 - 7,649 - 7,648 - 7,648 - 6,514 - 18,522 - 56,148Mortgage loans (US$) 4.80% - 25,480 - 36,615 - 20,028 - 24,638 - 10,096 - 25,216 - 142,073Mortgage loans (other) 8.30% - 1,526 - 1,700 - 1,700 - 1,700 - 1,700 - 10,077 - 18,403Other bank loans (euro) 3.72% - 66,071 - 236 - 170,236 - 236 - 236 - 333,969 - 570,984Other bank loans (US$) 1.87% - 1,522 - 299 - 1,195 - 1,195 - 1,195 - 14,755 - 20,161Bank overdrafts (other) 6.00% - 1,475 — — — — — - 1,475253,503 - 46,499 - 200,807 - 35,417 - 19,741 - 402,539 - 451,500Royal <strong>Boskalis</strong> Westminster nv109
Financial statements 2010Effectiveinterest rateOne yearor less 1 - 2 years 2 - 3 years 3 - 4 years 4 - 5 years Over 5 years TotalAs at December 31, 2009Cash and cash equivalents 0.15% 199,254 — — — — — 199,254Short-term deposits 0.68% 395,582 — — — — — 395,582Mortgage loans (euro) 4.13% - 1,135 - 1,135 - 1,135 - 1,135 - 1,133 — - 5,673Mortgage loans (US$) 5.50% - 128 — — — — — - 128Other bank loans (euro) 5.24% - 7,324 - 8,364 - 8,364 - 8,364 - 12,195 — - 44,611Other bank loans (US$) 4.90% - 14,058 - 4,795 - 5,095 - 1,205 - 1,205 - 3,313 - 29,671Bank overdrafts (other) 21.00% - 1,347 — — — — — - 1,347570,844 - 14,294 - 14,594 - 10,704 - 14,533 - 3,313 513,406The US dollar loans are mainly used for financing property, plant and equipment in proportionally consolidatedstrategic alliances. The other bank loans expressed in US dollar have no fixed interest rates. The effectiveinterest rate of these loans does not differ materially from the actual market rates. The interest rate renewaldates of the loans are mainly due within three months after year-end 2010.Sensitivity analysisIn managing interest rate risks the Group aims to reduce the impact of short-term fluctuations on the Group’searnings. In the long term, however, permanent changes in interest rates will have an impact on profit.At the <strong>report</strong>ing date the interest rate profile of the Group’s interest-bearing financial instruments, taking intoaccount the corresponding effective hedge instruments, was:2010 2009Fixed rate instrumentsFinancial assets 88,343 186,917Financial liabilities - 661,778 - 58,283- 573,435 128,634Variable rate instrumentsFinancial assets 269,401 407,919Financial liabilities - 147,466 - 23,147121,935 384,772A drop of 100 basis points in interest rates at December 31, 2010 would have decreased the Group’s profitbefore income tax by approximately € 1.2 million (2009: € 3.8 million), with all other variables, in particularcurrency exchange rates, held constant.Price risksRisks related to price developments on the purchasing side, such as amongst others increased wages, costs ofmaterials, sub-contracting costs and fuel, which are usually for the Group’s account, are also taken into accountwhen preparing cost price calculations and tenders. Wherever possible, especially on projects that extend over along period of time, price index clauses are included in contracts.With regard to fuel price risk, the Board of Management has established a fuel price risk management policystipulating approved fuel price risk management instruments. These include: delivery of fuel by the client, priceescalation clauses, fixed price supply contracts and financial derivatives (forward, future and swap contracts).110 <strong>Annual</strong> Report 2010
Financial statements 201026.2 On-balance financial instruments and fair valueFinancial instruments accounted for under assets and liabilities are financial fixed assets, cash and cashequivalents, receivables, and current and non-current liabilities. The estimated fair values of these financialinstruments are close to the book value. Derivatives are mainly future cash flows hedged by forward contractsto which hedge accounting is applied. Furthermore, strategic alliances currently hold a number of interest rateswaps. These are recognized under other derivatives.The fair value of the forward exchange contracts is based on their listed market price, as at the end of the year(unadjusted market prices in active markets for identical assets and liabilities). The fair value other financialinstruments is based on the actual interest rate as at balance sheet date, taking into account terms and maturity.The fair value of non-interest bearing financial instruments with a maturity of twelve months or less is suppostedto be equal to their book value.Movements in the fair value of non-effective cash flow hedges are recognized directly or, under specificconditions, deferred in the consolidated income statement. Movements in the fair value of effective cash flowhedges are recognized directly in the hedging reserve in group equity, taking taxation into account. The fair valueof derivatives is derived from the forward rates at settlement date as at year-end. The fair value of other financialinstruments is based on current interest rates, taking maturity and conditions into account. The fair value of noninterest-bearingfinancial instruments due within one year is equal to the book value.2010 2009Book value Fair value Book value Fair valueOther financial fixed assets 40,373 40,373 6,019 6,019Trade and other receivables 793,339 793,339 601,636 601,636Derivatives (receivable) 5,036 5,036 3,633 3,633Income tax receivable 23,060 23,060 8,899 8,899Cash and cash equivalents 357,744 357,744 594,836 594,836Interest-bearing loans and borrowings (non-current) - 705,003 - 711,670 - 57,438 - 57,438Interest-bearing loans and borrowings (current) - 104,241 - 105,224 - 23,992 - 23,992Trade and other payables - 1,022,113 - 1,022,113 - 727,668 - 727,668Income tax payable - 163,107 - 163,107 - 105,324 - 105,324Derivatives (payable) - 44,707 - 44,707 - 25,874 - 25,874- 819,619 - 827,269 274,727 274,727Fair value hierarchyFor the fair value measurement of the recognized financial instruments a fair value hierarchy is defined inaccordance with IFRS 7:• Level 1: quoted prices (unadjusted) in active markets for identical assets or liabilities.• Level 2: inputs other than quoted prices included within Level 1 that are observable for the asset or liability,either directly (i.e. as prices) or indirectly (i.e. derived from prices).• Level 3: inputs for the asset or liability that are not based on observable market data (unobservable inputs).The fair value of the derivatives, which is the only category of financial instruments that qualify for this approach,is measured using level 2 input (2009: level 2).The composition of outstanding derivatives at year-end is presented below. The remaining time to maturity ofthese derivatives has a direct relation to the remaining time to maturity of the relating underlying contracts inthe order book.Royal <strong>Boskalis</strong> Westminster nv111
Financial statements 20102010 2009US$ forward selling (in US$) 253,487 501,972US$ forward buying (in US$) 45,586 56,850Forward selling of other currencies (average contract rates in euro) 250,263 220,639Forward buying of other currencies (average contract rates in euro) 97,647 121,286Fuel hedges (in US$) - 2,690 - 12,868Other derivatives (in US$) - 76 7,654Interest Rate Swaps (in US$) - 5,991 —Interest Rate Swaps (in EUR) - 17,354 —The periods for which the cash flows are expected to occur are stated below. Cash flows from forwardcurrency buyings and sellings can be rolled forward at settlement date when they differ from the underlyingcash flows.2010Withinone yearAfterone yearTotaalUS$ forward selling (in US$) 223,418 30,069 253,487US$ forward buying (in US$) 43,136 2,450 45,586Forward selling of other currencies (average contract rates in euro) 217,278 32,985 250,263Forward buying of other currencies (average contract rates in euro) 87,232 10,415 97,647Fuel hedges (in US$) - 2,690 — - 2,690Other derivatives (in US$) - 58 - 18 - 76Interest Rate Swaps (in US$) - 1,441 - 4,550 - 5,991Interest Rate Swaps (in EUR) - 334 - 17,020 - 17,3542009Withinone yearAfterone yearTotalUS$ forward selling (in US$) 379,316 122,656 501,972US$ forward buying (in US$) 40,814 16,036 56,850Forward selling of other currencies (average contract rates in euro) 150,696 69,943 220,639Forward buying of other currencies (average contract rates in euro) 54,218 67,068 121,286Fuel hedges (in US$) - 10,488 - 2,380 - 12,868Other derivatives (in US$) 2,626 5,028 7,654112 <strong>Annual</strong> Report 2010
Financial statements 2010The results on effective cash flow hedges are recognized in group equity as stated below:2010 2009Opening balance Hedging reserve as at January 1 8,262 5,735Movement in fair value of effective cash flow hedges recognized in group equity - 4,380 5,398Transferred to the income statement - 7,174 - 3,925Total directly recognized in group equity - 11,554 1,473Taxation 938 1,054Directly charged to the Hedging reserve (net of taxes) - 10,616 2,527Balance Hedging reserve as at December 31 - 2,354 8,262The results on non-effective cash flow hedges are presented within the operational costs and amount to € 6.2million negative over 2010 (2009: € 14.5 million positive).26.3 Capital managementThe Board of Management’s policy is to maintain a strong capital base so as to maintain customer, investor,creditor and market confidence and to support future development of the business. The Board of Managementmonitors the return on equity, which the Group defines as net operating income divided by total shareholders’equity, excluding minority interests. The Board of Management also monitors the level of dividend to be paid toholders of ordinary shares. The dividend policy is to maintain a pay-out ratio of 40% to 50%.The Board of Management seeks to maintain a balance between the higher returns that might be possible withhigher levels of borrowings and the benefits of a sound capital position. The Group’s target is to achieve along-term return on equity of at least 12%; in 2010 the return was 21.7% (2009: 21.1%).Royal <strong>Boskalis</strong> Westminster N.V. does not have a defined share buy-back plan.There were no changes in the Group’s approach to capital management during the year.Neither Royal <strong>Boskalis</strong> Westminster N.V. nor any of its Group companies are subject to externally imposedcapital requirements.26.4 Other financial instrumentsPursuant to the decision of the General Meeting of Shareholders held on May 9, 2001, the StichtingContinuïteit KBW has acquired the right to take cumulative protective preference shares in Royal <strong>Boskalis</strong>Westminster N.V. for a nominal amount which shall be equal to the nominal amount of ordinary sharesoutstanding at the time of the issue. This right qualifies as a derivative financial liability, with the followingimportant conditions. The cumulative protective preference shares are to be issued at par against a 25% cashcontribution, the remainder after call-up by the Stichting in consultation with Royal <strong>Boskalis</strong> Westminster N.V.After the issue, Royal <strong>Boskalis</strong> Westminster N.V. has the obligation to buy or cancel the shares upon theStichting’s request. The preferential dividend right amounts to Euribor increased by 4% at most. The interestand credit risk is limited. The fair value of the option right is nil.Royal <strong>Boskalis</strong> Westminster nv113
Financial statements 201027. Commitments and contingent liabilitiesOperational lease obligationsThe operational lease obligations relate primarily to the operational lease of a trailing suction hopper dredger,cars and offices. Additional clauses are not taken into account presuming that these are not unconditional.Non-redeemable operating lease contracts are recognized at nominal amounts and are due as follows:2010 2009Within one year 22,563 8,325Between one and five years 33,663 9,497After more than five years 7,068 50263,294 18,324GuaranteesThe guarantee commitments as at December 31, 2010 amount to € 812 million (2009: € 818 million) and can bespecified as follows:2010 2009Guarantees provided by third parties with respect to:• associated companies 8,000 8,000• contracts and joint ventures 804,000 810,000• lease obligations and other financial obligations — —812,000 818,000For the above guarantees outstanding as at December 31, 2010, counter-guarantees have been provided tofinancial institutions for approximately € 804 million (2009: approximately € 810 million). Twenty key Groupcompanies are jointly and severally liable in respect of credit facilities and guarantees provided to several Groupcompanies. In respect of these credit facilities, it has been agreed to limit the provision of further securities onexisting property, plant and equipment.Group companies are jointly and severally liable for the non-consolidated part of the liabilities of their jointventures: in total € 189 million (2009: € 132 million). Group companies are also jointly and severally liable forperformance obligations for contracts with third parties in project-driven construction consortiums. In addition,certain recourse obligations exist in respect of project financiers and guarantees of deployment relating toequipment. Where deemed necessary, provisions have been made.Capital commitmentsAt year-end 2010, capital commitments amount to € 93 million (year-end 2009: € 182 million).OtherSome legal proceedings and investigations have been instituted against entities of Royal <strong>Boskalis</strong> Westminster N.V.Where deemed necessary and if a reliable estimate of the future cash flows can be made, provisions havebeen made.114 <strong>Annual</strong> Report 2010
Financial statements 201028. Subsequent eventsBusiness Combination RebrasOn March 3, 2011, the Group acquired control over Rebras Rebocadores do Brasil SA by the acquisition of theremaining 50% of the outstanding shares. As a result, participation increased from 50% to 100%.Rebras Rebocadores do Brasil SA Brazil is a maritime services provider in the operational segment HarbourTowage. The main customer groups are in the sectors of shipping companies, shipping agents and the oil andgas industry.Gaining control over Rebras Rebocadores do Brasil SA allows the Group to offer the full service concept in Braziland to support other group companies in carrying out assignments in Brazil. The consideration paid is USD 38million in cash. There are no material costs associated with this transaction.Due to the short time lag between acquisition date and <strong>report</strong>ing date the fair value of identifiable assets (whichinclude receivables) and liabilities acquired has not yet been determined.This, together with the determination of goodwill, will take place before the next <strong>report</strong>ing date (interimresults 2011).Proposed profit appropriation 2010An amount of € 185.3 million will be added to the retained earnings. The proposal to the <strong>Annual</strong> General Meetingwill be to appropriate the remainder, € 125.2 million, for a dividend payment of € 1.24 per share.The dividend will be made payable in ordinary shares to be charged to the tax-exempt share premium or to becharged to the retained earnings, unless a shareholder expressly requests payment in cash.29. Related parties29.1 Identity of related partiesThe identified related parties to the Group are its Group companies, its joint ventures, its associated companies(see note 15), its shareholders with significant influence, its pension funds that are classified as funded definedbenefit pension schemes in accordance with IAS 19 and the members of the Supervisory Board and Boardof Management.Group companiesThe following are the most relevant active Group companies.Royal <strong>Boskalis</strong> Westminster nv115
Financial statements 2010Ownership interestCompany City of incorporation Country of incorporation 2010 2009Aannemingsmaatschappij Markus B.V. Halfweg The Netherlands 100% 100%Baggermaatschappij <strong>Boskalis</strong> B.V. Papendrecht The Netherlands 100% 100%Baggermaatschappij Holland B.V. Papendrecht The Netherlands 100% 100%<strong>Boskalis</strong> B.V. Rotterdam The Netherlands 100% 100%<strong>Boskalis</strong> Cofra Holding B.V. Amsterdam The Netherlands 100% 100%Cofra B.V. Amsterdam The Netherlands 100% 100%<strong>Boskalis</strong> Dolman B.V. Dordrecht The Netherlands 100% 100%<strong>Boskalis</strong> Markus B.V. Papendrecht The Netherlands 100% 100%<strong>Boskalis</strong> Westminster Dredging B.V. Papendrecht The Netherlands 100% 100%<strong>Boskalis</strong> Holding B.V. Papendrecht The Netherlands 100% 100%<strong>Boskalis</strong> Westminster International B.V. Papendrecht The Netherlands 100% 100%<strong>Boskalis</strong> International B.V. Papendrecht The Netherlands 100% 100%<strong>Boskalis</strong> Offshore B.V. Papendrecht The Netherlands 100% 100%<strong>Boskalis</strong> Finance B.V. Papendrecht The Netherlands 100% 100%<strong>Boskalis</strong> Westminster Shipping B.V. Papendrecht The Netherlands 100% 100%<strong>Boskalis</strong> Maritime Investments B.V. Papendrecht The Netherlands 100% 100%BW Soco B.V. Sliedrecht The Netherlands 100% 100%Hydronamic B.V. Sliedrecht The Netherlands 100% 100%A.H. Breijs & Zonen B.V. Rotterdam The Netherlands 100% 100%J. van Vliet B.V. Wormerveer The Netherlands 100% 100%SMIT Harbour Towage Rotterdam B.V. Rotterdam The Netherlands 100% —SMIT Heavy Lift Europe B.V. Rotterdam The Netherlands 100% —Smit Internationale Beheer B.V. Rotterdam The Netherlands 100% —Smit Internationale N.V. Rotterdam The Netherlands 100% —SMIT Marine Projects B.V. Rotterdam The Netherlands 100% —Smit Nederland B.V. Rotterdam The Netherlands 100% —SMIT Salvage B.V. Rotterdam The Netherlands 100% —SMIT Subsea Europe B.V. Rotterdam The Netherlands 100% —Smit Terminals Division B.V. Rotterdam The Netherlands 100% —SMIT Terminals Europe B.V. Rotterdam The Netherlands 100% —Smit Transport & Heavy Lift Division B.V. Rotterdam The Netherlands 100% —SMIT Transport Europe B.V. Rotterdam The Netherlands 100% —Smit Vessel Management Services B.V. Rotterdam The Netherlands 100% —URS Nederland B.V. Terneuzen The Netherlands 100% —Smit Harbour Towage Belgium N.V. Antwerpen Belgium 100% —SMIT Transport Belgium N.V. Antwerpen Belgium 100% —Towage Holdings N.V. Antwerpen Belgium 100% —Unie van Redding- en Sleepdienst België N.V. Antwerpen Belgium 100% —Unie van Redding- en Sleepdienst N.V. Antwerpen Belgium 100% —URS Salvage & Maritime Contracting N.V. Antwerpen Belgium 100% —Heinrich Hirdes GmbH Hamburg Germany 100% 100%Heinrich Hirdes Kampfmittelräumung GmbH Duisburg Germany 100% 100%Westminster Dredging Company Ltd Fareham United Kingdom 100% 100%<strong>Boskalis</strong> Westminster Ltd Fareham United Kingdom 100% 100%Westminster Gravels Ltd Fareham United Kingdom 100% 100%<strong>Boskalis</strong> Zinkcon Ltd Fareham United Kingdom 100% 100%Llanelli Sand Dredging Ltd Llanelli United Kingdom 100% 100%Rock Fall Company Ltd Ayrshire United Kingdom 100% 100%Smit Salvage Ltd. Isle of Man United Kingdom 100% —Smit Terminals Europe Ltd. Isle of Man United Kingdom 100% —Smit Harbour Towage (U.K.) Ltd. London United Kingdom 100% —Smit Octo-Luktrans Limited Isle of Man United Kingdom 100% —116 <strong>Annual</strong> Report 2010
Financial statements 2010Ownership interestCompany City of incorporation Country of incorporation 2010 2009Smit Subsea Africa Ltd. Isle of Man United Kingdom 100% —Atlantique Dragage SARL Nanterre France 100% 100%Sociedad Española de Dragados SA Madrid Spain 100% 100%Dragapor Dragagens de Portugal SA Alcochete Portugal 100% 100%Terramare Oy Helsinki Finland 100% 100%<strong>Boskalis</strong> Offshore A/S Randaberg Norway 100% 100%<strong>Boskalis</strong> Sweden AB Gothenburg Sweden 100% 100%UAB <strong>Boskalis</strong> Baltic Klaipeda Lithuania 100% 100%UAB Smit Octo Klaipeda Lithuania 100% —SMIT Terminals Sakhalin LLC Yuzhno-Sakhalinsk Russia 100% —<strong>Boskalis</strong> Westminster Dredging Ltd Nicosia Cyprus 100% 100%BW Marine (Cyprus) Ltd Nicosia Cyprus 100% 100%<strong>Boskalis</strong> Westminster Middle East Ltd Nicosia Cyprus 100% 100%<strong>Boskalis</strong> Westminster Dredging and Contracting Ltd Nicosia Cyprus 100% 100%Smit-Lloyd (Antillen) N.V. Limited Bahamas Bahamas 100% —Smit International (Argentina) S.A. Buenos Aires Argentina 100% —<strong>Boskalis</strong> do Brasil Dragagem e Serviços Maritímos Ltda Rio de Janeiro Brazil 100% 100%Smit Marine Canada Inc. Whitehorse Canada 100% —Smit Terminals Sonagas S.A. Malabo Equatorial Guinea 64% —Dragamex SA de CV Coatzacoalcos Mexico 100% 100%Codramex SA de CV Coatzacoalcos Mexico 100% 100%Coastal and Inland Marine Services Inc. Ancon Panama 100% 100%Smit Harbour Towage (Panama), Inc. Panama City Panama 100% —<strong>Boskalis</strong> Westminster St. Lucia Ltd Castries St. Lucia 100% 100%Riovia SA Montevideo Uruguay 100% 100%Smit Salvage Americas Inc. Wilmington United States of America 100% —Stuyvesant Dredging Co. Metairie United States of America 100% 100%<strong>Boskalis</strong> Westminster Inc. Wilmington United States of America 100% 100%Smit Amandla Marine (Pty) Ltd. Cape Town South Africa 70% —Smit Marine South Africa (Pty) Ltd. Cape Town South Africa 100% —Smit Internationale (Gabon) S.A. Port Gentil Gabon 100% —Nigerian Westminster Dredging and Marine Ltd Lagos Nigeria 60% 60%Smit Nigeria Ltd. Lagos Nigeria 40% —Smit Terminals Nigeria LTD Lagos Nigeria 40% —<strong>Boskalis</strong> Australia Pty Ltd Chatswood Australia 100% 100%Smit Marine Australia Pty Ltd Sydney Australia 100% —Taizhou Smit Towage Company Ltd. Taizhou China 60% —Smit Usturt Maritime Services LLP Aktau Kazakhstan 50% —<strong>Boskalis</strong> International (S.) Pte Ltd Singapore Singapore 100% 100%Zinkcon Marine Singapore Pte Ltd Singapore Singapore 100% 100%Koon Zinkcon Pte Ltd Singapore Singapore 50% 50%Smit Land & Marine Engineering (Far East) Pte. Ltd. Singapore Singapore 100% —Smit Offshore Maintenance (S) Pte. Ltd. Singapore Singapore 100% —Smit Shipping Singapore Pte. Ltd. Singapore Singapore 100% —Smit Singapore Pte. Ltd. Singapore Singapore 100% —Smit Tak Heavy Lift (S) Pte. Ltd. Singapore Singapore 100% —<strong>Boskalis</strong> Taiwan Ltd Taipei Taiwan 100% 100%Smit Kueen Yang Harbour Services Company Ltd. Taipei Taiwan 80% —<strong>Boskalis</strong> Westminster (Oman) LLC Seeb Oman 49% 49%<strong>Boskalis</strong> Westminster Al Rushaid Co Ltd Dhahran Saudi-Arabia 49% 49%SMIT Subsea Middle East L.L.C. Dubai United Arab Emirates 49% —Royal <strong>Boskalis</strong> Westminster nv117
Financial statements 2010Joint venturesThe following are the most relevant active joint ventures.Strategic alliances:Ownership interestEntity Country of incorporation 2010 2009Archirodon Group N.V. The Netherlands 40% 40%Lamnalco Ltd Sharjah, United Arab Emirates 50% 50%Deeprock CV The Netherlands 50% 50%Rebras Rebocadores do Brasil Brazil 50% —Keppel Smit Towage Pte. Ltd. Singapore 49% —Maju Maritime Pte. Ltd. Singapore 49% —Towmar Smit Baltic UAB Lithuania 50% —Adriatic Towage S.r.l. Italy 50% —High Latitude Shipping Inc. Panama 50% —Ocean Marine Egypt S.A.E Egypt 50% —Asian Lift Pte. Ltd. Singapore 50% —Octomar Servicos Maritimos Limitada (Ltda) Angola 50% —Donjon-SMIT LLC United States of America 50% —Project-driven construction consortiums:Joint venture interestEntity Country of incorporation 2010 2009<strong>Boskalis</strong> B.V. / M.N.O. Vervat B.V. The Netherlands 50% 50%Combinatie "Duizend Zestien" vof The Netherlands 50% 50%Combinatie <strong>Boskalis</strong> KWS N470-76 The Netherlands 50% 50%Combinatie Haarrijnse Plas The Netherlands 25% 25%Combinatie Onderhoud Waterweg The Netherlands 50% 50%Combinatie Bowegro vof The Netherlands 50% 50%Consortium N11 The Netherlands 17% 17%Bouwcombinatie Hollandse Meren The Netherlands 9% 9%Bouwcombinatie Brabant Noord The Netherlands 9% 9%Combinatie Achtkamp / Zevenhuizerplas The Netherlands 50% 50%Zandexploitatie Zevenhuizerplas vof The Netherlands 50% 50%Combinatie HSL 1 Grond & Wegen The Netherlands 20% 20%Combinatie HSL 5 Noord Grond & Wegen The Netherlands 15% 15%Combinatie Smink BKD vof The Netherlands 50% 50%Combinatie BVNN <strong>Boskalis</strong> Dolman vof The Netherlands 50% 50%Oosterhof Holman <strong>Boskalis</strong> The Netherlands 50% 50%Combinatie <strong>Boskalis</strong> KWS N470 The Netherlands 50% 50%KWS-<strong>Boskalis</strong> (Sloelijn) The Netherlands 50% 50%Sassenplaat The Netherlands 50% 50%Volker Wessels-<strong>Boskalis</strong> (Sloelijn koepel) The Netherlands 33% 33%N201 Aalsmeer - Uithoorn The Netherlands 15% 15%Projectorganisatie Uitbreiding Maasvlakte (PUMA) vof The Netherlands 50% 50%Combinatie Grond & Wegen N201 The Netherlands 50% 50%Combinatie KWS - Markus The Netherlands 50% 50%Bouwcombinatie Volgermeer The Netherlands 50% 50%Combinatie A2 HoMa The Netherlands 38% 38%Combinatie de Keent The Netherlands 50% 50%118 <strong>Annual</strong> Report 2010
Financial statements 2010Joint venture interestEntity Country of incorporation 2010 2009Stemat/<strong>Boskalis</strong> vof The Netherlands 50% 50%Ketelmeer Hanzerak West The Netherlands 50% 50%Sanering Hollandsche IJssel The Netherlands 50% 50%Combinatie KWS/<strong>Boskalis</strong> Westrandweg GWW The Netherlands 50% 50%Combinatie Westpoort vof The Netherlands 15% 15%Vinkeveen-Haarrijn The Netherlands 25% 25%Combinatie Opperduit The Netherlands 33% 33%Trajectum Novum Grond & Wegen The Netherlands 33% 33%Combinatie Trajectum Novum vof The Netherlands 13% 13%Combinatie Schuwagt The Netherlands 50% 50%JV Euryza, Infra/TBI Infra The Netherlands 50% 50%Markus - Transverko The Netherlands 50% 50%Combinatie Zeezand IJmuiden The Netherlands 50% 50%Combinatie Delflandse Kust The Netherlands 50% 50%Combinatie Kust van Voorne The Netherlands 50% 50%Combinatie Zeeuws Vlaanderen - Walcheren NZ2099 The Netherlands 50% 50%Combinatie Gate LNG Kanaal The Netherlands 50% 50%Combinatie Van Kessel - <strong>Boskalis</strong> Gouwe Park The Netherlands 50% 50%Combinatie KWS Infra - <strong>Boskalis</strong> N23 The Netherlands 30% 30%CV Projectbureau Grensmaas The Netherlands 17% 17%<strong>Boskalis</strong> Offshore AS - Tideway vof The Netherlands 50% 50%Dredging International Luxembourg - <strong>Boskalis</strong> International vof The Netherlands 50% 50%Joint Venture <strong>Boskalis</strong> - Jac. Rijk The Netherlands 50% 50%<strong>Boskalis</strong> Offshore/Rohde Nielsen vof The Netherlands 50% 50%Tideway - <strong>Boskalis</strong> Offshore L9 vof The Netherlands 50% 50%Lago Wirense CV The Netherlands 50% 50%<strong>Boskalis</strong> International - Dredging International CV The Netherlands 50% 50%BOFF-TID NL vof The Netherlands 50% —Vof BKO-TID The Netherlands 50% —Offshorebasis Cuxhaven LP8 Germany 50% 50%Weserunterhaltungsbaggerung Bremerhaven Germany 50% 50%Binnenhafenkaje Kiel Germany 50% 50%Swinoujscie Breakwater Poland 60% —Britannia Satellites United Kingdom 50% 50%UTE Dragado Gijon Spain 50% 50%OOO Mortekhnika Russia 50% 50%Jurong and Tuas Rock Contractors JV Singapore 75% 75%Penta-Ocean Koon Ham DI <strong>Boskalis</strong> JV (Jurong 3B) Singapore 22% 22%Penta-Ocean Koon DI <strong>Boskalis</strong> Ham JV (Jurong 4) Singapore 17% 17%New Doha International Airport JV Qatar 29% 29%Ras Laffan Port Expansion Qatar 50% 50%Ras Laffan Northern Breakwaters Contractors Qatar 50% 50%North Bahrain New Town Bahrain 50% 50%KOC Kuwait 50% 50%Khalifa Port Marine Consortium Abu Dhabi, United Arab Emirates 43% 43%Port Rashid Dubai, United Arab Emirates 50% 50%Dragages Tanger Mediterranee Morocco 50% 50%BKI Dredging International Services Cyprus JV Angola 50% —<strong>Boskalis</strong> Jan de Nul Lda Angola 50% 50%Boscampo Cameroon 50% 50%EPGA3A Nigeria 50% 50%Bahia Blanca Argentina 50% 50%Quequen Argentina 50% 50%Joint venture Sepetiba Brazil 50% 50%Royal <strong>Boskalis</strong> Westminster nv119
Financial statements 2010Associated companiesThe most relevant active associated companies are mentioned in note 15.Pension funds that are classified as funded defined pension schemes in accordance with IAS 19Information on pension funds that are classified as funded defined benefit pension plans in accordance withIAS 19 can be found in note 23.1. There were no further material transactions with these pension funds.Members of the Board of Management and members of the Supervisory BoardThe only key management officers qualifying as related parties are the members of the Board of Managementand the members of the Supervisory Board.29.2 Related party transactionsJoint venturesDuring the financial years 2010 and 2009, there were no material transactions with strategic alliances otherthan in joint control. Those material transactions were mainly in proportion to the percentage of participationin the activities in project-driven construction consortiums. Transactions with project-driven constructionconsortiums take place on a large scale because of the nature of the business activities. In respective jointventure agreements, equivalence between individual partners is achieved by means of, inter alia, agreed rates forpersonnel and equipment.The joint Group companies have, at year-end 2010, amounts receivable from and payable to project-drivenconstruction consortiums amounting to € 106 million and € 295 million respectively (2009: € 130 million and€ 302 million respectively).The proportional share of the Group in the assets, liabilities, revenue and expenses of joint ventures isstated below.2010 2009Non-current assets 437,534 188,959Current assets 482,329 578,811Total assets 919,863 767,770Non-current liabilities 163,527 66,105Current liabilities 414,758 535,471Total liabilities 578,285 601,576Net assets 341,578 166,194Contract revenue 988,641 821,407Expenses - 824,847 - 703,465Net profit 163,794 117,942Associated companiesTransactions with associated companies, other than those disclosed in note 15, are not material.120 <strong>Annual</strong> Report 2010
Financial statements 2010Transactions with members of the Board of Management and members of the Supervisory BoardThe emoluments for members of the Board of Management and Supervisory Board of the company over 2010and 2009 were as follows:<strong>Annual</strong>salaries andremunerationEmployer'spensioncontributionsShort- and longtermvariableremunerationpaid Total 2009Members of the Board of Managementdr. P.A.M. Berdowski 573 126 830 1,529 1,376T.L. Baartmans 415 87 501 1,003 736J.H. Kamps 415 87 529 1,031 945B. Vree (from April 1, 2010) 280 (1) 51 328 (2) 6591,683 351 2,188 4,222 3,057Members of the Supervisory BoardH.J. Hazewinkel (from March 27, 2010) 27 27H. Heemskerk 60 60 50M.P. Kramer (from August 19, 2009) 39 39 14M. Niggebrugge 44 44 44M. van der Vorm 37 37 37C. van Woudenberg 41 41 41248 248 186Total 2010 1,931 351 2,188 4,470Total 2009 1,556 293 1,394 3,243(1) In addition a severance payment of two annual salaries, i.e. € 829 thousand, is paid to Mr. B. Vree. Furthermore, under the settlement of employment, by April 1,2011, salary, pension contributions and variable remuneration of respectively € 95 thousand, € 17 thousand and € 109 thousand.(2) This amount is payable in 2011.The variable remuneration paid in 2010 is related to the achievement of certain targets during the 2009 financialyear (short-term variable remuneration) and the achievement of certain targets during the 2007-2009 period (longtermvariable remuneration). The variable renumeration for Mr. Vree regards the year 2010.No loans or guarantees have been provided to, or on behalf of, members of the Board of Management or membersof the Supervisory Board. The members of the Board of Management and the members of the Supervisory Boardreceive, in addition to their remuneration, a yearly allowance for out-of-pocket expenses of € 5,904, respectively€ 2,368 each.Long-term incentive planThe members of the Board of Management participate in a long-term (three years) incentive plan which consistsof two parts. The first part is directed at the creation of shareholder value and the other part is focused on therealization of the Company policy for the long term. The realization of shareholder value will be determinedbased on the development of the share price of the ordinary shares of the Company as listed at NYSE EuronextAmsterdam. The development of the share price is measured by the ratio between the average share price over thethree months prior to the commencement and at the end of the three-year performance period.Royal <strong>Boskalis</strong> Westminster nv121
Financial statements 2010For the realization of the Company policy for the long term, the Supervisory Board defines certain objectives forthe Board of Management, which will be judged on a qualitative basis. The Supervisory Board defines objectivesfor individual performances and payment of the long-term variable element is subject to these being met. Thelong-term objectives for the determination of the qualitative part of the long-term variable element will be directlyderived from the strategic agenda of the Company and will be in line with the corporate objectives as these will bedefined for the Company for that financial year.At the start of the performance period a basic bonus amount is established equal to the “at target” percentages(50% of the basic salary for the chairman of the Board of Management and 45% for the other executives). In caseof excellent performance of the Company policy these percentages may at maximum amount to 75%, respective67.5%. The final amount of the long-term variable element is determined by the extent to which the set objectiveshave been met in the past three years in combination with the achieved development of the share price.As at December 31, 2010 an accrual amounting to € 1.9 million (2009: € 1.6 million) with regard to abovementionedlong-term incentive plan is recognized under Other creditors and accruals for the periods 2008/2010,2009/2011 and 2010/2012.Multi-year summary of variable remunerationsWith regard to the years 2008 up till 2010 the following variable remunerations were granted to the members of theBoard of Management:Year of payment2011 2010 2009dr. P.A.M. Berdowski 750 830 693T.L. Baartmans 495 501 246J.H. Kamps 495 529 455Total 1,740 1,860 1,394122 <strong>Annual</strong> Report 2010
Financial statements 2010Company income statement(in € 1,000) Note 2010 2009Result of group companies [3] 310,517 224,296Other results, after taxation — 3,556Net profit 310,517 227,852Royal <strong>Boskalis</strong> Westminster nv123
Financial statements 2010Company balance sheet before profit appropriation(in € 1,000) Note 2010 2009AssetsNon-current assetsInvestments in group companies [3] 1,556,166 1,294,8261,556,166 1,294,826Current assetsIncome tax receivable 907 907Amounts due from group companies 7,954 1498,861 1,056Total assets 1,565,027 1,295,882Equity and liabilitiesShareholders' equityIssued capital [4] 80,779 78,921Share premium [4] 231,335 232,076Other legal reserve [5] 203,524 132,725Hedging reserve [5] - 2,354 8,262Revaluation reserve [5] 3,834 3,834Currency translation reserve [5] - 633 - 37,542Actuarial reserve [5] - 53,568 - 30,098Retained earnings [5] 791,536 679,737Profit for the year [6] 310,517 227,8521,564,970 1,295,767Current liabilitiesTrade and other payables 57 11557 115Total equity and liabilities 1,565,027 1,295,882124 <strong>Annual</strong> Report 2010
Financial statements 2010Statement of changes in shareholders’ equity(in € 1,000)NoteBalance asat January 1,2010Issue ofordinarysharesCashdividendStockdividendAdditionto retainedearningsMovementother legalreserveTotalrecognizedincome andexpenseBalance as atDecember 31,2010Issued capital [4] 78,921 — 1,858 80,779Share premium [4] 232,076 — - 741 231,335310,997 — 1,117 312,114Other legal reserve [5] 132,725 — 70,799 — 203,524Hedging reserve [5] 8,262 — — - 10,616 - 2,354Revaluation reserve [5] 3,834 — — — 3,834Currency translation reserve [5] - 37,542 — — 36,909 - 633Actuarial reserve [5] - 30,098 — — - 23,470 - 53,568Retained earnings [5] 679,737 182,598 - 70,799 — 791,536756,918 182,598 — 2,823 942,339Profit appropriation 2009 227,852 - 44,137 - 1,117 - 182,598 — —Net profit 2010 — — — — 310,517 310,517Profit for the year [6] 227,852 - 44,137 - 1,117 - 182,598 310,517 310,517Shareholders' equity 1,295,767 — - 44,137 — — — 313,340 1,564,970(in € 1,000)NoteBalance asat January 1,2009Issue ofordinarysharesCashdividendStockdividendAddition toretainedearningsMovementother legalreserveTotalrecognizedincome andexpenseBalance as atDecember 31,2009Issued capital [4] 68,639 7,216 3,066 78,921Share premium [4] 13,261 220,135 - 1,320 232,07681,900 227,351 1,746 310,997Other legal reserve [5] 107,351 — 25,374 — 132,725Hedging reserve [5] 5,735 — — 2,527 8,262Revaluation reserve [5] 3,834 — — — 3,834Currency translation reserve [5] - 32,877 — — - 4,665 - 37,542Actuarial reserve [5] - 48,654 — — 18,556 - 30,098Retained earnings [5] 493,724 211,387 - 25,374 — 679,737529,113 211,387 — 16,418 756,918Profit appropriation 2008 249,105 - 35,972 - 1,746 - 211,387 — —Net profit 2009 — — — — 227,852 227,852Profit for the year [6] 249,105 - 35,972 - 1,746 - 211,387 227,852 227,852Shareholders' equity 860,118 227,351 - 35,972 — — — 244,270 1,295,767Royal <strong>Boskalis</strong> Westminster nv125
Financial statements 2010Explanatory notes to the company financial statements1. GeneralThe Company Financial statements are part of the Financial statements 2010 of Royal <strong>Boskalis</strong> Westminster N.V.(the ‘Company’).2. Principles of financial <strong>report</strong>ing2.1 Accounting policiesThe company financial statements have been drawn up using the <strong>report</strong>ing standards applied for drawing up theconsolidated financial statements, in accordance with Section 362(8), Part 9 of Book 2 of the Netherlands CivilCode except for the investment in Group company, which is recognized in accordance with the equity method.Based on Section 362(1), Part 9 of Book 2 of the Netherlands Civil Code, the consolidated financial statementshave been prepared in accordance with the International Financial Reporting Standards (IFRS) as adopted by theEuropean Union. These accounting principles are disclosed in note 3 of the consolidated financial statements.2.2 FormatUnless stated otherwise, all amounts in these explanatory notes are stated in thousands of euros. The companybalance sheet is drawn up before profit appropriation. The company income statement is limited in accordancewith Section 402, Part 9 of Book 2 of the Netherlands Civil Code.2.3 Investment in Group companiesInvestments in Group companies are accounted for using the equity method, as described in the principles ofFinancial Reporting relating to associated companies in the consolidated Financial statements.2.4 Amounts due from Group companiesAmounts due from Group companies are stated initially at fair value and subsequently at amortized cost.Amortized cost is determined using the effective intereste rate.2.5 Amounts due to Group companiesAmounts due to Group companies are recognized initially at fair value and subsequently at amortized cost.Amount due to Group companies are discounted insofar as the difference between the discounted value andnominal value is material.2.6 Result of Group companiesThe result of Group companies consists of the share of the Company in the result after taxation of this Groupcompany. Results on transactions, where the transfer of assets between the Company and its Group companiesand mutually between Group companies themselves are not incorporated as far as they can be deemed tobe unrealised.126 <strong>Annual</strong> Report 2010
Financial statements 20103. Investments in Group companiesInvestments in Group companies consists solely of the 100% investment in <strong>Boskalis</strong> Westminster Dredging B.V.,Papendrecht. The movements in this investment are shown below:2010 2009Balance as at January 1 1,294,826 863,845Dividends received - 52,000 - 39,733Net investments — 230,000Profit for the year 310,517 224,296Movements directly recognized in equity of group company 2,823 16,418Balance as at December 31 1,556,166 1,294,826Reference is made to the notes 15 and 29.1 of the consolidated financial statements 2010 for an overview of themost important direct and indirect Group companies.4. Issued capital and share premiumThe authorized share capital of € 240 million is divided into 150,000,000 ordinary shares with a par value of€ 0.80 each and 50,000,000 cumulative protective preference shares with a par value of € 2.40 each.Issued capital increased by 2,322,974 ordinary shares in the course of 2010 as a result of the distribution ofstock dividend.The movement in issued share capital is as follows:(in number of shares) 2010 2009On issue and fully paid at January 1 98,651,289 85,799,361Optional dividend 2,322,974 3,832,322Issue of ordinary shares — 9,019,606On issue and fully paid at December 31 100,974,263 98,651,289The issued capital as at December 31, 2010 consists of 100,974,263 ordinary shares with a par value of € 0.80each and consequently amounts to € 80.8 million (2009: € 78.9 million).Of the issued capital as at December 31, 2010, six ordinary shares were owned by Royal <strong>Boskalis</strong> Westminster N.V.The as yet unexercised option right to take cumulative protective preference shares in Royal <strong>Boskalis</strong>Westminster N.V. has been assigned to the Stichting Continuïteit KBW.Share premium comprises additional paid-in capital exceeding the par value of outstanding shares. Sharepremium is distributable free of tax.Royal <strong>Boskalis</strong> Westminster nv127
Financial statements 20105. ReservesWith regard to the difference between the cost price and equity value of entities, either consolidatedproportionally as well as associated companies recognized in accordance with the equity method, a legallyrequired reserve is recognized because of a lack of control over the distribution of profits only to the extent thatthese differences are not included in the accumulated currency translation differences on foreign operations. Thelegal reserve for non-distributed profits of group and/or associated companies amounted to € 203.5 million at theend of 2010 (2009: € 132.8 million). The legal reserve for associated companies is determined on an individualbasis.The other reserves recognized in the company balance sheet are disclosed in the notes to the consolidatedfinancial statements (note 21.5).6. Profit for the yearAn amount of € 185.3 million will be added to the retained earnings. The proposal to the <strong>Annual</strong> General Meetingwill be to appropriate the remainder, € 125.2 million, for a dividend payment of € 1.24 per ordinary share.The dividend will be made payable in ordinary shares to be charged to the tax-exempt share premium or to becharged to the retained earnings, unless a shareholder expressly requests payment in cash.7. Financial instrumentsGeneralPursuant to its use of financial instruments, the group is exposed to the following risks:• Credit risk• Liquidity risk• Market riskThe notes to the consolidated financial statements provide information on the Group’s exposure to each of theaforementioned risks, its objectives, principles and procedures for managing and measuring these risks, as wellas group capital management.These risks, objectives, principles and procedures for managing and measuring these risks as well as capitalmanagement apply mutatis mutandis to the company financial statements of Royal <strong>Boskalis</strong> Westminster N.V.Fair valueThe fair value of most of the financial instruments presented in the balance sheet, including receivables,securities, cash and cash equivalents and current liabilities are close to the book value.8. Remuneration of members of the Board of Management and members of the Supervisory BoardThe remuneration of members of the Board of Management and members of the Supervisory Board is disclosedin the consolidated financial statements under related party transactions (note 29.2).128 <strong>Annual</strong> Report 2010
Financial statements 20109. Auditor's remunerationWith reference to Section 382A, Part 9 of Book 2 of the Netherlands Civil Code, KPMG Accountants N.V. hascharged the following fees to the Company, its subsidiaries and other consolidated entities:2010 2009Audit of the financial statements 980 530Other audits 132 801,112 610Total audit fees, including fees for auditors other than KPMG Accountants N.V., related to the audit of thefinancial statements including SMIT amount to € 1.4 million (2009: € 0.9 million).10. Commitments and contingent liabilitiesRoyal <strong>Boskalis</strong> Westminster N.V. heads a fiscal entity which includes her Dutch 100% Group company <strong>Boskalis</strong>Westminster Dredging B.V. The company is therefore liable for the tax obligations of the fiscal entity as a whole.The Company has arrangements with third parties, amongst which banks and pension funds. Thesearrangements are on behalf of her Group companies. Because the risks and rewards are with these Groupcompanies, the costs are charged to these companies and the liabilities are recognized by these companies. TheCompany is jointly and severally liable for the fulfillment of the liabilities under aforementioned arrangements.The company has issued guarantees on behalf of project-driven construction consortiums, and Groupcompanies’ own contracts. These amounted to € 1 million as at December 31, 2010 (2009: € 1 million). Inaddition, certain recourse obligations exist in respect of project financiers. Where deemed necessary, provisionshave been made.Some legal proceedings and investigations have been instituted against entities of Royal <strong>Boskalis</strong> WestminsterN.V. Where deemed necessary, provisions have been made.Papendrecht / Sliedrecht, March 16, 2011Supervisory BoardH. Heemskerk, chairmanH.J. HazewinkelM.P. KramerM. NiggebruggeM. van der VormC. van WoudenbergBoard of Managementdr. P.A.M. Berdowski, chairmanT.L. BaartmansJ.H. KampsRoyal <strong>Boskalis</strong> Westminster nv129
Financial statements 2010Other informationProvisions in the Articles of Association relating toprofit appropriationArticle 28.1. From the profits realized in any financial year, firstof all, distributions will be made on cumulativeprotective preference shares if possible, in theamount of the percentage specified below of theamount that has to be paid up on these sharesas from the beginning of the financial year towhich the distribution is related. The percentagereferred to above equals the average Euriborinterest rate determined for loans with a term ofone year – weighted in respect of the number ofdays to which this interest rate applied – during thefinancial year to which the distribution is related,increased by four percentage points at most; thisincrease will be determined every five years by theBoard of Management subject to the approval ofthe Supervisory Board. If in the financial year inrespect of which the above-mentioned distributiontakes place, the amount that has to be paid up oncumulative protective preference shares has beenreduced or, pursuant to a resolution for furtherpayment, has been increased, the distributionshall be reduced or, if possible, be increased by anamount equal to the above-mentioned percentageof the amount of the reduction or the increase, asthe case may be, calculated from the moment ofthe reduction or from the moment further paymentbecame compulsory. If in the course of any financialyear cumulative protective preference shares havebeen issued, the dividend on those cumulativeprotective preference shares shall be reduced forthat year in proportion to the day of issue, takinginto account a part of a month as a full month.2. If and in so far as the profit is not enough torealize the distribution referred to in paragraph 1,the deficit shall be distributed from the reserves,subject to statutory provisions.3. If in any financial year the profit referred toin paragraph 1 is not enough to realize thedistributions referred to above in this article,and furthermore no distribution or only a partialdistribution from the reserves as referred to inparagraph 2 is realized, so that the deficit is notor not completely distributed, the provisions ofthis article and the provisions of the followingparagraphs shall only apply in the followingfinancial years after the deficit has been madeup for. After application of paragraphs 1, 2 and3, no further distribution shall take place on thecumulative protective preference shares.4. Out of the remaining profit, an amount shallbe reserved annually to the extent as shall bedetermined by the Board of Management underapproval of the Supervisory Board. The remainingpart of the profits after reservation, as referred to inthe immediately preceding sentence, is at the freedisposal of the General Meeting of Shareholders andin case of distribution, the holders of ordinary shareswill be entitled thereto in proportion to their holdingof ordinary shares.Article 29.1. Dividends shall be made available for paymentwithin thirty days of their declaration, or any sooneras the Board of Management may determine.2. Unclaimed dividends will revert to the company afterfive years.3. If the Board of Management so decides, subjectto the approval of the Supervisory Board, aninterim dividend shall be distributed, subject to thepreference of the cumulative protective preferenceshares and the provisions of Article 2:105 of theDutch Civil Code.4. The General Meeting of Shareholders may decide,on the proposal of the Board of Management, thatdividends will be distributed fully or partially inthe form of shares in the company or depositarycertificates thereof.5. The company may only realize distributionsto the shareholder to the extent that its equitycapital exceeds the amount of the subscribedcapital, increased by the reserves that have to bemaintained by law or by the articles of association.6. A deficit may only be offset against reserves thathave to be maintained by law to the extent that thisis permitted by the law.Proposed profit appropriation 2010An amount of € 185.3 million will be added to theretained earnings. The proposal to the <strong>Annual</strong> GeneralMeeting will be to appropriate the remainder, € 125.2million, for a dividend payment of € 1.24 per share.The dividend will be made payable in ordinary sharesto be charged to the tax-exempt share premiumor to be charged to the retained earnings, unless ashareholder expressly requests payment in cash.130 <strong>Annual</strong> Report 2010
Financial statements 2010Independent auditor’s <strong>report</strong>To: <strong>Annual</strong> General Meeting of Shareholders of Royal<strong>Boskalis</strong> Westminster N.V.Report on the financial statementsWe have audited the accompanying financialstatements 2010 of Royal <strong>Boskalis</strong> Westminster N.V.,Sliedrecht, as set out on pages 65 to 129. Thefinancial statements include the consolidated financialstatements and the company financial statements.The consolidated financial statements comprise theconsolidated balance sheet as at December 31, 2010,the consolidated income statement, the consolidatedstatement of recognized and unrecognized incomeand expenses, the consolidated statement of cashflows and consolidated statement of changes in equityfor the year then ended, and notes, comprising asummary of the significant accounting policies andother explanatory information. The company financialstatements comprise the company balance sheet as atDecember 31, 2010, the company income statementfor the year then ended and the notes, comprisinga summary of the accounting policies and otherexplanatory information.Management’s responsibilityManagement is responsible for the preparation and fairpresentation of the financial statements in accordancewith International Financial Reporting Standards asadopted by the European Union and with Part 9 of Book2 of the Netherlands Civil Code, and for the preparationof the management board <strong>report</strong> in accordancewith Part 9 of Book 2 of the Netherlands Civil Code.Furthermore, management is responsible for suchinternal control as it determines is necessary to enablethe preparation of the financial statements that arefree from material misstatement, whether due to fraudor error.Auditor’s responsibilityOur responsibility is to express an opinion on thesefinancial statements based on our audit. We conductedour audit in accordance with Dutch law, includingthe Dutch Standards on Auditing. This requires thatwe comply with ethical requirements and plan andperform the audit to obtain reasonable assuranceabout whether the financial statements are free frommaterial misstatement.An audit involves performing procedures to obtainaudit evidence about the amounts and disclosuresin the financial statements. The procedures selecteddepend on the auditor’s judgment, including theassessment of the risks of material misstatementof the financial statements, whether due to fraud orerror. In making those risk assessments, the auditorconsiders internal control relevant to the entity’spreparation and fair presentation of the financialstatements in order to design audit procedures thatare appropriate in the circumstances, but not for thepurpose of expressing an opinion on the effectivenessof the entity’s internal control. An audit also includesevaluating the appropriateness of accounting policiesused and the reasonableness of accounting estimatesmade by management, as well as evaluating the overallpresentation of the financial statements.We believe that the audit evidence we have obtainedis sufficient and appropriate to provide a basis for ouraudit opinion.Opinion with respect to the consolidatedfinancial statementsIn our opinion, the consolidated financial statementsgive a true and fair view of the financial position ofRoyal <strong>Boskalis</strong> Westminster N.V. as at 31 December2010 and of its result and its cash flows for the yearthen ended in accordance with International FinancialReporting Standards as adopted by the European Unionand with Part 9 of Book 2 of the Netherlands Civil Code.Opinion with respect to the company financialstatementsIn our opinion, the company financial statements givea true and fair view of the financial position of Royal<strong>Boskalis</strong> Westminster N.V. as at 31 December 2010 andof its result for the year then ended in accordance withPart 9 of Book 2 of the Netherlands Civil Code.Report on other legal and regulatory requirementsPursuant to the legal requirements under Section 2:393sub 5 at e and f of the Netherlands Civil Code, we haveno deficiencies to <strong>report</strong> as a result of our examinationwhether the management board <strong>report</strong>, as set outon pages 35 to 61, to the extent we can assess, hasbeen prepared in accordance with part 9 of Book 2of this Code, and if the information as required underSection 2:392 sub 1 at b - h has been annexed. Further,we <strong>report</strong> that the management board <strong>report</strong>, to theextent we can assess, is consistent with the financialstatements as required by Section 2:391 sub 4 of theNetherlands Civil Code.Rotterdam, March 16, 2011KPMG Accountants N.V.D.J. Randeraad RARoyal <strong>Boskalis</strong> Westminster nv131
Summary financial information 2010132 <strong>Annual</strong> Report 2010
Other informationTen-year overview 134Stichting Continuïteit KBW 135Supervision, Board & Management 136Legal structure 140Disclosures required by the Decree article10 of the EU Directive on takeover bids 141Glossary 143Equipment 144133
Other Financial information statements 2010Ten years <strong>Boskalis</strong>(1) (14)(amounts x € 1 million, unless stated otherwise) 2010 2009 2008 2007 2006 2005 2004 2003 (2) 2002 2001Revenue (work done) 2,674 2,175 2,094 1,869 1,354 1,156 1,020 1,046 1,035 1,083Order book (work to be done) (3) 3,248 2,875 3,354 3,562 2,543 2,427 1,244 1,202 1,273 1,224EBIT (5) 401.9 249.3 339.1 245.5 150.3 82.3 47.5 69.6 99.6 97.7EBITDA (6) 621.5 444.9 454.6 348.1 236.8 162.5 136.5 148.9 166.2 159.9Net result 310.5 227.9 249.1 204.4 116.6 62.7 33.9 70.9 82.1 77.7Net group profit (7) 312.9 229.2 250.1 207.1 117.0 63.3 34.1 70.9 82.1 77.7Depreciation, amortization andimpairment losses 219.6 195.7 115.4 102.5 86.6 80.2 89.0 79.3 66.6 62.2Cash flow 532.5 424.8 365.6 309.6 203.6 143.5 123.1 150.2 148.7 139.9Shareholders' equity (3) 1,565.0 1,295.8 860.1 768.1 618.6 542.9 467.9 455.2 413.0 376.0Average number of outstanding shares (x 1,000) (8) 99,962 88,372 85,799 85,799 85,799 85,254 83,307 79,890 77,847 77,700Number of outstanding shares (x 1,000) (9) 100,974 98,651 85,799 85,799 85,799 85,799 84,522 81,768 77,910 77,751Personnel (number of persons) (4) 13,832 10,514 10,201 8,577 8,151 7,029 7,033 3,186 3,285 3,119Ratios (percentages)Operating result as % of the revenue 15.0 11.5 16.2 13.1 11.1 7.1 4.7 6.7 8.9 9.0Return on capital employed (10) 18.1 20.2 29.1 27.7 19.1 12.0 7.0 16.0 20.3 21.4Return on equity (11) 21.7 21.1 30.6 29.5 20.1 12.4 7.2 16.3 20.8 22.1Solvency (3) (12) 37.1 46.5 34.0 35.3 39.4 41.3 38.1 42.5 41.6 38.4Figures per share (x € 1.00)Profit (8) (13) 3.11 2.58 2.90 2.38 1.36 0.74 0.41 0.89 1.05 1.00Cash flow (8) 5.30 4.81 4.26 3.61 2.37 1.68 1.48 1.88 1.91 1.80Dividend 1.24 1.19 1.19 1.19 0.68 0.37 0.25 0.35 0.42 0.40Share price range (x € 1.00)(Depositary receipts of) ordinary shares 23.16 13.25 15.30 21.06 14.67 8.58 6.02 5.50 5.93 8.3836.58 28.45 42.45 46.25 25.48 18.75 8.33 7.72 11.85 12.38(1) Figures taken from the financial statements. As from 2004 all amounts are in accordance with EU-IFRS.(2) Results on work in progress from 2003 onwards based on work done and up to and including 2002 based on completed contracts.(3) As at December 31, 2003 amended for EU-IFRS.(4) As at December 31, 2004 amended for EU-IFRS.(5) Consists of earnings before share in result of associated companies, finance income and expenses and taxation.(6) Consists of earnings before share in result of associated companies, finance income and expenses, taxation, depreciation, amortisation and impairment losses.(7) As from 2004: net result + net profit attributable to minority interests.(8) Weighted average number of outstanding shares less the number of shares owned by the company.(9) Number of outstanding ordinary shares less the number of shares owned by the company as at December 31.(10) Net result + interest paid on long-term loans as % of the average capital employed (shareholders’ equity + long-term loans).(11) Net result as % of the average shareholders’ equity.(12) Group equity as % of the balance sheet total (non-current assets + current assets).(13) The dilution effect was practically nil up to the financial year 2010.(14) On May 21, 2007 Royal <strong>Boskalis</strong> Westminster N.V. effected a share split on a three-for-one basis (three new shares for one old share) in order to increase the liquidity of the <strong>Boskalis</strong> share.For comparative purposes the data regarding the number of shares and figures per share of all the periods has been recalculated to the situation after the split of the ordinary <strong>Boskalis</strong> sharesin 2007.134 132<strong>Annual</strong> Report 2010
Other informationStichting Continuïteit KBWReportBy decision of the General Meeting of Shareholdersheld on 9 May 2001 the foundation StichtingContinuïteit KBW was granted the right to acquirecumulative protective preference shares in Royal<strong>Boskalis</strong> Westminster N.V. for a nominal amountequal to the nominal amount of ordinary sharesoutstanding at the time of issue of the sharesconcerned. The option of issuing such cumulativeprotective preference shares was not exercisedduring the period under review.The Board of Stichting Continuïteit KBW consists ofthree members:J.A. Dekker – chairmanJ.F. van DuyneP.N. WakkieDeclaration of independenceThe Board of Stichting Continuïteit KBW andthe Board of Management of Royal <strong>Boskalis</strong>Westminster N.V. hereby declare that in theiropinion Stichting Continuïteit KBW is anindependent legal entity, separate from Royal<strong>Boskalis</strong> Westminster N.V., as defined in Section5:71, first paragraph under c of the FinancialSupervision Act.Papendrecht/Sliedrecht, 16 March 2011Royal <strong>Boskalis</strong> Westminster N.V.Board of Management`s-Gravenland, 16 March 2011Stichting Continuïteit KBWThe BoardRoyal <strong>Boskalis</strong> Westminster nv135
Other informationSupervision, Board & ManagementMembers of the Supervisory BoardMr. H. Heemskerk (1943), chairman• date of first appointment: 1 July 2006, currentterm ends 2013• former chairman of the Executive Board ofRabobank Nederland• member of the Supervisory Board ofBank Sarasin & Cie AG, GreenportOntwikkelingsmaatschappij B.V.• member of the Supervisory Board of WageningenUniversity and Research Centre• member of the Executive Board of VlerickLeuven Gent Management School• member of the Board of the Stock ExchangeAssociation Foundation• member of the Amsterdam Institute of FinanceAdvisory CouncilMr. H.J. Hazewinkel (1949)• date of first appointment 27 March 2010, currentterm ends 2014• chairman of the Supervisory Board of TKH GroepN.V., Heisterkamp B.V. and Reggefiber B.V.• member of the Supervisory Board of ZeemanGroep B.V., Reggeborgh Groep, ZorgpuntHolding B.V., SOWECO N.V. and Schiphol GroupN.V.• member of the Supervisory Committee of Orkestvan het Oosten• member of the Board of Stichting ING AandelenMr. M.P. Kramer (1950)• date of first appointment 19 August 2009,current term ends 2012• Chief Executive Officer of South Stream project• chairman of the Board of Koninklijke Verenigingvan Gasfabrikanten in Nederland (KVGN)Mr. M. Niggebrugge (1950)• date of first appointment 30 August 2006,current term ends 2013• member of the Executive Board of N.V.Nederlandse Spoorwegen• member of the Executive Board and generaladministrative board of Vereniging VNO-NCW• member of the Supervisory Board ofDiakonessenhuis UtrechtMr. M. van der Vorm (1958)• date of first appointment 18 May 1993, currentterm ends 2011• chairman of the Executive Board of HAL HoldingN.V.• member of the Supervisory Board of AnthonyVeder Group N.V. and Royal Vopak N.V.Mr. C. van Woudenberg (1948)• date of first appointment 9 May 2007, currentterm ends 2011• former member of the Executive Committee ofAir France - KLM• member of the Supervisory Board of RoyalGrolsch N.V., Mercurius Groep B.V., TransaviaAirlines B.V. and Martinair Holland N.V., MNServices N.V. and The Netherlands Chamber ofCommerceAll members of the Supervisory Board havethe Dutch nationality. They do not hold sharesor associated option rights in Royal <strong>Boskalis</strong>Westminster N.V.SecretaryMs. F.E. Buijs (1969)136 <strong>Annual</strong> Report 2010
Supervision, Board & ManagementMembers of the Board of ManagementDr. P.A.M. Berdowski, chairman (1957)• Chairman of the Board of Management since2006• member of the Board of Management since 1997• Chairman of the Supervisory Board of AmegaHolding B.V. and N.V. Holding Westland Infra• Member of the Supervisory board of TBIHoldings B.V. and Van Gansewinkel Groep B.V.Mr. T.L. Baartmans (1960)• Member of the Board of Management since 2007• Member of the Executive Board of theNetherlands Association of InternationalContractors (NABU), International Associationof Dredging Companies (IADC) and MutualInsurance Association (Munis)Mr. J.H. Kamps, Chief Financial Officer (1959)• Member of the Board of Management since 2006• Member of the Executive Board of StichtingFondsenbeheer Waterbouw and StichtingBedrijfstakpensioenfonds Waterbouw• Chairman of Stichting Pensioenfonds <strong>Boskalis</strong>All members of the Board of Management havethe Dutch nationality. They do not hold sharesor associated option rights in Royal <strong>Boskalis</strong>Westminster N.V.SecretaryMs. F.E. Buijs (1969)From left to right: T.L. Baartmans, dr. P.A.M. Berdowski and J.H. KampsRoyal <strong>Boskalis</strong> Westminster nv137
Other informationGroup Managementdr. P.A.M. Berdowski chairman Board of ManagementT.L. Baartmans member Board of Management, group director InternationalJ.H. Kampsmember Board of Management, Chief Financial OfficerF.A. Verhoeven chairman board of directors SMITP. van der Linde group director European Home marketsCorporate StaffOperational StaffIR & Corporate CommunicationsM.L.D. SchuttevâerPersonnel & OrganizationJ. den HartogGroup ControllingJ.O.B. GoslingsResearch & Developmentdr. A.C. SteenbrinkFiscal AffairsR.J. SelijDredging DepartmentH. PostmaTreasury & InsuranceF.A.J. RousseauCentral Technical DepartmentE.C. HolmanLegal AffairsJ.C. PrakkeM.A.A. de JongeCompany SecretaryF.E. BuijsRock DepartmentJ. de ReusICTM.J. KrijgerS.G. van KeulenSHE-QW. HaaijerStrategy & Business DevelopmentT.R. BennemaDredging &EarthmovingHarbourTowageSalvage,Transport &Heavy LiftTerminal ServicesMaritimeInfrastructureoffices of Royal <strong>Boskalis</strong> Westminster138 <strong>Annual</strong> Report 2010
Supervision, Board & ManagementDredging & EarthmovingHarbour TowageInternationale ProjectenmarktArea EuropeC. van den Heuvel, J.M.L.D. DieterenArea MiddleP.G.R. Devinck, B. Fresel, J.H. Wiersma, M. van der AArea Middle-EastJ. Boender, K.A. VakanasArea EastL. Slinger, M. SiebingaArea WestP. KlipHome marketsThe Netherlands<strong>Boskalis</strong> B.V.: P. van der Knaap, B.J.H. PröpperUnited KingdomWestminster Dredging Company Ltd: H.H.A.G. Wevers,J. VerdoornGermanyHeinrich Hirdes GmbH: H.G. PeistrupNordic (Finland and Sweden)Terramare Oy en <strong>Boskalis</strong> Sweden AB: J.K. Yletyinen, H.LindströmMexicoDragamex S.A. de C.V.: P.M. de JongNigeriaNigerian Westminster Dredging & Marine Ltd: F.J. BuitenhuisSpecialist niche servicesOffshore services<strong>Boskalis</strong> Offshore B.V.: J.F.A. de Blaeij, S.G.M. van BemmelenEnvironmental Contracting<strong>Boskalis</strong> Dolman B.V.: J.A. DolmanSoil-improvement techniquesCofra B.V.: J.K. van EijkUnder water rock fragmentationRock Fall Company Ltd: C. FergussonEuropeP. Vierstraete (Belgium), H.J. Smith (The Netherlands),M.J. van den Akker (UK)AmericasL. Introzzi (Argentina), L.F.J. Kullberg (Canada), M.F. Sales (Brazil),R.C. Elliott (Panama)AsiaL. Huisman (Singapore), P. Zhang (China), S. Kejriwal (India)Salvage, Transport & Heavy LiftSalvageJ. Halfweeg, D. Martin (US), D. Main (South-Africa),E. Kraan (Singapore)Transport & Heavy LiftEuropeM. Meeuwisse, D. Spaans, D. Lagerweij (SMIT Marine Projects),S. Korte (SMIT Subsea)AfricaP. Maclons (SMIT Amandla Marine), P.D. Murray (SMIT Transport),J. Wengrowe (SMIT Subsea Africa)AsiaL. Huisman, J. BruinsmaUAEP. Cottrell (SMIT Subsea Middle East)Terminal ServicesSMIT TerminalsH.J. Smith, A. van Dijk, A. van der WalLamnalcoD. KoornneefBoard of directors SMITF.A. Verhoeven, chairmanL.F.J. Kullberg, managing director Divisions Harbour Towageand TerminalsG.A. Keser, managing director Division Salvage, Transport &Heavy LiftH.J. Hilhorst, director FinanceWorks CouncilT.A. Scheurwater (chairman), C.C. Brijder, V.P. Commandeur,C.A. van Dam, F.M.C. van Gerven, A.D. Groeneveld,A.M.C. Kruithof, S. van der Land, G. Prins, W.L. Stander,C.G.A. Tonnaer, M. Treffers (vice-chairman) D.A. van Uitert,M.F. van Wijk, secretary, M. Wischmeijer, P.E. den Otter-Bakker(official secretary)Royal <strong>Boskalis</strong> Westminster nv139
Other informationLegal structureRoyal <strong>Boskalis</strong> Westminster N.V.<strong>Boskalis</strong> Westminster Dredging B.V.Holding and service companiesA selection of operating companies and participating interests<strong>Boskalis</strong> Holding B.V.Baggermaatschappij <strong>Boskalis</strong> B.V.Aannemingsmaatschappij Markus B.V.A.H. Breijs & Zonen B.V.Baggermaatschappij Holland B.V.<strong>Boskalis</strong> B.V.<strong>Boskalis</strong> Dolman B.V.Cofra B.V.Hydronamic B.V.J. van Vliet B.V.<strong>Boskalis</strong> Westminster International B.V.<strong>Boskalis</strong> Westminster Ltd<strong>Boskalis</strong> Zinkcon LtdIrish Dredging Company LtdRock Fall Company LtdRW Aggregates Ltd (50%)Westminster Gravels LtdWestminster Dredging Company Ltd<strong>Boskalis</strong> International B.V.Adreco Serviços de Dragagem LDA (49%)Beijing <strong>Boskalis</strong> Dredging Technology LtdBKI Gabon SA<strong>Boskalis</strong> Australia Pty Ltd<strong>Boskalis</strong> International Egypt for Marine Contracting SAE<strong>Boskalis</strong> International (M) Sdn Bhd (30%)<strong>Boskalis</strong> International (S) Pte Ltd P.T.<strong>Boskalis</strong> International Uruguay SA<strong>Boskalis</strong> Guyana Inc.<strong>Boskalis</strong> Taiwan Ltd<strong>Boskalis</strong> Zinkcon B.V.Coastal and Inland Marine Services Inc.Dragamex SA de CVDravensa CAKoon Zinkcon Pte Ltd (50%)<strong>Boskalis</strong> International IndonesiaRiovia SAZinkcon Marine Singapore Pte LtdOthersArchirodon Group N.V. (40%)Atlantique Dragage SARL<strong>Boskalis</strong> Canada Dredging & Marine Services LtdBKW Dredging and Contracting Ltd<strong>Boskalis</strong> Dredging India Pvt Ltd<strong>Boskalis</strong> Italia S.r.l.<strong>Boskalis</strong> Polska Sp. z o.o.<strong>Boskalis</strong> Sweden ABDredging & Contracting Belgium NVHeinrich Hirdes Kampfmittelräumung GmbHNigerian Westminster Dredging & Marine Ltd (60%)OOO BolmorstroyOOO Mortechnika (50%)Soc. Española de Dragados SAStuyvesant Dredging CompanyTerramare OyOthers (continued)<strong>Boskalis</strong> Westminster (Oman) LLC (49%)Dragapor Dragagens de Portugal S.A.UAB <strong>Boskalis</strong> Baltic<strong>Boskalis</strong> Offshore B.V.Sandpiper AS<strong>Boskalis</strong> Offshore AS<strong>Boskalis</strong> Westminster Middle East LtdLamnalco Ltd (50%)Lamnalco (Sharjah) Ltd (35%)Lamnalco LLC (50%)<strong>Boskalis</strong> Westminster Al-Rushaid Ltd (49%)BW Marine (Cyprus) Ltd<strong>Boskalis</strong> Finance B.V.<strong>Boskalis</strong> Maritime Investments B.V.Smit Internationale N.V.Smit Internationale Beheer B.V.Smit International Overseas B.V.Smit Nederland B.V.Smit Holding Singapore Pty LtdSmit Shipping Singapore Pty LtdHarbour TowageSmit Harbour Towage Argentina S.A.Smit Harbour Towage (U.K.) Ltd.Smit Harbour Towage (Panama) Inc.Smit Harbour Towage Rotterdam B.V.Smit Taiwan Holding Investment Co LtdSmit Marine Canada Inc.Unie van Redding- en Sleepdienst Belgie N.V.Keppel Smit Towage Pte. Ltd., Singapore (49%)Rebras Rebocadores Do Brasil S.A. (50%)Towmar Smit Baltic UAB (50%)Smit Marine Australia Pty LtdTerminalsSmit Internationale (Gabon) S.A.Smit Terminals Europe B.V.Smit Terminals Sonagas S.A. (64%)Adriatic Towage S.R.L. (50%)SalvageSmit Salvage B.V.Smit Salvage Ltd.Smit Salvage Americas Inc.Donjon-Smit LLC (50%)Heavy Lift & TransportSmit Amandla Marine Pty. Ltd. (70%)Smit Transport Europe B.V.Smit Transport Belgium N.V.Smit Heavy Lift Europe B.V.Smit Marine Projects B.V.Smit Subsea Europe B.V.Smit Subsea Africa Ltd.Smit Subsea Middle East L.L.C. (49%)Ocean Marine Egypt S.A.E. (50%)Asian Lift Pte. Ltd. (50%)140 <strong>Annual</strong> Report 2010
Other informationDisclosures required by the Decree article 10 of the EU Directive on takeover bidsUnder the Decree article 10 of the EU Directiveon takeover bids companies whose securities areadmitted to trading on a regulated market mustdisclose information in their annual <strong>report</strong>s onmatters including their capital structure and theexistence of any shareholders with special rights.In accordance with these requirements, <strong>Boskalis</strong>hereby makes the following disclosures:a. For information on the capital structure of thecompany, the composition of the issued capital andthe existence of various types of shares, pleaserefer to page 98 of the notes to the consolidatedfinancial statements in this annual <strong>report</strong>.For information on the rights attached to theseshares, please refer to the company’sArticles of Association which can be foundon the company website. To summarize, therights attached to ordinary shares comprisepre-emptive subscription rights upon the issueof ordinary shares, the entitlement to attendthe General Meeting of Shareholders, and tospeak and vote at that meeting, and the right todistribution of such amount of the company’sprofit as remains after allocation to reserves.As at December 31, 2010 the entire issuedcapital consisted of ordinary shares (registeredand bearer shares). These are only issuedagainst payment in full.b. The company has imposed no limitations onthe transfer of ordinary shares. The Articlesof Association have stipulated a blockingprocedure for protective preference shares. Thecompany is not aware of any shares having beenexchanged for depositary receipts.c. For information on equity stakes in the companyto which a notification requirement applies(pursuant to Sections 5:34, 5:35 and 5:43 of theFinancial Supervision Act), please refer to thesection ‘Investor Relations’ on page 23 of thisannual <strong>report</strong>. Under the heading ‘Shareholders’you will find a list of shareholders whom thecompany knows to have holdings of 5% or moreat the stated date.d. There are no special control rights or otherrights associated with shares in the company.e. The company does not operate a schemegranting employees rights to acquire or obtainshares in the capital of the company or any of itssubsidiaries.f. No restrictions apply to voting rights associatedwith the company’s shares, nor are there anydeadlines for exercising voting rights.g. No agreements with shareholders exist whichmay result in restrictions on the transfer ofshares or limitation of voting rights.h. The rules governing the appointment anddismissal of members of the Board ofManagement and the Supervisory Board andamendment of the Articles of Association arestated in the company’s Articles of Association.To summarize the statutory structure regimeis applicable to the Company. Members ofthe Board of Management are appointedand dismissed by the Supervisory Board,with the proviso that the General Meetingof Shareholders must be consulted prior tothe dismissal of any member of the Board ofManagement. Supervisory Board membersare nominated by the Supervisory Boardand appointed by the General Meeting ofShareholders. The Works Council has anenhanced right of recommendation for onethirdof the number of the members of theSupervisory Board. The meeting of shareholderscan declare a vote of no confidence in theSupervisory Board by an absolute majority ofvotes cast, representing at least one-third ofissued capital. Such a vote of no confidenceshall result in the immediate dismissal of theSupervisory Board members. Amendment ofRoyal <strong>Boskalis</strong> Westminster nv141
Other informationthe company’s Articles of Association requiresa decision by a meeting of shareholders inresponse to a proposal made by the Boardof Management with the approval of theSupervisory Board.i. The general powers of the Board of Managementare set out in the Articles of Association ofthe Company. The powers of the Board ofManagement in respect of the issuance ofshares in the company are set out in article 4of the company’s Articles of Association. Tosummarize, the General Meeting of Shareholders- or the Board of Management authorizedby the general meeting – takes the decision,subject to prior approval by the SupervisoryBoard, to issue shares, whereby the issue priceand other conditions relating to the issue aredetermined by the general meeting – or theBoard of Management authorized by the GeneralMeeting. In the event the Board of Managementis authorized to take decisions with respectto the issue of shares, the number of sharesthat may be issued as well as the term of theauthorization must also be determined. Rulesgoverning the acquisition and disposal by thecompany of shares in its own capital are setout in article 7 of the Articles of Association. Tosummarize (briefly), the Board of Managementmay decide, subject to authorization by themeeting of shareholders and to prior approval bythe Supervisory Board, for the company to buyback fully paid-up shares up to a maximum of10% of issued capital. Decisions regarding thedisposal of shares acquired by the company aretaken by the Board of Management, subject toprior approval by the Supervisory Board.significant agreements which take effect orare altered or terminated upon a change ofcontrol of the company as a result of a publicoffer within the meaning of Section 5:70 of theFinancial Supervision Act. The General Meetingof Shareholders of May 9, 2001 decided to grantStichting Continuïteit KBW the right to acquireprotective preference shares.k. The company has not entered into anyagreements with either members of the Board ofManagement or employees which provide for apay-out on termination of their employment asa result of a public offer within the meaning ofSection 5:70 of the Financial Supervision Act.j. With the exception of the option agreementwith Stichting Continuïteit KBW concerning theplacement of cumulative protective preferenceshares as set out in section 26.4 of the financialstatements, the company is not a party to any142 <strong>Annual</strong> Report 2010
Other informationGlossaryAcquired orders Contract value of acquired assignments.Backhoe A large hydraulic excavating machine positioned onthe end of a pontoon. The pontoon is held firmly in place usingspuds. Backhoes can dredge in a range of soil types with extremeprecision.Bucket dredger The standard, anchored dredger with a revolvingchain and buckets that dig into the bed and are discharged. Thistype of equipment is now mainly used for environmental dredgingand other jobs requiring extreme precision, such as dredging tunneltrenches.Bollard pull The pulling capacity of a tug, expressed in metrictonnes.Bunker fuel Type of fuel used by oceangoing and other vessels.Bunkering refers to the act or process of supplying a ship with thistype of fuel.Bunker vessel Vessel used to supply oceangoing ships with fuel.CapEx Capital expenditure.Cash flow Group net profit adjusted for depreciation, amortizationand impairments.Completed contracts Contract value of completed work.Cost leadership Achieving lowest cost price.Cutter/Cutter dredger See cutter suction dredger.Cutter suction dredger A vessel that dredges while being held intoplace using spuds and anchors. This technique combines powerfulcutting with suction dredging. Cutter suction dredgers are mainlyused where the bed is hard and compact. The dredged material issometimes loaded into hoppers but is generally pumped to landthrough a pressure pipeline.Dismantle To take apart and/or remove an object.EBITDA Group earnings before the result of associated companies,interest, tax, depreciation, amortization and impairments.Emissions Pollutants released into the environment.EU-IFRS IFRS stands for International Financial ReportingStandards. EU-IFRS are financial <strong>report</strong>ing rules drawn up andissued by the IASB (International Accounting Standards Board)and adopted within the European Union. Since 2005 all publiclylisted companies within the European Union have been obliged tocomply with these standards in their external financial accounting/<strong>report</strong>ing.Fallpipe vessel Vessel that moves over the area to be covered, whiledumping the stones on board through a fallpipe. The vessel is keptin place by a dynamic positioning system in which the propellersand rudders are controlled by an automatic system. The end of thepipe is located just a few meters above the level of the surface tobe covered. The fallpipe is controlled using a precise positioningsystem. The fallpipe vessel Seahorse can also be equipped with anA-frame on the aftship and a grab controlled by an ROV (RemotelyOperated Vehicle). This makes it possible to dredge down to depthsof 1,000 meters.Floating Sheerlegs Floating cranes for heavy lifting.Futures A future (derivative) is a so-called forward contract; anagreement between traders to purchase or sell certain financialproducts on a specified future date at a previously agreed fixedprice.Hazardous substances Liquid or solid substances which present ahealth hazard and/or are damaging to the environment.Global Reporting Initiative International organization that developsglobal standards for sustainability <strong>report</strong>ing.Greenfield project Project to create new infrastructure.Home market <strong>Boskalis</strong> distinguishes itself from its competitors inthe Dredging & Earthmoving segment by the use of a home marketstrategy. The home market organizations have local marketingprofiles, as well as their own fleets and infrastructures. They canrely on the support of the financial and technical resources of theglobal <strong>Boskalis</strong> organization. Home markets provide a stable flowof assignments and opportunities to generate additional marginsthrough associated activities.Hopper/hopper dredger See trailing suction hopper dredger.International projects market Market that focuses primarily onlarger capital expenditure projects for new buildings and/orextensions. In addition, there are projects that regularly involvecooperation with third parties. This makes it possible to provideclients with optimal services and to share risks.LNG Liquified Natural Gas.LTI Lost Time Injury. Expresses the number of workplace accidentsserious enough to result in absence from work.LTIF Lost Time Injury Frequency. Expresses the number ofworkplace accidents serious enough to result in absence fromwork, per 200,000 hours worked.Net Group profit Net result + net profit attributable to noncontrollinginterests.OpEx Operating expenditure.Order book The revenue accounted for by parts of orders as yetuncompleted.Return on capital employed Net result + interest paid on long-termloans as % of the average capital employed (shareholders’ equity +long-term loans).Return on equity Net result as % of the average shareholders’equity.Revenue work done Volumes produced in a given period. The workmay not yet be completed.Roro (roll-on/roll-off) ship Vessels designed to carry wheeled cargosuch as automobiles, trucks, semi-trailer trucks, trailers or railroadcars that are driven on and off the ship on their own wheels.Rockfragmentation under water Drilling and blasting hardmaterials such as rock and granite, often to deepen ports and clearnavigational channels.SHE-Q (Safety, Health, Environment & Quality) Former QA/HSE(Quality Assurance, Health, Safety and Environment).Trailing suction hopper dredger A self-propelled unit that loads itswell or hopper using centrifugal pumps and pipes that trail over thebed as the ship sails. Trailing suction hopper dredgers can operateindependently of other equipment and can transport material overlong distances. The dredged material is dumped through flaps orbottom doors, by rainbowing, or pumped onto land using a pipeline.Solvency Group equity as % of the balance sheet total (non-currentassets + current assets).Stone placing vessel A ship with a deck on which stones can beloaded. Using a dynamic positioning system and slides, the stonesare pushed over the edge of the ship into the right position in thewater.TEU Twenty feet Equivalent Unit (container); often used to describethe cargo capacity of container ships and container terminals.Work in progress Projects that have not been completed on thebalance sheet date but that have been finished in part.Royal <strong>Boskalis</strong> Westminster nv143
Other informationEquipmentDredgersBargesTrailing suction hopper dredgersCapacity > 6,000 m 3Capacity ≤ 6,000 m 3(Self-propelled)Cutter suction dredgersCapacity > 12,000 kWCapacity ≤ 12,000 kW27 + 1*1017 + 1*30 + 2*426 + 2*Backhoes19Bucket capacity from 1.4 to 24 m 3Hopper barges95 + 45*Capacity from 50 to 3,800 m 3Oceangoing flat top barges 3Capacity 24,000 tonsOceangoing flat top barges 24 + 22*Capacity from 1,000 to 14,000 tonsInland barges25 + 41*Capacity from 100 to 2,000 tonsFloating grab cranes17 + 3*Grab capacity from 1.2 to 9.2 m 3TugsOther dredging equipment 23 + 3*bucket dredger, environmental disccutter, barge unloading dredgers,suction dredgersRock dumping vesselsOceangoing tugs3 + 2*Capacity from 6,000 to 26,000 hpAnchor handling tugs 22 + 30*Capacity from 3,000 to 15,000 hpFall pipe vessels1 + 1*Capacity from 17,000 to 18,500 tonsCoastal/Harbor tugs 166 + 109*Capacity from 480 to 7,000 hpStone placing vesselsCapacity from 700 to 1,400 tons2Harbor/river (pusher) tugs 43 + 58*Capacity from 100 to 2,800 hpFloating sheerlegsSupport vessels49 + 5*Floating sheerlegs5 + 6*Capacity from 400 to 3,200 tonsLaunches, work/supply vesselsVarious/others54 + 69*116 + 17** Owned by (non-controlled) associated companies.In addition to the equipment shown here, the group also owns a range of auxiliary equipment such as floating pipelines, winches, pumps, draglines,hydraulic excavators, wheel loaders, dumpers, bulldozers, mobile cranes, crawler drill rigs, sand pillers, filling installations for shore protectionmattresses, fixed land pipelines and a wide variety of salvage equipment, such as fire fighting -, diving - and antipollution equipment.144 <strong>Annual</strong> Report 2010
ColophonCompiled and coordinated by Royal <strong>Boskalis</strong> Westminster N.V.Corporate Communications DepartmentGroup Reporting DepartmentDesign and realizationThe Concept Store, Eindhoven, The NetherlandsPhotographySteven Snoep, Chris Henderson, Van der Kloet, Roderik van Nispen,Gerben Terpstra and othersTextBondt CommunicatieLithography and printHENK Grafimedia, Belfeld, The Netherlands
Royal<strong>Boskalis</strong> Westminster nvRosmolenweg 203356 LK PapendrechtThe NetherlandsP.O. Box 433350 AA PapendrechtThe NetherlandsTelephone +31 78 69 69 000Telefax +31 78 69 69 555E-mailInternetroyal@boskalis.nlwww.boskalis.com