AP Statistics Summer Assignment - eSchoolView
AP Statistics Summer Assignment - eSchoolView
AP Statistics Summer Assignment - eSchoolView
You also want an ePaper? Increase the reach of your titles
YUMPU automatically turns print PDFs into web optimized ePapers that Google loves.
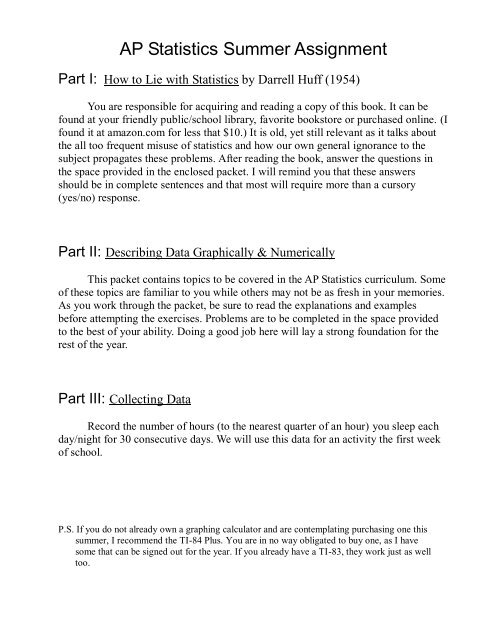
<strong>AP</strong> <strong>Statistics</strong> <strong>Summer</strong> <strong>Assignment</strong>Part I: How to Lie with <strong>Statistics</strong> by Darrell Huff (1954)You are responsible for acquiring and reading a copy of this book. It can befound at your friendly public/school library, favorite bookstore or purchased online. (Ifound it at amazon.com for less that $10.) It is old, yet still relevant as it talks aboutthe all too frequent misuse of statistics and how our own general ignorance to thesubject propagates these problems. After reading the book, answer the questions inthe space provided in the enclosed packet. I will remind you that these answersshould be in complete sentences and that most will require more than a cursory(yes/no) response.Part II: Describing Data Graphically & NumericallyThis packet contains topics to be covered in the <strong>AP</strong> <strong>Statistics</strong> curriculum. Someof these topics are familiar to you while others may not be as fresh in your memories.As you work through the packet, be sure to read the explanations and examplesbefore attempting the exercises. Problems are to be completed in the space providedto the best of your ability. Doing a good job here will lay a strong foundation for therest of the year.Part III: Collecting DataRecord the number of hours (to the nearest quarter of an hour) you sleep eachday/night for 30 consecutive days. We will use this data for an activity the first weekof school.P.S. If you do not already own a graphing calculator and are contemplating purchasing one thissummer, I recommend the TI-84 Plus. You are in no way obligated to buy one, as I havesome that can be signed out for the year. If you already have a TI-83, they work just as welltoo.
A9 Stat<strong>Summer</strong> <strong>Assignment</strong>NameDescribing Data Graphically & NumericallyTypes of OataQuantitative (or measurement) DataThese are data that take on numerical values that actually represent a measurement such assize, weight, how many, how long, score on a test, etc. For these data, it makes sense to findthings like "average" or "range" (largest due-smallest value). For instance, it doesn't makesense to find the mean shirt color because shirt color is not an example of a quantitativevariable. Some quantitative variables take on discrete values, such as shoe size (6, 6 + , 7, ...)or the number of soup cans collected by a school. Other quantitative variables take oncontinuous values, such as your height (60 inches, 72.999993 inches, 64.039 inches, etc ...)or how much water it takes to fill up your bathtub (73.296 gallons or 185.4 gallons or 99gallons, etc).Categorical (or qualitative) DataThese are data that take on values that describe some characteristics of something, suchas the color of shirts. These values are "categories" of a population, such as M or F forgender of people, Don't Drive or Drive for the method of transportation used by studentsto get to school. These are examples of binary variables. These variables only have twopossible values. Some categorical variables have more than two values, such as hair color,brand of jeans, and so on.Two types of VariablesQuantitativeCategoricalDiscreteContinuousCategoriesExercises: Answer the following questions and then decide if the data is quantitative orcategorical (Q or C)Answer1. I n what grade did you take Alegebra 132. How many CDs do you own?3. How old was your father when you were born?4. How old was your mother when you were born?5. Choose a random integer from 1 to 20.6. How many siblings do you have?(all, whether you live with them or not)7. How many cousins do you have?
How to lie With <strong>Statistics</strong> Introduction and Chapter 1Read the Introduction and Chapter 1 to How to Lie With <strong>Statistics</strong>. Answer the followingquestions and be ready to discuss the chapter in class.1. Choose one of the quotations inside the front cover and discuss how it relates to theIntroduction.2. What does the author mean in the fourth paragraph of Chapter 1, “It is quiteimprobably salubrious?”3. List as many sources of sample bias as you can that are mentioned in Chapter 1 andprovide an example of each.
How to lie With <strong>Statistics</strong> Introduction and Chapter 14. Put the second paragraph on Page 18 (“A river cannot….”) into your own words.5. What is the advantage of a stratified random sample and what difficulties does itpose, according to this chapter?6. On Page 26, the author suggests that most polls are biased in the direction of theLiterary Digest error.a. What incident does this refer to?b. That incident took place during (and arguably because of) the GreatDepression. Are the lessons learned from that still relevant for us today?Why?c. In what direction is that bias?7. Comment on the last paragraph of Chapter 1.
How to lie With <strong>Statistics</strong> Chapter 2Read Chapter 2 of How to Lie With <strong>Statistics</strong>. Answer the following questions and be readyto discuss the chapter in class.1. Chapter 2 begins with an illustration in which someone is snobbish about an incomeof $15,000 a year. Why did the author choose such a small income figure when itseems that a much higher one would fit the context better?2. Summarize Chapter 2 in a few sentences.3. What did the hypothetical business partners do in Chapter 2 to make the distributionof earnings seem more palatable to the employees?4. When we see an average reported, what do we need to ask besides which kind ofaverage is being used? Why?5. What confidence level was used in the Census Bureau’s report referred to in thischapter? How do you know? Is the way that this confidence level is described acorrect interpretation of the confidence level?6. Which kind of “average” would best describe the height of students at our highschool? Why?7. Which kind of “average” (statisticians call all three “measures of central tendency”)would give me the best way to compare the performance of two classes of a requiredmath course? Why?
How to Lie With <strong>Statistics</strong> Chapter 3Read Chapter 3 of How to Lie With <strong>Statistics</strong>. Answer the following questions and be readyto discuss the chapter in class.1. Explain why advertisers often rely on a very small sample to substantiate their claims.2. We have learned that a proper sample of only 1,000 individuals from the entirepopulation of the United States can give us results with only a 3% margin of error(assuming p=.5, at a 95% confidence level). Why, then, does the author suggest that asample of over a thousand can be much too small in some situations?3. Chapter 3 is titled “The Little Figures That Are Not There.” This chapter discusses atleast five different kinds of information that may be missing when we are faced witha claim based in data. See how many of these missing pieces of information you canfind mentioned in the chapter.4. On Page 44 the author uses two words that may be new to you: rotogravure andinvidious. Provide a brief definition of each and explain how the author is using theword in this context.
How to Lie With <strong>Statistics</strong> Chapter 35. What does the author mean on Page 45 when he says, “Hardly anybody is exactlynormal in any way…?”6. How can the graph of the advertising agency’s business be misleading when thegraph clearly shows such an upward trend?7. When reviewing scholarship applications, I was given a table that listed the GPA ofeach applicant. What other information do I need in order to evaluate theseapplicants’ academic performance?
How to Lie With <strong>Statistics</strong> Chapters 4 - 6Read chapters 4, 5 and 6 of How to Lie With <strong>Statistics</strong>. Answer the following questions andbe ready to discuss the chapters in class.1. Select one sentence in Chapter 4 that you believe best summarizes the main points ofthis chapter.2. The author suggests that some reported differences may not be real differences at alland others, even though they can be shown to be real differences, should still beignored. Explain how each of these two situations can arise and give an example ofeach.3. What are the steps in producing a “gee-whiz” graph?4. Here is a reproduction of a Chevy ad that appeared a few years ago.LIKE A ROCK: More than 98%of all Chev y trucks sold in thelast 10 years are still on theroad.1009998979695CHEVY FORD TOYOTA NISSANThe scale was printed in white on a gray background, so you had to be looking for itto notice it. If you didn’t notice the scale, what percent would you assign to theNissan? Redraw this graph using a scale from 0 to 100. How would your versionlook as an ad?5. Why is it that making one picture twice as tall as another on a picture graph leaves animpression that one quantity is eight times as big?6. Chapter 5 talks about the wrong way to make a picture graph. Is there a right way? Ifso, how do you suppose it could be constructed to avoid leaving a false impression?7. Try to find an example of a misleading graph in a newspaper or magazine.
How to Lie With <strong>Statistics</strong> Chapter 7Read Chapter 7 of How to Lie With <strong>Statistics</strong>. Answer the following questions and be readyto discuss the chapter in class.1. What is a semi-attached figure?2. Name as many general strategies from this chapter as you can for using the semiattachedfigure. (I count roughly half a dozen.)3. Here is an excerpt from a guest commentary column in the Santa Maria Times byRon Fink (May 17, 2005). See how many semi-attached figures you can spot.The North [Santa Barbara] County routinely meets state air quality standardsand the South Coast does not. Why is that? ... The South Coast doesn’t have anymore industrial pollution emitters than does the north. Failure to meet the standardmay be connected to the 71 tons of methane that is released daily from natural seepsoff of our coastline, not any human activities. You see, the instruments used tomeasure air contaminates [sic] cannot discriminate between natural and man-madepollutants.Nature is not perfect when judged by man’s rules for polluting theenvironment. Anyone with a pollen-associated sinus problem can readily attest to theimpact that nature has on our daily lives.And what about those greenhouse gases, the purported cause of globalwarming, where do they come from? A major source is volcanoes…. Satellite dataafter the 1991 eruptions of Mt Pinatubo (the Philippines) and Mt Hudson (Chile)showed a 15-20 percent ozone loss at high latitudes and a greater than 50 percent lossover the Antarctic! … The U.S. Geological Survey determined that: globally, largevolcanic explosive eruptions that inject a tremendous volume of sulfur aerosols intothe stratosphere can lead to lower surface temperatures and promote depletion of theEarth’s ozone layer. Ash from such events [as the Mt St Helens eruptions] can travel100 miles or more downwind!
How to Lie With <strong>Statistics</strong> Chapter 7So despite what editorial writers, local environmentalists and movie makerswant you to believe, its [sic] nature that is responsible for the greatest changes innature, not human activity or President Bush’s environmental policies. I have oftenwondered how we mere humans could equal the magnitude of pollution created bynature no matter how many oil wells we drill, power plants we build, air-conditionerswe operate, hair spray we use, cars we paint or SUV’s we drive.4. See if you can find an example of a semi-attached figure. They are generally easier tofind in writing that is meant to be persuasive, such as advertising or commentaries.
How to Lie With <strong>Statistics</strong> Chapter 8Read Chapter 8 of How to Lie With <strong>Statistics</strong>. Answer the following questions and be readyto discuss the chapter in class.1. What does post hoc mean?2. List several kinds of correlation that might lead to post hoc reasoning.3. The chapter also warns against the dangers of extrapolation. What is one example theauthor uses in that discussion?4. Name two variables that you suspect would have correlation if we collected data, butfor which a cause and effect relationship does not exist. (Hint: think of a commoncausal factor first, then select your two variables.) Be creative and make it asoutrageous as possible.5. Comment briefly on each of the following reports.a. Teen drug use linked to truancyPress AssociationTuesday July 29, 2003Truants are more than five times as likely to take drugs than other schoolchildren,according to research published today. The survey found that 35% of pupils whohad ever played truant admitted they had taken drugs in the last month, comparedwith just 6% who had not skipped school. The study of 10,000 schoolchildren aged11 to 15 also found that truants were far more likely to regularly drink alcohol andsmoke.
How to Lie With <strong>Statistics</strong> Chapter 8b. 20 November, 2003Low self-esteem 'shrinks brain'By Pallab GhoshBBC Science CorrespondentPeople with a low sense of self worth are more likely to suffer from memory loss asthey get older, say researchers. The study, presented at a conference at the RoyalSociety in London, also found that the brains of these people were more likely toshrink compared with those who have a high sense of self esteem. Dr Sonia Lupien,of McGill University in Montreal surveyed 92 senior citizens over 15 years andstudied their brain scans. She found that the brains of those with low self-worthwere up to a fifth smaller than those who felt good about themselves. These peoplealso performed worse in memory and learning tests.c. Historical data show that the candidate who raises the most money before theprimary season starts generally wins the nomination.d. Winning World Cup lowers heart attack deathsApr 16, 2003 (Reuters) - Winning soccer's World Cup not only lifts a nation's spirits,it lowers the death rate from heart attacks, doctors said on Tuesday. During the1998 World Cup when France defeated Brazil in the final, deaths from heart attacksin men and women dropped on the day of the match, which was watched by 26million French TV viewers. Instead of about 33 deaths a day in the five days beforeand after the match, 23 men died of a heart attack on match day. There were alsofewer deaths in women but the decrease was not as significant.e. Church Attendance Boosts Immunity Going to church may be good for thebody as well as the soul. In a study of 1700 older Americans, researchers at DukeUniversity Medical Center found that those who attended religious services hadstronger immune responses. About 60% of the men and women surveyed attendedreligious services at least once a week. Blood tests showed that regular attendeeswere less likely to have high levels of an immune-system protein involved in agerelateddiseases. -- Article from Parade Magazine, 1997
How to Lie With <strong>Statistics</strong> Chapter 9Read Chapter 9 of How to Lie With <strong>Statistics</strong>. Answer the following questions and be readyto discuss the chapter in class.1. Who do you think are the people who are most likely to statisticulate, and for whatpurposes?2. Which of the maps on Page 103 is drawn fairly, without statisticulation?3. Why are percentages so often a source of statisticulation? (I’m starting to like this newword. )4. Explain how the difference between two students at the 90 th and 95 th percentiles, fivepercentiles apart, can be (and usually is) greater than the difference between twostudents at the 50 th and 60 th percentiles, ten percentiles apart.5. Summarize the chapter in one or two sentences.
How to Lie With <strong>Statistics</strong> Chapter 10Read Chapter 10 of How to Lie With <strong>Statistics</strong>. Answer the following questions and be readyto discuss the chapter in class.As we look to see who is offering a statistic for our consumption, what should we look for?If a respectable organization is cited as a source of a statistic, what do we still need toconsider about that authority?The example of the survey on prices during the Korean War brought out what can be asubtle way in which a sample can be biased. What is that source of bias and what is thename we give to samples likely to be biased in that manner?What are some of the many critical things that are commonly missing when a statistic isreported in the media?One of the more subtle ways for somebody to “change the subject” has to do with statisticsbased on what people say. What is the difficulty that it is essential we look out for withsuch a statistic?Summarize the five questions we can ask to defend ourselves as a consumer of statistics.(Explain briefly what each question is about.)


