- Page 1 and 2: 2013 ANNUAL REPORTINCOME FUNDS■ C
- Page 3 and 4: Portfolio Manager’s LetterCASH MA
- Page 5 and 6: Fund Expenses (unaudited)CASH MANAG
- Page 7 and 8: PrincipalAmountSecurityInterestRate
- Page 9 and 10: Portfolio Managers’ LetterGOVERNM
- Page 11 and 12: Fund Expenses (unaudited)GOVERNMENT
- Page 13 and 14: Merrill Lynch GNMA Master Index is
- Page 15 and 16: PrincipalAmount Security ValueU.S.
- Page 17 and 18: Portfolio Managers’ LetterINVESTM
- Page 19 and 20: Fund Expenses (unaudited)INVESTMENT
- Page 21 and 22: shown in the line graph above for C
- Page 23 and 24: PrincipalAmount Security ValueFinan
- Page 25 and 26: PrincipalAmount Security ValueHealt
- Page 27 and 28: PrincipalAmount Security ValueUtili
- Page 29 and 30: Portfolio Manager’s LetterSTRATEG
- Page 31 and 32: Fund Expenses (unaudited)STRATEGIC
- Page 33 and 34: Accounting Standards Codification (
- Page 35 and 36: Yet here we are five years later wi
- Page 37 and 38: Cumulative Performance Information
- Page 39 and 40: Portfolio of Investments (continued
- Page 41 and 42: PrincipalAmount Security ValueNorwa
- Page 43 and 44: Accounting Standards Codification (
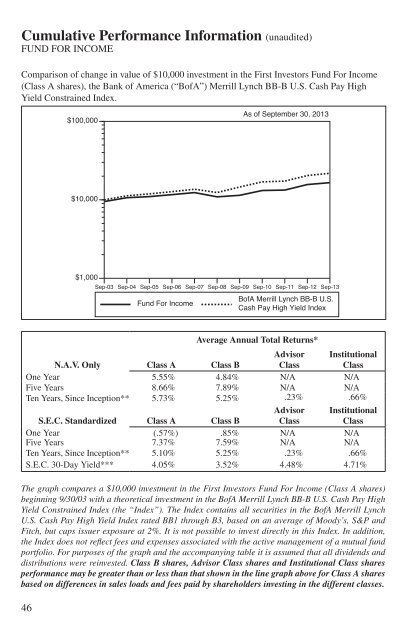
- Page 45 and 46: Portfolio Manager’s LetterFUND FO
- Page 47: Fund Expenses (unaudited)FUND FOR I
- Page 51 and 52: PrincipalAmount Security ValueChemi
- Page 53 and 54: PrincipalAmount Security ValueEnerg
- Page 55 and 56: PrincipalAmount Security ValueHealt
- Page 57 and 58: PrincipalAmount Security ValueMedia
- Page 59 and 60: PrincipalAmount Security ValueServi
- Page 61 and 62: PrincipalAmount Security ValueWirel
- Page 63 and 64: Shares Security ValueCOMMON STOCKS
- Page 65 and 66: The following is a reconciliation o
- Page 67 and 68: Portfolio Managers’ LetterTOTAL R
- Page 69 and 70: Within industrials, several investm
- Page 71 and 72: Cumulative Performance Information
- Page 73 and 74: Portfolio of Investments (continued
- Page 75 and 76: Shares Security ValueHealth Care—
- Page 77 and 78: Shares orPrincipalAmount Security V
- Page 79 and 80: PrincipalAmount Security ValueFinan
- Page 81 and 82: PrincipalAmount Security ValueMedia
- Page 83 and 84: PrincipalAmount Security ValueFredd
- Page 85 and 86: Accounting Standards Codification (
- Page 87 and 88: On a relative basis the Fund outper
- Page 89 and 90: Cumulative Performance Information
- Page 91 and 92: Portfolio of Investments (continued
- Page 93 and 94: Shares Security ValueFinancials (co
- Page 95 and 96: Shares orPrincipalAmount Security V
- Page 97 and 98: Portfolio Manager’s LetterGROWTH
- Page 99 and 100:
Fund Expenses (unaudited)GROWTH & I
- Page 101 and 102:
* Average Annual Total Return figur
- Page 103 and 104:
Shares Security ValueEnergy—10.0%
- Page 105 and 106:
Shares Security ValueIndustrials (c
- Page 107 and 108:
Accounting Standards Codification (
- Page 109 and 110:
France-based global insurance and i
- Page 111 and 112:
Cumulative Performance Information
- Page 113 and 114:
Portfolio of Investments (continued
- Page 115 and 116:
Shares Security ValueJapan—10.9%9
- Page 117 and 118:
Shares Security ValueItaly—2.8%14
- Page 119 and 120:
Shares orPrincipalAmount Security V
- Page 121 and 122:
Level 1 Level 2 Level 3 TotalCommon
- Page 123 and 124:
We continue to believe our focus on
- Page 125 and 126:
Cumulative Performance Information
- Page 127 and 128:
Portfolio of Investments (continued
- Page 129 and 130:
Accounting Standards Codification (
- Page 131 and 132:
Elsewhere in the consumer staples s
- Page 133 and 134:
Cumulative Performance Information
- Page 135 and 136:
Portfolio of Investments (continued
- Page 137 and 138:
Shares Security ValueHealth Care (c
- Page 139 and 140:
PrincipalAmount Security ValueSHORT
- Page 141 and 142:
Portfolio Manager’s LetterSPECIAL
- Page 143 and 144:
Fund Expenses (unaudited)SPECIAL SI
- Page 145 and 146:
* Average Annual Total Return fi gu
- Page 147 and 148:
Shares Security ValueEnergy (contin
- Page 149 and 150:
Shares orPrincipalAmount Security V
- Page 151 and 152:
Portfolio Manager’s LetterINTERNA
- Page 153 and 154:
Fund Expenses (unaudited)INTERNATIO
- Page 155 and 156:
initial $10,000 investment in the F
- Page 157 and 158:
Shares Security ValueUnited States
- Page 159 and 160:
Accounting Standards Codification (
- Page 161 and 162:
This page left intentionally blank.
- Page 163 and 164:
INVESTMENTGRADESTRATEGICINCOMEINTER
- Page 165 and 166:
INVESTMENTGRADESTRATEGICINCOMEINTER
- Page 167 and 168:
EQUITYINCOMEGROWTH &INCOMEGLOBAL$ 3
- Page 169 and 170:
EQUITYINCOMEGROWTH &INCOMEGLOBAL$ 4
- Page 171 and 172:
OPPORTUNITYSPECIALSITUATIONSINTERNA
- Page 173 and 174:
OPPORTUNITYSPECIALSITUATIONSINTERNA
- Page 175 and 176:
INVESTMENTGRADESTRATEGICINCOME*INTE
- Page 177 and 178:
EQUITYINCOMEGROWTH &INCOMEGLOBAL$ 1
- Page 179 and 180:
OPPORTUNITYSPECIALSITUATIONSINTERNA
- Page 181 and 182:
GOVERNMENTINVESTMENT GRADESTRATEGIC
- Page 183 and 184:
GOVERNMENTINVESTMENT GRADESTRATEGIC
- Page 185 and 186:
FUND FORINCOME2013 2012$ 33,007,680
- Page 187 and 188:
FUND FORINCOME2013 201241,692,426 3
- Page 189 and 190:
EQUITY INCOME GROWTH & INCOME GLOBA
- Page 191 and 192:
EQUITY INCOME GROWTH & INCOME GLOBA
- Page 193 and 194:
OPPORTUNITY SPECIAL SITUATIONS INTE
- Page 195 and 196:
OPPORTUNITY SPECIAL SITUATIONS INTE
- Page 197 and 198:
A. Security Valuation—Except as p
- Page 199 and 200:
The aggregate value by input level,
- Page 201 and 202:
International Opportunities Bond Fu
- Page 203 and 204:
The Strategic Income Fund may inves
- Page 205 and 206:
net assets over $1.5 billion. For t
- Page 207 and 208:
investment subadviser to Global Fun
- Page 209 and 210:
For the year ended September 30, 20
- Page 211 and 212:
8. Capital—The Trusts are authori
- Page 213 and 214:
* Other accumulated losses consist
- Page 215 and 216:
with the Bondholder Plaintiffs and
- Page 217 and 218:
TotalReturn*Net AssetsEnd of Year(i
- Page 219 and 220:
TotalReturn*Net AssetsEnd of Year(i
- Page 221 and 222:
R A T I O S / S U P P L E M E N T A
- Page 223 and 224:
TotalReturn*Net AssetsEnd of Year(i
- Page 225 and 226:
Net AssetValue,End ofYearTotalRetur
- Page 227 and 228:
TotalReturn*Net AssetsEnd of Year(i
- Page 229 and 230:
TotalReturn*Net AssetsEnd of Year(i
- Page 231 and 232:
In our opinion, the financial state
- Page 233 and 234:
Management Fund. In addition, at th
- Page 235 and 236:
complex and that, unlike many other
- Page 237 and 238:
Based on the information considered
- Page 239 and 240:
Funds, which are discussed below. T
- Page 241 and 242:
• The cost of services to be prov
- Page 243 and 244:
collectively the “Funds”): Grow
- Page 245 and 246:
determinations with respect to the
- Page 247 and 248:
noted that FIMCO changed the portfo
- Page 249 and 250:
Profitability. The Board reviewed t
- Page 251 and 252:
Length ofTime Served Number of Othe
- Page 253 and 254:
Length ofTime Served Number of Othe
- Page 255 and 256:
A description of the policies and p
- Page 257 and 258:
NOTES255
- Page 259 and 260:
NOTES257