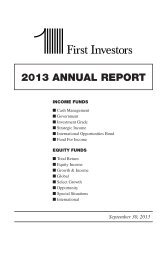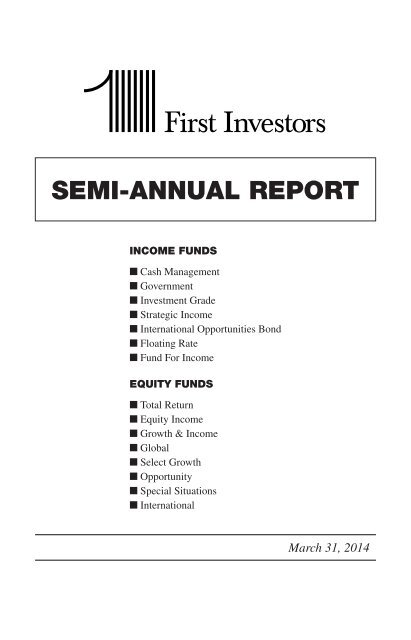
SEMI-ANNUAL REPORT - First Investors
SEMI-ANNUAL REPORT - First Investors
SEMI-ANNUAL REPORT - First Investors

You also want an ePaper? Increase the reach of your titles
YUMPU automatically turns print PDFs into web optimized ePapers that Google loves.
<strong>SEMI</strong>-<strong>ANNUAL</strong> <strong>REPORT</strong><br />
INCOME FUNDS<br />
■ Cash Management<br />
■ Government<br />
■ Investment Grade<br />
■ Strategic Income<br />
■ International Opportunities Bond<br />
■ Floating Rate<br />
■ Fund For Income<br />
EQUITY FUNDS<br />
■ Total Return<br />
■ Equity Income<br />
■ Growth & Income<br />
■ Global<br />
■ Select Growth<br />
■ Opportunity<br />
■ Special Situations<br />
■ International<br />
March 31, 2014
FOREWORD<br />
This report is for the information of the shareholders of the Funds. It is the policy of<br />
each Fund described in this report to mail only one copy of a Fund’s prospectus, annual<br />
report, semi-annual report and proxy statements to all shareholders who share the same<br />
mailing address and share the same last name and have invested in a Fund covered by<br />
the same document. You are deemed to consent to this policy unless you specifically<br />
revoke this policy and request that separate copies of such documents be mailed to you.<br />
In such case, you will begin to receive your own copies within 30 days after our receipt<br />
of the revocation. You may request that separate copies of these disclosure documents<br />
be mailed to you by writing to us at: Administrative Data Management Corp., Raritan<br />
Plaza I, Edison, NJ 08837-3620 or calling us at 1-800-423-4026.<br />
You may obtain a free prospectus for any of the Funds by contacting your representative,<br />
calling 1-800-423-4026, writing to us at the following address: <strong>First</strong><br />
<strong>Investors</strong> Corporation, 40 Wall Street, New York, NY 10005, or by visiting our<br />
website at www.firstinvestors.com. You should consider the investment objectives,<br />
risks, charges and expenses of a Fund carefully before investing. The prospectus<br />
contains this and other information about the Fund, and should be read carefully<br />
before investing.<br />
An investment in a Fund is not a bank deposit and is not insured or guaranteed<br />
by the Federal Deposit Insurance Corporation (FDIC) or any other government<br />
agency. Although the Cash Management Fund seeks to preserve a net asset value<br />
at $1.00 per share, it is possible to lose money by investing in it, just as it is possible<br />
to lose money by investing in any of the other Funds. Past performance is no<br />
guarantee of future results.<br />
A Statement of Additional Information (“SAI”) for any of the Funds may also be<br />
obtained, without charge, upon request by calling 1-800-423-4026, writing to us at<br />
our address or by visiting our website listed above. The SAI contains more detailed<br />
information about the Funds, including information about its Trustees.
Market Overview<br />
FIRST INVESTORS INCOME FUNDS<br />
FIRST INVESTORS EQUITY FUNDS<br />
Dear Investor:<br />
We are pleased to provide you with our report for the six-month period ended<br />
March 31, 2014. During the period, the U.S. economy continued to recover, although<br />
in fits and starts. Growth in the fourth quarter of 2013 was 2.6%, falling to a meager<br />
0.1% in the first quarter of 2014 – which some economists blamed on inclement winter<br />
weather throughout much of the U.S. Meanwhile, the unemployment rate fell to<br />
6.7% by March 2014, its lowest rate since October 2008.<br />
Inflation remained low, with the consumer-price index staying at or below 1.5%.<br />
Consumer spending slowed over the six-month period, only to rebound to a fourand-a-half<br />
year record gain of 0.9% by March. The gradual pullback of the Federal<br />
Reserve’s (the “Fed’s”) stimulus program, which is expected to end by late 2014, and<br />
concerns over rate hikes in 2015 tempered financial markets in the first few months of<br />
the year.<br />
Equity Markets<br />
Equities posted positive results during the reporting period. Stocks ended 2013 with a<br />
strong rally in the calendar fourth quarter, capping a spectacular year, as the S&P 500<br />
Index concluded with a 32.4% gain on a total return basis. The first half of the reporting<br />
period (4Q -2013) ended with gains of 10.5%, as strong corporate profit growth<br />
and positive economic news lifted the equity markets. As 2014 began, the equity<br />
markets took a brief pause, and after losing 5.7% between January 15 and February 3<br />
of this year, the markets recovered during the balance of February and March, ending<br />
the first quarter of the year in positive territory. The S&P 500 ended the second half<br />
of the reporting period with a gain of 1.8% and most of the market averages wound<br />
up being positive as well, despite the fact that there was definitely more volatility<br />
within this portion of the reporting period. Overall markets were up 12.5% for the<br />
six month period.<br />
Three basic factors impacted the markets’ slower performance during the last three<br />
months of the reporting period, beginning with very cold and stormy weather in the<br />
U.S., which dampened economic activity, affecting housing, industrial and transportation<br />
stocks, all of which had a harder time until temperatures started climbing in<br />
March. Secondly, the move of Russia’s military into Crimea in the Ukraine caused<br />
increased global volatility, mainly impacting Russian markets, which traded off and<br />
created a temporary cascading effect around the globe. Thirdly, China’s slowing<br />
economic situation – from low double digit growth to the high single digits – also<br />
had a ripple effect in the global marketplace. This was mainly due to tighter lending<br />
practices, more regulation and a crackdown on corruption coming from China’s new<br />
leadership in the wake of a housing bubble, all of which has put downward pressure<br />
on growth.<br />
1
Market Overview (continued)<br />
FIRST INVESTORS INCOME FUNDS<br />
FIRST INVESTORS EQUITY FUNDS<br />
The overall U.S. economy grew a little more than 2% during this period. All sectors<br />
within equities posted positive results for the six months. Among sectors, the prolonged<br />
cold weather most impacted consumer spending, which affected consumer<br />
discretionary stocks (retail, wholesale, apparel, travel & leisure) which were weaker<br />
on a relative basis during the period; consumer staples were also poorer performers,<br />
while energy, telecom and utilities stocks also lagged. On the positive side, healthcare<br />
and technology stocks were very strong. Other sectors posted more modest gains,<br />
including materials, industrials and financials.<br />
Bond Markets<br />
Benchmark U.S. Treasury rates moved slightly higher during the review period. The<br />
first half of the review period saw the continuation of an increase in interest rates that<br />
had begun in May as the market grappled with the beginning of the end of the Fed’s<br />
very accommodative monetary policy. Treasury yields ended the year at their highest<br />
level since mid-2011. The second half of the review period saw a reversal of the bond<br />
market’s sell-off as the severe winter depressed economic activity, there was slowed<br />
growth in China, and the confrontation in the Ukraine led to a flight-to-safety into U.S.<br />
Treasury securities. For the review period, the 10-year Treasury yield increased from<br />
2.6% to 2.7%. The 2-year Treasury yield, which is anchored by the Fed’s commitment<br />
to keep short-term rates very low, moved from 0.3% to 0.4%.<br />
The broad bond market gained 1.7% during the reporting period, according to the<br />
Bank of America Merrill Lynch U.S. Broad Market Index. Riskier sectors had the best<br />
returns, benefiting from their higher yields and a tightening of spreads versus Treasury<br />
securities. Specifically, high yield bonds gained 6.6%, followed by investment grade<br />
corporate bonds at 4.0%. Non-U.S. government bonds had a relatively strong return of<br />
1.8%. Mortgage-backed bonds were negatively affected by the tapering of the Fed’s<br />
quantitative easing program (a program which has involved large-scale purchases of<br />
bonds to depress interest rates), returning 1.1%. Reflecting the impact of higher interest<br />
rates, the Treasury sector lagged the broad bond market with a 0.7% return. Lastly,<br />
money market rates remained close to zero as the Fed maintained its commitment to<br />
keep short-term interest rates at an exceptionally low level.<br />
2
Thank you for placing your trust in <strong>First</strong> <strong>Investors</strong>. As always, we appreciate the<br />
opportunity to serve your investment needs.<br />
Sincerely,<br />
Edwin D. Miska<br />
Director of Equities<br />
<strong>First</strong> <strong>Investors</strong> Management<br />
Company, Inc.<br />
April 30, 2014<br />
Clark D. Wagner<br />
Director of Fixed Income<br />
<strong>First</strong> <strong>Investors</strong> Management<br />
Company, Inc.<br />
This Market Overview is not part of the Funds’ financial report and is submitted for<br />
the general information of the shareholders of the Funds. It is not authorized for distribution<br />
to prospective investors in the Funds, unless preceded or accompanied by an<br />
effective prospectus. The Market Overview reflects conditions through the end of the<br />
period as stated on the cover. Market conditions are subject to change. This Market<br />
Overview may not be relied upon as investment advice or as an indication of current<br />
or future trading intent on behalf of any Fund.<br />
There are a variety of risks associated with investing in mutual funds. For stock funds,<br />
the risks include market risk (the risk that the entire stock market will decline because<br />
of an event such as deterioration in the economy or a rise in interest rates), as well as<br />
special risks associated with investing in certain types of stock funds, such as smallcap,<br />
global and international funds. For bond funds, the risks include interest rate<br />
risk and credit risk. Interest rate risk is the risk that bonds will decrease in value as<br />
interest rates rise. The historically low interest rate environment increases the risks<br />
associated with a rise in interest rates, including the potential for periods of volatility<br />
and increased redemptions. As a general matter, longer-term bonds fluctuate more<br />
than shorter-term bonds in reaction to changes in interest rates. Credit risk is the risk<br />
that bonds will decline in value as the result of a decline in the credit rating of the<br />
bonds or the economy as a whole, or that the issuer will be unable to pay interest and/<br />
or principal when due. You should consult your prospectus for a precise explanation<br />
of the risks associated with your Fund.<br />
3
Understanding Your Fund’s Expenses (unaudited)<br />
FIRST INVESTORS INCOME FUNDS<br />
FIRST INVESTORS EQUITY FUNDS<br />
As a mutual fund shareholder, you incur two types of costs: (1) transaction costs, including<br />
a sales charge (load) on purchase payments (on Class A shares only) and a contingent<br />
deferred sales charge on redemptions (on Class B shares only); and (2) ongoing costs,<br />
including advisory fees; distribution and service fees (12b-1); and other expenses. This example<br />
is intended to help you understand your ongoing costs (in dollars) of investing in the<br />
Funds and to compare these costs with the ongoing costs of investing in other mutual funds.<br />
The examples are based on an investment of $1,000 in each Fund at the beginning of the<br />
period, October 1, 2013, and held for the entire six-month period ended March 31, 2014.<br />
The calculations assume that no shares were bought or sold during the period. Your actual<br />
costs may have been higher or lower, depending on the amount of your investment and the<br />
timing of any purchases or redemptions.<br />
Actual Expenses Example:<br />
These amounts help you to estimate the actual expenses that you paid over the period. The<br />
“Ending Account Value” shown is derived from the Fund’s actual return, and the “Expenses<br />
Paid During Period” shows the dollar amount that would have been paid by an investor<br />
who started with $1,000 in the Fund. You may use the information here, together with the<br />
amount you invested, to estimate the expenses that you paid over the period.<br />
To estimate the expenses you paid on your account during this period, simply divide<br />
your ending account value by $1,000 (for example, an $8,600 account value divided by<br />
$1,000 = 8.60), then multiply the result by the number given for your Fund under the<br />
heading “Expenses Paid During Period”.<br />
Hypothetical Expenses Example:<br />
These amounts provide information about hypothetical account values and hypothetical<br />
expenses based on the Fund’s actual expense ratio for each class of shares of a Fund,<br />
and an assumed rate of return of 5% per year before expenses, which is not the Fund’s<br />
actual return. The hypothetical account values and expenses may not be used to estimate<br />
the actual ending account balance or expenses you paid for the period. You may use this<br />
information to compare the ongoing costs of investing in the Fund and other funds. To do<br />
so, compare this 5% hypothetical example with the 5% hypothetical examples that appear<br />
in the shareholder reports of the other funds.<br />
Please note that the expenses shown in the table are meant to highlight and help you compare<br />
your ongoing costs only and do not reflect any transaction costs, such as front-end or<br />
contingent deferred sales charges (loads or account fees that are charged to certain types of<br />
accounts, such as an annual custodial fee of $15 for certain IRA accounts and certain other<br />
retirement accounts or an annual custodial fee of $30 for 403(b) custodial accounts (subject<br />
to exceptions and certain waivers as described in the Funds’ Statement of Additional<br />
Information). Therefore, the hypothetical expenses example is useful in comparing ongoing<br />
costs only and will not help you determine the relative total costs of owning different<br />
funds. In addition, if these costs were included, your costs would have been higher.<br />
4
Fund Expenses (unaudited)<br />
CASH MANAGEMENT FUND<br />
The examples below show the ongoing costs (in dollars) of investing in your Fund and will<br />
help you in comparing these costs with costs of other mutual funds. Please refer to page 4 for a<br />
detailed explanation of the information presented in these examples.<br />
Expense Example<br />
Annualized<br />
Expense<br />
Ratio<br />
Beginning<br />
Account Value<br />
(10/1/13)<br />
Ending<br />
Account Value<br />
(3/31/14)<br />
Expenses Paid<br />
During Period<br />
(10/1/13–3/31/14)*<br />
Class A Shares 0.08%<br />
Actual $1,000.00 $1,000.00 $0.40<br />
Hypothetical** $1,000.00 $1,024.53 $0.40<br />
Class B Shares 0.08%<br />
Actual $1,000.00 $1,000.00 $0.40<br />
Hypothetical** $1,000.00 $1,024.53 $0.40<br />
Institutional Class Shares 0.08%<br />
Actual $1,000.00 $1,000.00 $0.40<br />
Hypothetical** $1,000.00 $1,024.53 $0.40<br />
* Expenses are equal to the annualized expense ratio, multiplied by the average account value over<br />
the period, multiplied by 182/365 (to reflect the one-half year period). Expenses paid during the<br />
period are net of expenses waived and/or assumed.<br />
**Assumed rate of return of 5% before expenses.<br />
Portfolio Composition<br />
BY SECTOR<br />
U.S. Government Agency<br />
Obligations<br />
64.3%<br />
Corporate Notes<br />
22.5%<br />
Variable and Floating<br />
Rate Notes<br />
8.2%<br />
Short-Term U.S.<br />
Government Obligations<br />
5.0%<br />
Portfolio holdings and allocations are subject to change. Percentages are as of March 31, 2014, and<br />
are based on the total market value of investments.<br />
5
Portfolio of Investments (continued)<br />
CASH MANAGEMENT FUND<br />
March 31, 2014<br />
Principal<br />
Amount<br />
Security<br />
Interest<br />
Rate*<br />
Value<br />
U.S. GOVERNMENT AGENCY<br />
OBLIGATIONS—64.1%<br />
Federal Home Loan Bank:<br />
$ 1,405 M 4/2/2014 0.09% $ 1,404,996<br />
7,300 M 4/4/2014 0.11 7,299,933<br />
4,000 M 4/9/2014 0.06 3,999,951<br />
2,270 M 4/9/2014 0.07 2,269,965<br />
3,000 M 4/23/2014 0.06 2,999,890<br />
5,000 M 4/25/2014 0.05 4,999,833<br />
6,000 M 4/30/2014 0.07 5,999,686<br />
2,700 M 5/2/2014 0.08 2,699,826<br />
5,000 M 5/9/2014 0.06 4,999,710<br />
3,100 M 5/14/2014 0.05 3,099,815<br />
4,000 M 5/14/2014 0.06 3,999,713<br />
2,200 M 5/21/2014 0.07 2,199,786<br />
5,000 M 5/21/2014 0.12 4,999,201<br />
3,100 M 5/23/2014 0.12 3,099,485<br />
1,000 M 5/28/2014 0.06 999,905<br />
3,150 M 5/30/2014 0.07 3,149,639<br />
1,250 M 5/30/2014 0.10 1,249,801<br />
2,700 M 6/6/2014 0.08 2,699,629<br />
2,894 M 6/6/2014 0.11 2,893,416<br />
3,200 M 6/6/2014 0.12 3,199,296<br />
2,446 M 6/13/2014 0.08 2,445,628<br />
4,000 M 6/13/2014 0.09 3,999,270<br />
1,261 M 6/18/2014 0.08 1,260,795<br />
2,000 M 7/9/2014 0.10 1,999,450<br />
1,200 M 8/6/2014 0.09 1,199,640<br />
Freddie Mac:<br />
4,000 M 5/9/2014 0.07 3,999,704<br />
5,000 M 6/17/2014 0.06 4,999,358<br />
2,240 M 7/11/2014 0.10 2,239,371<br />
Total Value of U.S. Government Agency Obligations (cost $90,406,692) 90,406,692<br />
CORPORATE NOTES—22.4%<br />
Coca-Cola Co.:<br />
1,500 M 6/19/2014 (a) 0.10 1,499,671<br />
1,650 M 6/24/2014 (a) 0.10 1,649,615<br />
3,000 M 8/19/2014 (a) 0.17 2,998,016<br />
6,000 M Honeywell International, Inc., 5/19/2014 (a) 0.10 5,999,200<br />
5,000 M McDonald’s Corp., 6/25/2014 (a) 0.09 4,998,938<br />
6
Principal<br />
Amount<br />
Security<br />
Interest<br />
Rate*<br />
Value<br />
CORPORATE NOTES (continued)<br />
$ 4,000 M Pfizer, Inc., 5/29/2014 (a) 0.07 $ 3,999,549<br />
5,000 M Procter & Gamble Co., 6/11/2014 (a) 0.10 4,999,014<br />
5,500 M Wal-Mart Stores, Inc., 5/12/2014 (a) 0.08 5,499,499<br />
Total Value of Corporate Notes (cost $31,643,502) 31,643,502<br />
VARIABLE AND FLOATING RATE NOTES—8.2%<br />
5,700 M Mississippi Business Finance Corp.<br />
(Chevron USA, Inc.), 12/1/2030 0.07 5,700,000<br />
5,835 M Valdez, Alaska Marine Terminal Rev.<br />
(Exxon Pipeline Co., Project B), 12/1/2033 0.07 5,835,000<br />
Total Value of Variable and Floating Rate Notes (cost $11,535,000) 11,535,000<br />
SHORT-TERM U.S. GOVERNMENT<br />
OBLIGATIONS—5.0%<br />
7,000 M U.S. Treasury Bills, 6/12/2014 (cost $6,999,300) 0.05 6,999,300<br />
Total Value of Investments (cost $140,584,494)** 99.7% 140,584,494<br />
Other Assets, Less Liabilities .3 384,757<br />
Net Assets 100.0% $140,969,251<br />
* The interest rates shown are the effective rates at the time of purchase by the Fund. The interest<br />
rates shown on floating rate notes are adjusted periodically; the rates shown are the rates in effect<br />
at March 31, 2014.<br />
** Aggregate cost for federal income tax purposes is the same.<br />
(a) Security exempt from registration under Section 4(2) of the Securities Act of 1933 (see Note 4).<br />
7
Portfolio of Investments (continued)<br />
CASH MANAGEMENT FUND<br />
March 31, 2014<br />
Accounting Standards Codification 820 established a three-tier hierarchy of inputs to establish a<br />
classification of fair value measurements for disclosure purposes. The three-tier hierarchy of inputs<br />
is summarized in the three broad Levels listed below:<br />
Level 1 — Unadjusted quoted prices in active markets for identical securities that the Fund has<br />
the ability to access.<br />
Level 2 — Observable inputs other than quoted prices included in Level 1 that are observable<br />
for the asset or liability, either directly or indirectly. These inputs may include quoted<br />
prices for the identical instrument on an inactive market, prices for similar instruments,<br />
interest rates, prepayment speeds, credit risk, yield curves, default rates and<br />
similar data.<br />
Level 3 — Unobservable inputs for the asset or liability, to the extent relevant observable inputs<br />
are not available, representing the Fund’s own assumption about the assumptions a<br />
market participant would use in valuing the asset or liability, and would be based on<br />
the best information available.<br />
The inputs methodology used for valuing securities are not necessarily an indication of the risk<br />
associated with investing in those securities. For example, amortized cost approximates the current<br />
fair value of a security, but since the value is not obtained from a quoted price in an active market,<br />
such securities are reflected as Level 2.<br />
The following is a summary, by category of Level, of inputs used to value the Fund’s investments as of<br />
March 31, 2014:<br />
Level 1 Level 2 Level 3 Total<br />
U.S. Government Agency<br />
Obligations. . . . . . . . . . . . . . . . $ — $ 90,406,692 $ — $ 90,406,692<br />
Corporate Notes . . . . . . . . . . . . . . — 31,643,502 — 31,643,502<br />
Variable and Floating Rate Notes:<br />
Municipal Bonds . . . . . . . . . . . — 11,535,000 — 11,535,000<br />
Short-Term U.S. Government<br />
Obligations. . . . . . . . . . . . . . . . — 6,999,300 — 6,999,300<br />
Total Investments in Securities . . . $ — $ 140,584,494 $ — $ 140,584,494<br />
There were no transfers into or from Level 1 and Level 2 by the Fund during the period ended<br />
March 31, 2014. Transfers, if any, between Levels are recognized at the end of the reporting period.<br />
8<br />
See notes to financial statements
Fund Expenses (unaudited)<br />
GOVERNMENT FUND<br />
The examples below show the ongoing costs (in dollars) of investing in your Fund and will<br />
help you in comparing these costs with costs of other mutual funds. Please refer to page 4 for a<br />
detailed explanation of the information presented in these examples.<br />
Expense Example<br />
Annualized<br />
Expense<br />
Ratio<br />
Beginning<br />
Account Value<br />
(10/1/13)<br />
Ending<br />
Account Value<br />
(3/31/14)<br />
Expenses Paid<br />
During Period<br />
(10/1/13–3/31/14)*<br />
Class A Shares 1.07%<br />
Actual $1,000.00 $1,004.77 $5.35<br />
Hypothetical** $1,000.00 $1,019.59 $5.39<br />
Class B Shares 1.89%<br />
Actual $1,000.00 $1,000.26 $9.43<br />
Hypothetical** $1,000.00 $1,015.51 $9.50<br />
Advisor Class Shares 0.84%<br />
Actual $1,000.00 $1,003.47 $4.20<br />
Hypothetical** $1,000.00 $1,020.74 $4.23<br />
Institutional Class Shares 0.64%<br />
Actual $1,000.00 $1,006.14 $3.20<br />
Hypothetical** $1,000.00 $1,021.74 $3.23<br />
* Expenses are equal to the annualized expense ratio, multiplied by the average account value over<br />
the period, multiplied by 182/365 (to reflect the one-half year period). Expenses paid during the<br />
period are net of expenses waived.<br />
**Assumed rate of return of 5% before expenses.<br />
Portfolio Composition<br />
BY SECTOR<br />
Fannie Mae<br />
46.5%<br />
Government National<br />
Mortgage Association I<br />
Program<br />
33.6%<br />
Freddie Mac<br />
5.7%<br />
U.S. Government<br />
Obligations<br />
Federal Farm Credit<br />
Bank<br />
Federal Home Loan<br />
Mortgage Corporation<br />
1.9%<br />
1.4%<br />
4.5%<br />
Corporate Bonds<br />
1.1%<br />
Portfolio holdings and allocations are subject to change. Percentages are as of March 31, 2014, and<br />
are based on the total market value of investments.<br />
9
Portfolio of Investments (continued)<br />
GOVERNMENT FUND<br />
March 31, 2014<br />
Principal<br />
Amount Security Value<br />
RESIDENTIAL MORTGAGE-BACKED<br />
SECURITIES—67.7%<br />
Fannie Mae—30.0%<br />
$ 6,682 M 2.5%, 9/1/2023 – 11/1/2023 $ 6,855,330<br />
13,546 M 3%, 8/1/2022 – 7/1/2023 14,075,895<br />
16,116 M 3.5%, 10/1/2025 – 5/1/2033 16,799,435<br />
42,959 M 4%, 8/1/2026 – 10/1/2041 (a) 45,394,770<br />
11,542 M 4.5%, 11/1/2040 – 1/1/2042 12,431,215<br />
7,734 M 5%, 8/1/2039 – 4/1/2040 8,464,661<br />
3,855 M 5.5%, 7/1/2033 – 10/1/2039 4,286,248<br />
108,307,554<br />
Freddie Mac—3.1%<br />
2,217 M 3.5%, 9/1/2032 2,316,170<br />
6,005 M 4%, 11/1/2040 6,320,858<br />
2,199 M 5%, 8/1/2039 2,428,517<br />
11,065,545<br />
Government National Mortgage Association I<br />
Program—34.6%<br />
7,031 M 4%, 11/15/2025 – 6/15/2042 7,505,717<br />
22,053 M 4.5%, 9/15/2033 – 6/15/2040 23,943,854<br />
36,451 M 5%, 6/15/2033 – 5/15/2040 40,252,372<br />
22,679 M 5.5%, 3/15/2033 – 10/15/2039 25,464,068<br />
20,207 M 6%, 3/15/2031 – 5/15/2040 22,945,926<br />
1,766 M 6.5%, 6/15/2034 – 3/15/2038 1,993,351<br />
2,206 M 7%, 6/15/2023 – 4/15/2034 2,443,121<br />
124,548,409<br />
Total Value of Residential Mortgage-Backed Securities (cost $238,099,251) 243,921,508<br />
U.S. GOVERNMENT AGENCY<br />
OBLIGATIONS—15.8%<br />
Fannie Mae:<br />
21,000 M 1.875%, 9/18/2018 21,229,719<br />
23,250 M 1.625%, 11/27/2018 23,181,064<br />
7,000 M Federal Farm Credit Bank, 2.79%, 11/12/2020 7,051,646<br />
5,000 M Freddie Mac, 3.75%, 3/27/2019 5,460,005<br />
Total Value of U.S. Government Agency Obligations (cost $56,870,434) 56,922,434<br />
10
Principal<br />
Amount Security Value<br />
COMMERCIAL MORTGAGE-BACKED<br />
SECURITIES—4.8%<br />
Fannie Mae—3.4%<br />
$ 2,938 M 2.27%, 1/1/2023 $ 2,796,540<br />
1,300 M 2.96%, 11/1/2018 1,366,568<br />
2,973 M 3.76%, 4/1/2018 3,206,243<br />
4,500 M 3.84%, 5/1/2018 4,872,056<br />
12,241,407<br />
Federal Home Loan Mortgage Corporation—1.4%<br />
5,000 M Multi Family Structured Pass Through 2.13%, 1/25/2019 5,030,715<br />
Total Value of Commercial Mortgage-Backed Securities (cost $17,629,525) 17,272,122<br />
U.S. GOVERNMENT OBLIGATIONS—4.7%<br />
U.S. Treasury Notes:<br />
8,000 M 1.5%, 12/31/2018 7,940,312<br />
9,000 M 1.25%, 1/31/2019 8,818,596<br />
Total Value of U.S. Government Obligations (cost $16,823,893) 16,758,908<br />
COLLATERALIZED MORTGAGE<br />
OBLIGATIONS—3.4%<br />
Fannie Mae—2.1%<br />
7,603 M 3%, 2/25/2024 7,775,766<br />
Freddie Mac—1.3%<br />
4,442 M 3%, 8/15/2039 4,641,030<br />
Total Value of Collateralized Mortgage Obligations (cost $12,747,373) 12,416,796<br />
CORPORATE BONDS—1.1%<br />
Financials<br />
4,121 M Excalibur One 77B, LLC, 1.492%, 1/1/2025 (cost $4,101,276) 3,905,324<br />
SHORT-TERM U.S. GOVERNMENT<br />
OBLIGATIONS—5.5%<br />
20,000 M U.S. Treasury Bills, 0.055%, 4/17/2014 (cost $19,999,511) 19,999,511<br />
Total Value of Investments (cost $366,271,263) 103.0% 371,196,603<br />
Excess of Liabilities Over Other Assets (3.0) (10,817,360)<br />
Net Assets 100.0% $360,379,243<br />
(a) A portion or all of the security purchased on a when-issued or delayed delivery basis<br />
(see Note 1G).<br />
11
Portfolio of Investments (continued)<br />
GOVERNMENT FUND<br />
March 31, 2014<br />
Accounting Standards Codification 820 established a three-tier hierarchy of inputs to establish a<br />
classification of fair value measurements for disclosure purposes. The three-tier hierarchy of inputs is<br />
summarized in the three broad Levels listed below:<br />
Level 1 — Unadjusted quoted prices in active markets for identical securities that the Fund has<br />
the ability to access.<br />
Level 2 — Observable inputs other than quoted prices included in Level 1 that are observable<br />
for the asset or liability, either directly or indirectly. These inputs may include quoted<br />
prices for the identical instrument on an inactive market, prices for similar instruments,<br />
interest rates, prepayment speeds, credit risk, yield curves, default rates and<br />
similar data.<br />
Level 3 — Unobservable inputs for the asset or liability, to the extent relevant observable inputs<br />
are not available, representing the Fund’s own assumption about the assumptions a<br />
market participant would use in valuing the asset or liability, and would be based on<br />
the best information available.<br />
The inputs methodology used for valuing securities are not necessarily an indication of the risk<br />
associated with investing in those securities. For example, amortized cost approximates the current<br />
fair value of a security, but since the value is not obtained from a quoted price in an active market,<br />
such securities are reflected as Level 2.<br />
The following is a summary, by category of Level, of inputs used to value the Fund’s investments as of<br />
March 31, 2014:<br />
Level 1 Level 2 Level 3 Total<br />
Residential Mortgage-Backed<br />
Securities . . . . . . . . . . . . . . . . . $ — $ 243,921,508 $ — $ 243,921,508<br />
U.S. Government Agency<br />
Obligations. . . . . . . . . . . . . . . . — 56,922,434 — 56,922,434<br />
Commercial Mortgage-Backed<br />
Securities . . . . . . . . . . . . . . . . . — 17,272,122 — 17,272,122<br />
U.S. Government Obligations . . . — 16,758,908 — 16,758,908<br />
Collateralized Mortgage<br />
Obligations. . . . . . . . . . . . . . . . — 12,416,796 — 12,416,796<br />
Corporate Bonds . . . . . . . . . . . . . — 3,905,324 — 3,905,324<br />
Short-Term U.S. Government<br />
Obligations. . . . . . . . . . . . . . . . — 19,999,511 — 19,999,511<br />
Total Investments in Securities . . . $ — $ 371,196,603 $ — $ 371,196,603<br />
There were no transfers into or from Level 1 and Level 2 by the Fund during the period ended<br />
March 31, 2014. Transfers, if any, between Levels are recognized at the end of the reporting period.<br />
12<br />
See notes to financial statements
Fund Expenses (unaudited)<br />
INVESTMENT GRADE FUND<br />
The examples below show the ongoing costs (in dollars) of investing in your Fund and will<br />
help you in comparing these costs with costs of other mutual funds. Please refer to page 4 for a<br />
detailed explanation of the information presented in these examples.<br />
Expense Example<br />
Annualized<br />
Expense<br />
Ratio<br />
Beginning<br />
Account Value<br />
(10/1/13)<br />
Ending<br />
Account Value<br />
(3/31/14)<br />
Expenses Paid<br />
During Period<br />
(10/1/13–3/31/14)*<br />
Class A Shares 1.05%<br />
Actual $1,000.00 $1,032.43 $5.32<br />
Hypothetical** $1,000.00 $1,019.69 $5.29<br />
Class B Shares 1.93%<br />
Actual $1,000.00 $1,027.14 $9.75<br />
Hypothetical** $1,000.00 $1,015.31 $9.70<br />
Advisor Class Shares 0.83%<br />
Actual $1,000.00 $1,031.91 $4.20<br />
Hypothetical** $1,000.00 $1,020.79 $4.18<br />
Institutional Class Shares 0.63%<br />
Actual $1,000.00 $1,034.28 $3.20<br />
Hypothetical** $1,000.00 $1,021.79 $3.18<br />
* Expenses are equal to the annualized expense ratio, multiplied by the average account value over<br />
the period, multiplied by 182/365 (to reflect the one-half year period). Expenses paid during the<br />
period are net of expenses waived.<br />
**Assumed rate of return of 5% before expenses.<br />
Portfolio Composition<br />
BY SECTOR<br />
Financials<br />
44.5%<br />
Consumer Staples<br />
Materials<br />
Energy<br />
10.2%<br />
10.0%<br />
12.3%<br />
Industrials<br />
Utilities<br />
Health Care<br />
Consumer Discretionary<br />
Information Technology<br />
Telecommunication<br />
Services<br />
6.1%<br />
4.9%<br />
4.5%<br />
4.4%<br />
2.6%<br />
0.5%<br />
Portfolio holdings and allocations are subject to change. Percentages are as of March 31, 2014, and<br />
are based on the total market value of investments.<br />
13
Portfolio of Investments (continued)<br />
INVESTMENT GRADE FUND<br />
March 31, 2014<br />
14<br />
Principal<br />
Amount Security Value<br />
CORPORATE BONDS—96.4%<br />
Aerospace/Defense—.3%<br />
$ 1,800 M BAE Systems Holdings, Inc., 4.95%, 6/1/2014 (a) $ 1,812,321<br />
Agriculture—.6%<br />
2,725 M Cargill, Inc., 6%, 11/27/2017 (a) 3,116,700<br />
Automotive—2.1%<br />
2,000 M Daimler Finance NA, LLC, 2.95%, 1/11/2017 (a) 2,085,432<br />
4,000 M General Motors Co., 3.5%, 10/2/2018 (a) 4,095,000<br />
5,000 M Johnson Controls, Inc., 5%, 3/30/2020 5,557,265<br />
11,737,697<br />
Chemicals—2.8%<br />
5,000 M CF Industries, Inc., 7.125%, 5/1/2020 5,952,290<br />
4,000 M Dow Chemical Co., 4.25%, 11/15/2020 4,243,276<br />
5,000 M LyondellBasell Industries NV, 6%, 11/15/2021 5,865,910<br />
16,061,476<br />
Consumer Durables—.4%<br />
2,300 M Newell Rubbermaid, Inc., 4.7%, 8/15/2020 2,455,328<br />
Energy—9.7%<br />
5,000 M Canadian Oil Sands, Ltd., 7.75%, 5/15/2019 (a) 6,077,090<br />
4,800 M DCP Midstream, LLC, 9.75%, 3/15/2019 (a) 6,125,746<br />
5,000 M Enbridge Energy Partners, LP, 4.2%, 9/15/2021 5,184,700<br />
5,000 M Kinder Morgan Energy Partners, LP, 3.45%, 2/15/2023 4,774,835<br />
1,646 M Maritime & Northeast Pipeline, LLC, 7.5%, 5/31/2014 (a) 1,659,578<br />
5,000 M Nabors Industries, Inc., 6.15%, 2/15/2018 5,661,270<br />
4,000 M ONEOK Partners, LP, 3.375%, 10/1/2022 3,863,612<br />
5,000 M Petrobras International Finance Co., 5.375%, 1/27/2021 5,081,605<br />
5,800 M Spectra Energy Capital, LLC, 6.2%, 4/15/2018 6,614,477<br />
4,000 M Valero Energy Corp., 9.375%, 3/15/2019 5,210,588<br />
4,000 M Weatherford International, Inc., 6.35%, 6/15/2017 4,529,444<br />
54,782,945<br />
Financial Services—16.9%<br />
2,250 M Aflac, Inc., 8.5%, 5/15/2019 2,894,956<br />
6,000 M American Express Co., 7%, 3/19/2018 7,122,714<br />
American International Group, Inc.:<br />
3,200 M 8.25%, 8/15/2018 4,007,555<br />
3,100 M 6.4%, 12/15/2020 3,698,626
Principal<br />
Amount Security Value<br />
Financial Services (continued)<br />
$ 4,000 M Ameriprise Financial, Inc., 5.3%, 3/15/2020 $ 4,542,988<br />
4,300 M Berkshire Hathaway, Inc., 3.4%, 1/31/2022 4,413,180<br />
4,000 M BlackRock, Inc., 5%, 12/10/2019 4,518,576<br />
4,000 M CoBank, ACB, 7.875%, 4/16/2018 (a) 4,793,860<br />
1,800 M Compass Bank, 6.4%, 10/1/2017 1,989,076<br />
5,750 M ERAC USA Finance Co., 4.5%, 8/16/2021 (a) 6,120,691<br />
6,200 M Ford Motor Credit Co., LLC, 8.125%, 1/15/2020 7,827,537<br />
General Electric Capital Corp.:<br />
9,400 M 5.3%, 2/11/2021 10,588,000<br />
7,000 M 6.75%, 3/15/2032 9,025,639<br />
4,000 M Glencore Funding, LLC, 6%, 4/15/2014 (a) 4,007,224<br />
Harley-Davidson Funding Corp.:<br />
2,000 M 5.75%, 12/15/2014 (a) 2,068,868<br />
1,800 M 6.8%, 6/15/2018 (a) 2,110,102<br />
4,000 M Liberty Mutual Group, Inc., 4.95%, 5/1/2022 (a) 4,288,684<br />
5,400 M Protective Life Corp., 7.375%, 10/15/2019 6,563,468<br />
4,000 M Prudential Financial, Inc., 7.375%, 6/15/2019 4,906,448<br />
95,488,192<br />
Financials—20.2%<br />
Bank of America Corp.:<br />
9,500 M 5.65%, 5/1/2018 10,749,022<br />
4,300 M 5%, 5/13/2021 4,748,524<br />
8,000 M Barclays Bank, PLC, 5.125%, 1/8/2020 8,966,840<br />
Citigroup, Inc.:<br />
10,200 M 6.125%, 11/21/2017 11,688,812<br />
2,000 M 4.5%, 1/14/2022 2,122,584<br />
Goldman Sachs Group, Inc.:<br />
6,000 M 5.375%, 3/15/2020 6,703,032<br />
1,900 M 5.75%, 1/24/2022 2,157,887<br />
3,000 M 3.625%, 1/22/2023 2,956,626<br />
5,250 M 6.75%, 10/1/2037 6,032,780<br />
JPMorgan Chase & Co.:<br />
9,200 M 6%, 1/15/2018 10,568,031<br />
4,000 M 4.5%, 1/24/2022 4,319,460<br />
Morgan Stanley:<br />
4,050 M 5.95%, 12/28/2017 4,627,105<br />
5,500 M 6.625%, 4/1/2018 6,417,411<br />
6,000 M 5.5%, 7/28/2021 6,789,570<br />
6,000 M SunTrust Banks, Inc., 6%, 9/11/2017 6,840,072<br />
4,000 M UBS AG, 4.875%, 8/4/2020 4,435,416<br />
15
Portfolio of Investments (continued)<br />
INVESTMENT GRADE FUND<br />
March 31, 2014<br />
Principal<br />
Amount Security Value<br />
Financials (continued)<br />
Wells Fargo & Co.:<br />
$ 2,700 M 3%, 1/22/2021 $ 2,705,991<br />
5,800 M 4.6%, 4/1/2021 6,393,363<br />
4,800 M 3.45%, 2/13/2023 4,667,611<br />
113,890,137<br />
Food/Beverage/Tobacco—9.7%<br />
4,000 M Altria Group, Inc., 9.7%, 11/10/2018 5,255,568<br />
5,000 M Anheuser-Busch InBev SA/NV, 4.625%, 2/1/2044 5,150,910<br />
4,000 M Anheuser-Busch InBev Worldwide, Inc., 5.375%, 1/15/2020 4,597,728<br />
3,000 M Bottling Group, LLC, 5.125%, 1/15/2019 3,388,017<br />
5,225 M Bunge Ltd. Finance Corp., 8.5%, 6/15/2019 6,454,960<br />
4,200 M Dr. Pepper Snapple Group, Inc., 6.82%, 5/1/2018 4,921,127<br />
4,165 M Ingredion, Inc., 4.625%, 11/1/2020 4,423,859<br />
4,000 M Lorillard Tobacco Co., 6.875%, 5/1/2020 4,683,896<br />
3,000 M Mead Johnson Nutrition Co., 4.9%, 11/1/2019 3,281,571<br />
4,000 M Philip Morris International, Inc., 5.65%, 5/16/2018 4,590,444<br />
SABMiller Holdings, Inc.:<br />
4,000 M 3.75%, 1/15/2022 (a) 4,095,048<br />
4,000 M 4.95%, 1/15/2042 (a) 4,204,440<br />
55,047,568<br />
Forest Products/Container—1.5%<br />
2,200 M International Paper Co., 9.375%, 5/15/2019 2,875,596<br />
5,000 M Rock-Tenn Co., 4.9%, 3/1/2022 5,355,175<br />
8,230,771<br />
Health Care—4.3%<br />
4,000 M Biogen IDEC, Inc., 6.875%, 3/1/2018 4,712,400<br />
4,050 M Express Scripts Holding Co., 4.75%, 11/15/2021 4,408,538<br />
4,000 M Laboratory Corp. of America Holdings, 3.75%, 8/23/2022 3,980,116<br />
4,000 M Mylan, Inc., 3.125%, 1/15/2023 (a) 3,797,120<br />
4,000 M Novartis Capital Corp., 4.4%, 5/6/2044 4,052,952<br />
2,400 M Novartis Securities Investments, Ltd., 5.125%, 2/10/2019 2,727,706<br />
694 M Roche Holdings, Inc., 6%, 3/1/2019 (a) 816,236<br />
24,495,068<br />
16
Principal<br />
Amount Security Value<br />
Information Technology—2.5%<br />
$ 4,000 M Harris Corp., 4.4%, 12/15/2020 $ 4,218,916<br />
5,000 M Motorola Solutions, Inc., 6%, 11/15/2017 5,719,935<br />
4,000 M Symantec Corp., 3.95%, 6/15/2022 3,972,304<br />
13,911,155<br />
Manufacturing—2.0%<br />
4,000 M CRH America, Inc., 8.125%, 7/15/2018 4,888,908<br />
1,800 M General Electric Co., 4.5%, 3/11/2044 1,835,473<br />
4,000 M Ingersoll-Rand Global Holdings Co., Ltd., 6.875%, 8/15/2018 4,705,648<br />
11,430,029<br />
Media-Broadcasting—3.2%<br />
3,950 M British Sky Broadcasting Group, PLC, 9.5%, 11/15/2018 (a) 5,130,979<br />
2,000 M CBS Corp., 8.875%, 5/15/2019 2,566,920<br />
3,250 M Comcast Corp., 4.25%, 1/15/2033 3,195,673<br />
3,000 M DirecTV Holdings, LLC, 3.8%, 3/15/2022 2,973,666<br />
4,000 M Time Warner Cable, Inc., 5%, 2/1/2020 4,373,960<br />
18,241,198<br />
Media-Diversified—.8%<br />
McGraw-Hill Financial, Inc.:<br />
1,800 M 5.9%, 11/15/2017 1,998,288<br />
2,300 M 6.55%, 11/15/2037 2,324,396<br />
4,322,684<br />
Metals/Mining—5.0%<br />
5,000 M Alcoa, Inc., 6.15%, 8/15/2020 5,455,890<br />
4,000 M ArcelorMittal, 6.125%, 6/1/2018 4,400,000<br />
4,200 M Newmont Mining Corp., 5.125%, 10/1/2019 4,472,219<br />
5,000 M Rio Tinto Finance USA, Ltd., 3.75%, 9/20/2021 5,157,965<br />
4,000 M Vale Overseas, Ltd., 5.625%, 9/15/2019 4,438,032<br />
4,000 M Xstrata Finance Canada, Ltd., 4.95%, 11/15/2021 (a) 4,141,044<br />
28,065,150<br />
17
Portfolio of Investments (continued)<br />
INVESTMENT GRADE FUND<br />
March 31, 2014<br />
18<br />
Principal<br />
Amount Security Value<br />
Real Estate Investment Trusts—5.1%<br />
$ 5,000 M Boston Properties, LP, 5.875%, 10/15/2019 $ 5,775,650<br />
4,000 M Digital Realty Trust, LP, 5.25%, 3/15/2021 4,211,532<br />
5,000 M HCP, Inc., 5.375%, 2/1/2021 5,605,995<br />
4,000 M ProLogis, LP, 6.625%, 5/15/2018 4,658,516<br />
4,000 M Simon Property Group, LP, 5.75%, 12/1/2015 4,286,944<br />
4,000 M Ventas Realty, LP, 4.75%, 6/1/2021 4,317,468<br />
28,856,105<br />
Retail-General Merchandise—1.6%<br />
6,000 M Gap, Inc., 5.95%, 4/12/2021 6,765,348<br />
2,000 M Home Depot, Inc., 5.875%, 12/16/2036 2,417,106<br />
9,182,454<br />
Telecommunications—.5%<br />
3,000 M Rogers Communications, Inc., 3%, 3/15/2023 2,823,807<br />
Transportation—2.5%<br />
4,000 M Burlington North Santa Fe, LLC, 5.15%, 9/1/2043 4,255,828<br />
3,000 M Con-way, Inc., 7.25%, 1/15/2018 3,500,982<br />
4,125 M GATX Corp., 4.75%, 6/15/2022 4,398,842<br />
2,000 M Penske Truck Leasing Co., LP, 4.875%, 7/11/2022 (a) 2,122,192<br />
14,277,844<br />
Utilities—4.7%<br />
3,000 M E.ON International Finance BV, 5.8%, 4/30/2018 (a) 3,411,897<br />
1,900 M Electricite de France SA, 6.5%, 1/26/2019 (a) 2,251,456<br />
4,000 M Exelon Generation Co., LLC, 5.2%, 10/1/2019 4,377,684<br />
Great River Energy Co.:<br />
393 M 5.829%, 7/1/2017 (a) 423,195<br />
3,538 M 4.478%, 7/1/2030 (a) 3,616,073<br />
4,200 M National Fuel Gas Co., 8.75%, 5/1/2019 5,271,638<br />
3,000 M Ohio Power Co., 5.375%, 10/1/2021 3,468,630<br />
2,881 M Sempra Energy, 9.8%, 2/15/2019 3,819,215<br />
26,639,788<br />
Total Value of Corporate Bonds (cost $514,273,727) 96.4% 544,868,417<br />
Other Assets, Less Liabilities 3.6 20,329,837<br />
Net Assets 100.0% $565,198,254<br />
(a) Security exempt from registration under Rule 144A of the Securities Act of 1933 (see Note 4).
Accounting Standards Codification 820 established a three-tier hierarchy of inputs to establish a<br />
classification of fair value measurements for disclosure purposes. The three-tier hierarchy of inputs is<br />
summarized in the three broad Levels listed below:<br />
Level 1 — Unadjusted quoted prices in active markets for identical securities that the Fund has<br />
the ability to access.<br />
Level 2 — Observable inputs other than quoted prices included in Level 1 that are observable<br />
for the asset or liability, either directly or indirectly. These inputs may include quoted<br />
prices for the identical instrument on an inactive market, prices for similar instruments,<br />
interest rates, prepayment speeds, credit risk, yield curves, default rates and<br />
similar data.<br />
Level 3 — Unobservable inputs for the asset or liability, to the extent relevant observable inputs<br />
are not available, representing the Fund’s own assumption about the assumptions a<br />
market participant would use in valuing the asset or liability, and would be based on<br />
the best information available.<br />
The inputs methodology used for valuing securities are not necessarily an indication of the risk<br />
associated with investing in those securities. For example, amortized cost approximates the current<br />
fair value of a security, but since the value is not obtained from a quoted price in an active market,<br />
such securities are reflected as Level 2.<br />
The following is a summary, by category of Level, of inputs used to value the Fund’s investments as of<br />
March 31, 2014:<br />
Level 1 Level 2 Level 3 Total<br />
Corporate Bonds* . . . . . . . . . . . . . $ — $ 544,868,417 $ — $ 544,868,417<br />
* The Portfolio of Investments provides information on the industry categorization for corporate bonds.<br />
There were no transfers into or from Level 1 or Level 2 by the Fund during the period ended<br />
March 31, 2014. Transfers, if any, between Levels are recognized at the end of the reporting period.<br />
See notes to financial statements<br />
19
Fund Expenses (unaudited)<br />
STRATEGIC INCOME FUND<br />
The examples below show the ongoing costs (in dollars) of investing in your Fund and will<br />
help you in comparing these costs with costs of other mutual funds. Please refer to page 4 for a<br />
detailed explanation of the information presented in these examples.<br />
Expense Example<br />
Annualized<br />
Expense<br />
Ratio<br />
Beginning<br />
Account Value<br />
(10/1/13)<br />
Ending<br />
Account Value<br />
(3/31/14)<br />
Expenses Paid<br />
During Period<br />
(10/1/13–3/31/14)*<br />
Class A Shares 1.14%<br />
Actual* $1,000.00 $1,038.91 $5.79<br />
Hypothetical** $1,000.00 $1,019.25 $5.74<br />
Advisor Class Shares 0.69%<br />
Actual* $1,000.00 $1,039.79 $3.51<br />
Hypothetical** $1,000.00 $1,021.49 $3.48<br />
* Expenses are equal to the annualized expense ratio, multiplied by the average account value over<br />
the period, multiplied by 182/365 (to reflect the one-half year period). Expenses paid during the<br />
period are net of expenses waived and/or assumed.<br />
** Assumed rate of return of 5% before expenses.<br />
Portfolio Composition<br />
BY SECTOR<br />
<strong>First</strong> <strong>Investors</strong><br />
Income Funds<br />
84.8%<br />
<strong>First</strong> <strong>Investors</strong><br />
Equity Funds<br />
10.2%<br />
Portfolio holdings and allocations are subject to change. Percentages are as of March 31, 2014, and<br />
are based on the total market value of investments.<br />
20
Portfolio of Investments (continued)<br />
STRATEGIC INCOME FUND<br />
March 31, 2014<br />
Shares or<br />
Principal<br />
Amount Security Value<br />
MUTUAL FUNDS—93.9%<br />
<strong>First</strong> <strong>Investors</strong> Income Funds—83.8%<br />
374,054 Floating Rate Fund – Institutional Shares $ 3,744,280<br />
11,287,793 Fund For Income – Institutional Shares 30,251,285<br />
678,794 Government Fund – Institutional Shares 7,385,283<br />
752,549 International Opportunities Bond Fund – Institutional Shares 7,517,965<br />
1,521,008 Investment Grade Fund – Institutional Shares 15,073,189<br />
63,972,002<br />
<strong>First</strong> <strong>Investors</strong> Equity Funds—10.1%<br />
791,766 Equity Income Fund – Institutional Shares 7,680,134<br />
Total Value of Mutual Funds (cost $71,012,200) 71,652,136<br />
SHORT-TERM U.S. GOVERNMENT<br />
OBLIGATIONS—4.9%<br />
$3,750 M U.S. Treasury Bills, 0.02%, 5/22/2014 (cost $3,749,894) 3,749,894<br />
Total Value of Investments (cost $74,762,094) 98.8% 75,402,030<br />
Other Assets, Less Liabilities 1.2 930,217<br />
Net Assets 100.0% $76,332,247<br />
21
Portfolio of Investments (continued)<br />
STRATEGIC INCOME FUND<br />
March 31, 2014<br />
Accounting Standards Codification 820 established a three-tier hierarchy of inputs to establish a<br />
classification of fair value measurements for disclosure purposes. The three-tier hierarchy of inputs is<br />
summarized in the three broad Levels listed below:<br />
Level 1 — Unadjusted quoted prices in active markets for identical securities that the Fund has<br />
the ability to access.<br />
Level 2 — Observable inputs other than quoted prices included in Level 1 that are observable<br />
for the asset or liability, either directly or indirectly. These inputs may include quoted<br />
prices for the identical instrument on an inactive market, prices for similar instruments,<br />
interest rates, prepayment speeds, credit risk, yield curves, default rates and<br />
similar data.<br />
Level 3 — Unobservable inputs for the asset or liability, to the extent relevant observable inputs<br />
are not available, representing the Fund’s own assumption about the assumptions a<br />
market participant would use in valuing the asset or liability, and would be based on<br />
the best information available.<br />
The inputs methodology used for valuing securities are not necessarily an indication of the risk<br />
associated with investing in those securities. For example, amortized cost approximates the current<br />
fair value of a security, but since the value is not obtained from a quoted price in an active market,<br />
such securities are reflected as Level 2.<br />
The following is a summary, by category of Level, of inputs used to value the Fund’s investments as of<br />
March 31, 2014:<br />
Level 1 Level 2 Level 3 Total<br />
Mutual Funds<br />
<strong>First</strong> <strong>Investors</strong> Income Funds. . $ 63,972,002 $ — $ — $ 63,972,002<br />
<strong>First</strong> <strong>Investors</strong> Equity Funds . . 7,680,134 — — 7,680,134<br />
Short-Term U.S. Government<br />
Obligations. . . . . . . . . . . . . . . . — 3,749,894 — 3,749,894<br />
Total Investments in Securities . . . $ 71,652,136 $ 3,749,894 $ — $ 75,402,030<br />
There were no transfers into or from Level 1 or Level 2 by the Fund during the period ended<br />
March 31, 2014. Transfers, if any, between Levels are recognized at the end of the reporting period.<br />
22<br />
See notes to financial statements
Fund Expenses (unaudited)<br />
INTERNATIONAL OPPORTUNITIES BOND FUND<br />
The examples below show the ongoing costs (in dollars) of investing in your Fund and will<br />
help you in comparing these costs with costs of other mutual funds. Please refer to page 4 for a<br />
detailed explanation of the information presented in these examples.<br />
Expense Example<br />
Annualized<br />
Expense<br />
Ratio<br />
Beginning<br />
Account Value<br />
(10/1/13)<br />
Ending<br />
Account Value<br />
(3/31/14)<br />
Expenses Paid<br />
During Period<br />
(10/1/13–3/31/14)*<br />
Class A Shares 1.30%<br />
Actual $1,000.00 $1,026.97 $6.57<br />
Hypothetical** $1,000.00 $1,018.45 $6.54<br />
Advisor Class Shares 1.14%<br />
Actual $1,000.00 $1,025.21 $5.76<br />
Hypothetical** $1,000.00 $1,019.25 $5.74<br />
Institutional Class Shares 0.95%<br />
Actual $1,000.00 $1,028.59 $4.80<br />
Hypothetical** $1,000.00 $1,020.19 $4.78<br />
* Expenses are equal to the annualized expense ratio, multiplied by the average account value over<br />
the period, multiplied by 182/365 (to reflect the one-half year period). Expenses paid during the<br />
period are net of expenses waived.<br />
**Assumed rate of return of 5% before expenses.<br />
Portfolio Composition<br />
BY SECTOR<br />
Sovereign Bonds<br />
66.5%<br />
U.S. Government<br />
Obligations<br />
Government Regional<br />
Agency<br />
12.2%<br />
15.6%<br />
Government Guaranteed<br />
Program<br />
1.7%<br />
Corporate Bonds<br />
1.7%<br />
Government Sovereign<br />
Agency<br />
1.3%<br />
Supranationals<br />
1.0%<br />
Portfolio holdings and allocations are subject to change. Percentages are as of March 31, 2014, and<br />
are based on the total market value of investments.<br />
23
Portfolio of Investments (continued)<br />
INTERNATIONAL OPPORTUNITIES BOND FUND<br />
March 31, 2014<br />
Principal<br />
Amount Security Value<br />
SOVEREIGN BONDS—61.7%<br />
Mexico—14.3%<br />
United Mexican States:<br />
618 M MXN 8.5%, 5/31/2029 $ 5,545,069<br />
463 M MXN 8.5%, 11/18/2038 4,134,086<br />
672 M MXN 7.75%, 11/13/2042 5,526,037<br />
15,205,192<br />
United Kingdom—9.9%<br />
United Kingdom Gilt:<br />
4,080 M GBP 2.75%, 1/22/2015 6,929,661<br />
1,900 M GBP 4.25%, 3/7/2036 3,572,997<br />
10,502,658<br />
Italy—8.6%<br />
5,870 M EUR Italy Buoni Poliennali Del Tesoro, 5%, 8/1/2039 9,189,225<br />
Brazil—5.0%<br />
Nota Do Tesouro Nacional:<br />
1 M BRL 9.71%, 1/1/2021 202,061<br />
13 M BRL 9.71%, 1/1/2023 5,074,134<br />
5,276,195<br />
South Korea—4.5%<br />
Republic of Korea:<br />
3,594,500 M KRW 5.75%, 9/10/2018 3,741,005<br />
1,170,500 M KRW 3.375%, 9/10/2023 1,090,602<br />
4,831,607<br />
Poland—4.3%<br />
Republic of Poland:<br />
3,025 M PLN 5.25%, 10/25/2020 1,078,475<br />
10,815 M PLN 4%, 10/25/2023 3,517,778<br />
4,596,253<br />
New Zealand—4.0%<br />
New Zealand Government Bonds:<br />
2,390 M NZD 5%, 3/15/2019 2,148,356<br />
2,230 M NZD 5.5%, 4/15/2023 2,064,886<br />
4,213,242<br />
24
Principal<br />
Amount Security Value<br />
South Africa—3.6%<br />
Republic of South Africa:<br />
12,855 M ZAR 6.75%, 3/31/2021 $ 1,130,193<br />
37,525 M ZAR 6.5%, 2/28/2041 2,679,934<br />
3,810,127<br />
Malaysia—3.5%<br />
Federation of Malaysia:<br />
2,950 M MYR 4.048%, 9/30/2021 905,552<br />
9,830 M MYR 3.48%, 3/15/2023 2,870,167<br />
3,775,719<br />
Hungary—2.7%<br />
Hungary Government Bond:<br />
535,000 M HUF 5.5%, 2/12/2016 2,481,938<br />
69,000 M HUF 7.5%, 11/12/2020 351,687<br />
2,833,625<br />
Turkey—1.3%<br />
2,970 M TRY Republic of Turkey, 6.5%, 1/7/2015 1,346,718<br />
Total Value of Sovereign Bonds (cost $65,551,694) 65,580,561<br />
U.S. GOVERNMENT OBLIGATIONS—14.4%<br />
United States<br />
U.S. Treasury Notes:<br />
6,010 M USD 0.25%, 6/30/2014 6,013,167<br />
9,345 M USD 0.095%, 1/31/2016 (a) 9,339,963<br />
Total Value of U.S. Government Obligations (cost $15,353,476) 15,353,130<br />
GOVERNMENT REGIONAL AGENCY—11.3%<br />
Australia—9.9%<br />
5,235 M AUD New South Wales Treasury Corp., 5%, 8/20/2024 5,046,817<br />
Queensland Treasury Corp.:<br />
3,825 M AUD 6.25%, 2/21/2020 3,965,192<br />
1,530 M AUD 6%, 7/21/2022 1,575,471<br />
10,587,480<br />
South Korea—1.0%<br />
1,010 M USD Export-Import Bank of Korea, 0.8611%, 8/14/2017 (a)(b) 1,016,391<br />
25
Portfolio of Investments (continued)<br />
INTERNATIONAL OPPORTUNITIES BOND FUND<br />
March 31, 2014<br />
Principal<br />
Amount Security Value<br />
Netherlands—.4%<br />
466 M USD Bank Nederlanse Gemeenten, 1%, 11/17/2014 (b) $ 468,118<br />
Total Value of Government Regional Agency (cost $12,154,460) 12,071,989<br />
GOVERNMENT GUARANTEED<br />
PROGRAM—1.6%<br />
Germany—.9%<br />
1,000 M USD Erste Abwicklungsanstalt, 0.4344%, 6/7/2016 (a)(b) 1,002,154<br />
New Zealand—.7%<br />
720 M USD Wespac Securities New Zealand, Ltd., 3.45%, 7/28/2014 (b) 727,482<br />
Total Value of Government Guaranteed Program (cost $1,728,997) 1,729,636<br />
CORPORATE BONDS—1.5%<br />
Australia—1.1%<br />
1,160 M USD Macquarie Group, Ltd., 1.2356%, 1/31/2017 (a)(b) 1,160,166<br />
New Zealand—.4%<br />
470 M USD ANZ New Zealand International, Ltd. of London, 0.714%,<br />
4/27/2017 (a)(b) 471,067<br />
Total Value of Corporate Bonds (cost $1,630,000) 1,631,233<br />
GOVERNMENT SOVEREIGN AGENCY—1.2%<br />
Sweden<br />
Swedish Export Credit:<br />
710 M USD 0.41435%, 6/12/2017 (a) 710,837<br />
585 M USD 0.61185%, 11/9/2017 (a) 590,889<br />
Total Value of Government Sovereign Agency (cost $1,301,381) 1,301,726<br />
SUPRANATIONALS—.9%<br />
Luxembourg<br />
1,015 M USD European Investment Bank, 1.125%, 9/15/2017<br />
(cost $1,011,525) 1,011,610<br />
Total Value of Investments (cost $98,731,533) 92.6% 98,679,885<br />
Other Assets, Less Liabilities 7.4 7,831,869<br />
Net Assets 100.0% $106,511,754<br />
26
(a) Interest rates are determined and reset periodically. The interest rates above are the rates in effect<br />
at March 31, 2014<br />
(b) Security exempt from registration under Rule 144A of the Securities Act of 1933 (see Note 4).<br />
Abbreviations:<br />
AUD Australian Dollar<br />
BRL Brazilian Real<br />
EUR Euro<br />
GBP British Pound<br />
HUF Hungarian Forint<br />
KRW South Korean Won<br />
MXN Mexican Peso<br />
MYR Malaysian Ringgit<br />
NZD New Zealand Dollar<br />
PLN Polish Zloty<br />
TRY Turkish Lira<br />
USD United States Dollar<br />
ZAR South African Rand<br />
Accounting Standards Codification 820 established a three-tier hierarchy of inputs to establish a<br />
classification of fair value measurements for disclosure purposes. The three-tier hierarchy of inputs is<br />
summarized in the three broad Levels listed below:<br />
Level 1 — Unadjusted quoted prices in active markets for identical securities that the Fund has<br />
the ability to access.<br />
Level 2 — Observable inputs other than quoted prices included in Level 1 that are observable<br />
for the asset or liability, either directly or indirectly. These inputs may include quoted<br />
prices for the identical instrument on an inactive market, prices for similar instruments,<br />
interest rates, prepayment speeds, credit risk, yield curves, default rates and<br />
similar data.<br />
Level 3 — Unobservable inputs for the asset or liability, to the extent relevant observable inputs<br />
are not available, representing the Fund’s own assumption about the assumptions a<br />
market participant would use in valuing the asset or liability, and would be based on<br />
the best information available.<br />
The inputs methodology used for valuing securities are not necessarily an indication of the risk<br />
associated with investing in those securities. For example, amortized cost approximates the current<br />
fair value of a security, but since the value is not obtained from a quoted price in an active market,<br />
such securities are reflected as Level 2.<br />
27
Portfolio of Investments (continued)<br />
INTERNATIONAL OPPORTUNITIES BOND FUND<br />
March 31, 2014<br />
The following is a summary, by category of Level, of inputs used to value the Fund’s investments as of<br />
March 31, 2014:<br />
Level 1 Level 2 Level 3 Total<br />
Sovereign Bonds<br />
Mexico . . . . . . . . . . . . . . . . . . . $ — $ 15,205,192 $ — $ 15,205,192<br />
United Kingdom . . . . . . . . . . . — 10,502,658 — 10,502,658<br />
Italy . . . . . . . . . . . . . . . . . . . . . — 9,189,225 — 9,189,225<br />
Brazil . . . . . . . . . . . . . . . . . . . . — 5,276,195 — 5,276,195<br />
South Korea . . . . . . . . . . . . . . . — 4,831,607 — 4,831,607<br />
Poland . . . . . . . . . . . . . . . . . . . — 4,596,253 — 4,596,253<br />
New Zealand . . . . . . . . . . . . . . — 4,213,242 — 4,213,242<br />
South Africa. . . . . . . . . . . . . . . — 3,810,127 — 3,810,127<br />
Malaysia. . . . . . . . . . . . . . . . . . — 3,775,719 — 3,775,719<br />
Hungary . . . . . . . . . . . . . . . . . . — 2,833,625 — 2,833,625<br />
Turkey . . . . . . . . . . . . . . . . . . . — 1,346,718 — 1,346,718<br />
U.S. Government Obligations . . . — 15,353,130 — 15,353,130<br />
Government Regional Agency<br />
Australia. . . . . . . . . . . . . . . . . . — 10,587,480 — 10,587,480<br />
South Korea . . . . . . . . . . . . . . . — 1,016,391 — 1,016,391<br />
Netherlands . . . . . . . . . . . . . . — 468,118 — 468,118<br />
Government Guaranteed Program<br />
Germany . . . . . . . . . . . . . . . . . — 1,002,154 — 1,002,154<br />
New Zealand . . . . . . . . . . . . . . — 727,482 — 727,482<br />
Corporate Bonds<br />
Australia. . . . . . . . . . . . . . . . . . — 1,160,166 — 1,160,166<br />
New Zealand . . . . . . . . . . . . . . — 471,067 — 471,067<br />
Government Sovereign Agency<br />
Sweden. . . . . . . . . . . . . . . . . . . — 1,301,726 — 1,301,726<br />
Supranationals<br />
Luxembourg. . . . . . . . . . . . . . . — 1,011,610 — 1,011,610<br />
Total Investments in Securities . . . $ — $ 98,679,885 $ — $ 98,679,885<br />
Other Financial Instruments* . . . . $ — $ 202,858 $ — $ 202,858<br />
* Other financial instruments are foreign exchange contracts and are considered derivative instruments,<br />
which are valued at the net unrealized appreciation on the instruments.<br />
During the period ended March 31, 2014, there were no transfers between Level 1 investments and<br />
Level 2 investments that had a material impact to the Fund. Transfers, if any, between Levels are<br />
recognized at the end of the reporting period.<br />
28<br />
See notes to financial statements
Fund Expenses (unaudited)<br />
FLOATING RATE FUND<br />
The examples below show the ongoing costs (in dollars) of investing in your Fund and will<br />
help you in comparing these costs with costs of other mutual funds. Please refer to page 4 for a<br />
detailed explanation of the information presented in these examples.<br />
Expense Example<br />
Annualized<br />
Expense<br />
Ratio<br />
Beginning<br />
Account Value<br />
(10/21/13)<br />
Ending<br />
Account Value<br />
(3/31/14)<br />
Expenses Paid<br />
During Period<br />
(10/21/13–3/31/14)*<br />
Class A Shares 1.10%<br />
Actual $1,000.00 $1,011.19 $4.91<br />
Hypothetical** $1,000.00 $1,020.05 $4.93<br />
Advisor Class Shares 0.90%<br />
Actual $1,000.00 $1,012.77 $4.02<br />
Hypothetical** $1,000.00 $1,020.94 $4.04<br />
Institutional Class Shares 0.70%<br />
Actual $1,000.00 $1,012.13 $3.13<br />
Hypothetical** $1,000.00 $1,021.82 $3.14<br />
* Actual expenses reflect the period from the commencement of operations to the end of the period<br />
covered only (October 21, 2013 through March 31, 2014). Therefore, expenses shown are lower<br />
than would be expected for a six-month period. Actual expenses for the six-month period will be<br />
reflected in future reports. Expenses are equal to the annualized expense ratio multiplied by the<br />
average account value over the period, multiplied by 162/365 (to reflect the inception period).<br />
Expenses paid during the period are net of expenses waived and/or assumed.<br />
**Assumed rate of return of 5% before expenses.<br />
Portfolio Composition<br />
BY SECTOR<br />
Consumer Discretionary<br />
26.4%<br />
Materials<br />
16.9%<br />
Consumer Staples<br />
Health Care<br />
Energy<br />
11.7%<br />
11.3%<br />
10.6%<br />
Information Technology<br />
Industrials<br />
Telecommunication<br />
Services<br />
Financials<br />
6.8%<br />
6.0%<br />
4.8%<br />
4.7%<br />
Utilities<br />
0.8%<br />
Portfolio holdings and allocations are subject to change. Percentages are as of March 31, 2014, and<br />
are based on the total market value of investments.<br />
29
Portfolio of Investments (continued)<br />
FLOATING RATE FUND<br />
March 31, 2014<br />
Principal<br />
Amount Security Value<br />
LOAN PARTICIPATIONS†—86.7%<br />
Aerospace/Defense—.9%<br />
$ 597 M TransDigm, Inc., 3.75%, 2/28/2020 $ 599,823<br />
Automotive—3.2%<br />
497 M ASP HHI Group Holdings, LLC, 5%, 10/5/2018 500,603<br />
1,060 M Chrysler Group, LLC, 3.5%, 5/24/2017 1,061,188<br />
650 M CS Intermediate Holdings Co., 4%, 4/4/2021 (a) 651,219<br />
2,213,010<br />
Building Materials—1.1%<br />
797 M USIC Holdings, Inc., 4%, 7/10/2020 797,404<br />
Chemicals—3.7%<br />
328 M Allnex Luxembourg & Cy SCA, Inc., 4.5%, 10/4/2019 330,002<br />
170 M Allnex USA, Inc., 4.5%, 10/4/2019 171,222<br />
799 M Axalta Coating Systems US Holdings, Inc., 4%, 2/1/2020 801,614<br />
797 M Cyanco Intermediate Corp., 5.5%, 5/1/2020 806,701<br />
497 M Univar, Inc., 5%, 6/30/2017 497,045<br />
2,606,584<br />
Energy—10.5%<br />
597 M Alpha Natural Resources, Inc., 3.5%, 5/22/2020 582,557<br />
1,050 M Chesapeake Energy Corp., 5.75%, 12/2/2017 1,074,718<br />
800 M Drillships Financing Holding, Inc., 6%, 3/31/2021 818,000<br />
Fieldwood Energy, LLC:<br />
249 M 3.875%, 9/28/2018 249,839<br />
757 M 8.125%, 9/30/2020 (a) 791,946<br />
Murray Energy Corp.:<br />
650 M 5.25%, 11/21/2019 657,255<br />
250 M 5.25%, 12/5/2019 252,790<br />
647 M Offshore Group Investment, Ltd., 5.75%, 3/28/2019 652,931<br />
846 M Pacific Drilling SA, 4.5%, 6/3/2018 851,548<br />
1,000 M Samson Investment Co., 5%, 9/25/2018 1,012,500<br />
399 M Seadrill Partners, LLC, 4%, 2/12/2021 399,000<br />
7,343,084<br />
30
Principal<br />
Amount Security Value<br />
Financial Services—4.4%<br />
$ 597 M HUB International, Ltd., 4.75%, 10/2/2020 $ 600,784<br />
678 M International Lease Finance Corp. (Delos Aircraft, Inc.),<br />
3.5%, 2/26/2021 680,373<br />
800 M Ocwen Loan Servicing, LLC, 5%, 2/15/2018 (a) 806,334<br />
997 M Sheridan Investment Partners II, LP, 4.25%, 12/16/2020 1,005,917<br />
3,093,408<br />
Food/Beverage/Tobacco—3.5%<br />
800 M Darling International Inc., 3.25%, 1/1/2021 800,499<br />
696 M H.J. Heinz Co., 3.5%, 6/5/2020 701,932<br />
441 M JBS USA, LLC, 3.75%, 5/25/2018 439,792<br />
497 M Pinnacle Foods Finance, LLC, 3.25%, 4/29/2020 496,167<br />
2,438,390<br />
Food/Drug—3.0%<br />
900 M Rite Aid Corp., 4.875%, 6/21/2021 915,188<br />
527 M Sprouts Farmers Market Holdings, LLC, 4%, 4/23/2020 528,164<br />
668 M Supervalu, Inc., 4.5%, 3/21/2019 670,865<br />
2,114,217<br />
Forest Products/Container—3.4%<br />
Ardagh Holdings USA, Inc.:<br />
898 M 4.25%, 12/12/2019 (a) 901,677<br />
300 M 4%, 12/17/2019 300,125<br />
597 M Berry Plastics Group, Inc., 3.5%, 2/8/2020 595,912<br />
Exopack, LLC:<br />
498 M 5.25%, 4/11/2019 505,199<br />
100 M 5.25%, 5/8/2019 101,344<br />
2,404,257<br />
Gaming/Leisure—6.9%<br />
597 M AMC Entertainment, Inc., 3.5%, 4/30/2020 598,473<br />
Hilton Worldwide Finance, LLC:<br />
368 M 3.75%, 9/23/2020 368,968<br />
408 M 3.75%, 10/26/2020 409,097<br />
497 M Live Nation Entertainment, Inc., 3.5%, 8/17/2020 499,573<br />
597 M Pinnacle Entertainment, Inc., 3.75%, 8/13/2020 598,859<br />
31
Portfolio of Investments (continued)<br />
FLOATING RATE FUND<br />
March 31, 2014<br />
Principal<br />
Amount Security Value<br />
Gaming/Leisure (continued)<br />
$ 497 M SeaWorld Parks & Entertainment, Inc., 3%, 5/14/2020 $ 490,861<br />
896 M Seminole Hard Rock Entertainment, Inc., 3.5%, 5/14/2020 896,425<br />
1,000 M Zuffa, LLC, 4.5%, 2/25/2020 (a) 1,004,375<br />
4,866,631<br />
Health Care—9.7%<br />
1,000 M Accellent, Inc, 4.5%, 2/19/2021 (a) 998,750<br />
Biomet, Inc.:<br />
248 M 3.65425%, 2/25/2017 248,492<br />
18 M 3.73285%, 2/25/2017 17,713<br />
100 M 3.5%, 7/25/2017 (a) 100,359<br />
4 M 3.6525%, 7/25/2017 4,492<br />
195 M 3.65425%, 7/25/2017 195,689<br />
33 M 3.73285%, 7/25/2017 32,896<br />
406 M Community Health Systems, Inc., 4.25%, 1/27/2021 410,187<br />
750 M Endo Health Solutions, Inc., 3.25%, 3/1/2021 751,406<br />
270 M Grifols Worldwide Operations USA, Inc., 3.25%, 2/26/2021 (a) 270,619<br />
574 M Jazz Pharmaceuticals, Inc., 3.25%, 6/12/2018 575,713<br />
334 M Medpace Holdings, Inc., 5%, 3/31/2021 (a) 335,670<br />
667 M MultiPlan, Inc., 4%, 3/21/2021 (a) 670,919<br />
650 M NBTY, Inc., 3.5%, 10/1/2017 654,062<br />
473 M Onex Carestream Health, Inc., 5%, 6/7/2019 479,596<br />
494 M Salix Pharmaceuticals, Ltd., 4.25%, 12/17/2019 499,356<br />
572 M Select Medical Corp., 3.75%, 6/1/2018 574,215<br />
6,820,134<br />
Information Technology—6.5%<br />
509 M Activision Blizzard, Inc., 3.25%, 10/12/2020 509,227<br />
599 M Applied Systems, Inc., 4.25%, 1/15/2021 602,465<br />
422 M ARRIS Group, Inc., 3.5%, 4/17/2020 419,894<br />
798 M BMC Software Finance, Inc., 5%, 9/10/2020 799,620<br />
360 M DealerTrack Technologies, Inc., 3.5%, 2/4/2021 362,138<br />
Dell International, Inc.:<br />
498 M 4.5%, 3/24/2020 495,945<br />
100 M 4.5%, 4/29/2020 99,487<br />
748 M Infor (US), Inc., 3.75%, 6/3/2020 748,873<br />
504 M Kronos, Inc., 4.5%, 10/30/2019 508,831<br />
4,546,480<br />
32
Principal<br />
Amount Security Value<br />
Manufacturing—3.7%<br />
$ 647 M Apex Tool Group, LLC, 4.5%, 1/31/2020 $ 643,616<br />
Brand Energy & Infrastructure Services, Inc.:<br />
598 M 4.75%, 11/26/2020 601,249<br />
300 M 4.75%, 11/28/2020 (a) 301,547<br />
497 M Gardner Denver, Inc., 4.25%, 7/30/2020 498,018<br />
545 M Mirror BidCo Corp., 4.25%, 12/18/2019 546,293<br />
2,590,723<br />
Media-Broadcasting—.8%<br />
597 M Sinclair Television Group, Inc., 3%, 4/9/2020 595,312<br />
Media-Diversified—1.8%<br />
648 M Tribune Co., 4%, 12/27/2020 649,895<br />
600 M Virgin Media Investment Holdings, Ltd., 3.5%, 6/8/2020 599,850<br />
1,249,745<br />
Metals/Mining—7.6%<br />
1,175 M Arch Coal, Inc., 6.25%, 5/16/2018 1,158,032<br />
597 M FMG Resources (August 2006) Property, Ltd., 4.25%, 6/30/2019 602,721<br />
696 M McJunkin Red Man Corp., 4.75%, 11/11/2019 706,948<br />
497 M Novelis, Inc., 3.75%, 3/10/2017 498,677<br />
Oxbow Carbon & Minerals, LLC:<br />
244 M 4.25%, 7/19/2019 245,575<br />
250 M 8%, 1/19/2020 254,896<br />
895 M Peabody Energy Corp., 4.25%, 9/24/2020 899,915<br />
948 M TMS International Corp., 4.5%, 10/16/2020 954,732<br />
5,321,496<br />
Retail-General Merchandise—9.2%<br />
600 M Academy, Ltd., 4.5%, 8/3/2018 (a) 603,250<br />
599 M General Nutrition Centers, Inc., 3.25%, 3/4/2019 597,871<br />
1,125 M J. Crew Group, Inc., 4%, 2/26/2021 1,124,578<br />
496 M Landry’s, Inc., 4%, 4/24/2018 499,476<br />
985 M Lands’ End, Inc., 4.25%, 3/12/2021 (a) 984,795<br />
Neiman Marcus, Inc.:<br />
500 M 4.25%, 10/16/2020 502,813<br />
398 M 4.25%, 10/25/2020 399,987<br />
Party City Holdings, Inc.:<br />
498 M 4%, 7/22/2019 499,246<br />
149 M 4%, 7/27/2019 149,245<br />
33
Portfolio of Investments (continued)<br />
FLOATING RATE FUND<br />
March 31, 2014<br />
Principal<br />
Amount Security Value<br />
Retail-General Merchandise (continued)<br />
$ 597 M Pilot Travel Centers, LLC, 3.75%, 3/30/2018 $ 600,022<br />
497 M Wendy’s International, Inc., 3.25%, 5/15/2019 496,915<br />
6,458,198<br />
Services—2.7%<br />
300 M Allied Security Holdings, LLC, 4.25%, 2/12/2021 (a) 299,532<br />
Brickman Group, Ltd., LLC:<br />
488 M 4%, 12/18/2020 489,835<br />
1 M 5.25%, 12/18/2020 1,231<br />
623 M Garda World Security Corp., 4%, 11/6/2020 625,385<br />
497 M Monitronics International, Inc., 4.25%, 3/23/2018 499,450<br />
1,915,433<br />
Telecommunications—1.3%<br />
900 M XO Communications, Inc., 4.25%, 3/4/2021 (a) 906,750<br />
Utilities—.7%<br />
497 M Calpine Corp., 4%, 10/9/2019 500,238<br />
Wireless Communications—2.1%<br />
845 M Crown Castle Operating Co., 3.25%, 1/31/2019 845,834<br />
600 M Intelsat Jackson Holdings SA, 3.75%, 6/30/2019 602,813<br />
1,448,647<br />
Total Value of Loan Participations (cost $60,709,336) 60,829,964<br />
CORPORATE BONDS—8.0%<br />
Automotive—.8%<br />
500 M Goodyear Tire & Rubber Co., 8.25%, 8/15/2020 559,375<br />
Consumer Non-Durables—1.5%<br />
500 M Hanesbrands, Inc., 6.375%, 12/15/2020 548,750<br />
500 M Reynolds Group Issuer, Inc., 7.125%, 4/15/2019 531,250<br />
1,080,000<br />
Energy—.4%<br />
250 M Expro Finance Luxembourg SCA, 8.5%, 12/15/2016 (b) 261,719<br />
Gaming/Leisure—.4%<br />
250 M National CineMedia, LLC, 7.875%, 7/15/2021 277,187<br />
34
Principal<br />
Amount Security Value<br />
Health Care—1.0%<br />
Community Health Systems, Inc.:<br />
$ 250 M 5.125%, 8/15/2018 $ 263,125<br />
75 M 8%, 11/15/2019 82,781<br />
300 M HCA, Inc., 7.25%, 9/15/2020 325,125<br />
671,031<br />
Media-Cable TV—1.3%<br />
475 M CCO Holdings, LLC, 8.125%, 4/30/2020 521,313<br />
150 M Unitymedia Hessen GmbH & Co., 7.5%, 3/15/2019 (b) 163,500<br />
200 M Virgin Media Finance, PLC, 8.375%, 10/15/2019 215,000<br />
899,813<br />
Metals/Mining—.4%<br />
300 M FMG Resources (August 2006) Property, Ltd., 6%, 4/1/2017 (b) 316,688<br />
Retail-General Merchandise—.8%<br />
250 M Michaels Stores, Inc., 7.75%, 11/1/2018 268,438<br />
300 M Sally Holdings, LLC, 6.875%, 11/15/2019 330,000<br />
598,438<br />
Services—.2%<br />
100 M FTI Consulting, Inc., 6.75%, 10/1/2020 108,250<br />
Telecommunications—.4%<br />
250 M PAETEC Holding Corp., 9.875%, 12/1/2018 275,625<br />
Wireless Communications—.8%<br />
550 M MetroPCS Wireless, Inc., 7.875%, 9/1/2018 585,750<br />
Total Value of Corporate Bonds (cost $5,601,708) 5,633,876<br />
Total Value of Investments (cost $66,311,044) 94.7% 66,463,840<br />
Other Assets, Less Liabilities 5.3 3,712,967<br />
Net Assets 100.0% $70,176,807<br />
† Interest rates are determined and reset periodically. The interest rates above are the rates in effect<br />
at March 31, 2014.<br />
(a) A portion or all of the security purchased on a when-issued or delayed delivery basis.<br />
(b) Security exempt from registration under Rule 144A of the Securities Act of 1933 (see Note 4).<br />
35
Portfolio of Investments (continued)<br />
FLOATING RATE FUND<br />
March 31, 2014<br />
Accounting Standards Codification 820 established a three-tier hierarchy of inputs to establish a<br />
classification of fair value measurements for disclosure purposes. The three-tier hierarchy of inputs is<br />
summarized in the three broad Levels listed below:<br />
Level 1 — Unadjusted quoted prices in active markets for identical securities that the Fund has<br />
the ability to access.<br />
Level 2 — Observable inputs other than quoted prices included in Level 1 that are observable<br />
for the asset or liability, either directly or indirectly. These inputs may include quoted<br />
prices for the identical instrument on an inactive market, prices for similar instruments,<br />
interest rates, prepayment speeds, credit risk, yield curves, default rates and<br />
similar data.<br />
Level 3 — Unobservable inputs for the asset or liability, to the extent relevant observable inputs<br />
are not available, representing the Fund’s own assumption about the assumptions a<br />
market participant would use in valuing the asset or liability, and would be based on<br />
the best information available.<br />
The inputs methodology used for valuing securities are not necessarily an indication of the risk<br />
associated with investing in those securities. For example, amortized cost approximates the current<br />
fair value of a security, but since the value is not obtained from a quoted price in an active market,<br />
such securities are reflected as Level 2<br />
The following is a summary, by category of Level, of inputs used to value the Fund’s investments as of<br />
March 31, 2014:<br />
Level 1 Level 2 Level 3 Total<br />
Loan Participations . . . . . . . . . . . $ — $ 60,829,964 $ — $ 60,829,964<br />
Corporate Bonds . . . . . . . . . . . . . — 5,633,876 — 5,633,876<br />
Total Investments in Securities* . . $ — $ 66,463,840 $ — $ 66,463,840<br />
* The Portfolio of Investments provides information on the industry categorization of loan participations<br />
and corporate bonds.<br />
There were no transfers into or from Level 1 and Level 2 by the Fund for the period ended<br />
March 31, 2014. Transfers, if any, between Levels are recognized at the end of the reporting period.<br />
36<br />
See notes to financial statements
Fund Expenses (unaudited)<br />
FUND FOR INCOME<br />
The examples below show the ongoing costs (in dollars) of investing in your Fund and will<br />
help you in comparing these costs with costs of other mutual funds. Please refer to page 4 for a<br />
detailed explanation of the information presented in these examples.<br />
Expense Example<br />
Annualized<br />
Expense<br />
Ratio<br />
Beginning<br />
Account Value<br />
(10/1/13)<br />
Ending<br />
Account Value<br />
(3/31/14)<br />
Expenses Paid<br />
During Period<br />
(10/1/13–3/31/14)*<br />
Class A Shares 1.21%<br />
Actual $1,000.00 $1,058.23 $ 6.21<br />
Hypothetical** $1,000.00 $1,018.90 $ 6.09<br />
Class B Shares 2.03%<br />
Actual $1,000.00 $1,054.68 $10.40<br />
Hypothetical** $1,000.00 $1,014.81 $10.20<br />
Advisor Class Shares 0.98%<br />
Actual $1,000.00 $1,058.46 $ 5.03<br />
Hypothetical** $1,000.00 $1,020.04 $ 4.94<br />
Institutional Class Shares 0.78%<br />
Actual $1,000.00 $1,059.21 $ 4.00<br />
Hypothetical** $1,000.00 $1,021.04 $ 3.93<br />
* Expenses are equal to the annualized expense ratio, multiplied by the average account value over<br />
the period, multiplied by 182/365 (to reflect the one-half year period). Expenses paid during the<br />
period are net of expenses waived.<br />
**Assumed rate of return of 5% before expenses.<br />
Portfolio Composition<br />
BY SECTOR<br />
Energy<br />
17.7%<br />
Consumer Discretionary<br />
Consumer Staples<br />
Materials<br />
14.8%<br />
14.5%<br />
13.8%<br />
Industrials<br />
10.4%<br />
Telecommunication<br />
Services<br />
Health Care<br />
7.7%<br />
8.8%<br />
Financials<br />
Information Technology<br />
5.0%<br />
4.6%<br />
Utilities<br />
2.7%<br />
Portfolio holdings and allocations are subject to change. Percentages are as of March 31, 2014, and<br />
are based on the total market value of investments.<br />
37
Portfolio of Investments (continued)<br />
FUND FOR INCOME<br />
March 31, 2014<br />
Principal<br />
Amount Security Value<br />
CORPORATE BONDS—89.6%<br />
Aerospace/Defense—.6%<br />
$3,725 M Meccanica Holdings USA, Inc., 6.25%, 7/15/2019 (a) $ 4,018,344<br />
Automotive—3.3%<br />
American Axle & Manufacturing, Inc.:<br />
2,350 M 6.25%, 3/15/2021 2,514,500<br />
1,950 M 6.625%, 10/15/2022 2,123,062<br />
2,875 M Chrysler Group, LLC, 8%, 6/15/2019 (a) 3,162,500<br />
2,825 M Cooper-Standard Automotive, Inc., 8.5%, 5/1/2018 2,966,278<br />
3,300 M Gestamp Funding Luxembourg SA, 5.625%, 5/31/2020 (a) 3,440,250<br />
900 M Goodyear Tire & Rubber Co., 8.25%, 8/15/2020 1,006,875<br />
625 M Jaguar Land Rover Automotive, PLC, 8.125%, 5/15/2021 (a) 712,500<br />
Oshkosh Corp.:<br />
2,400 M 8.5%, 3/1/2020 2,646,000<br />
500 M 5.375%, 3/1/2022 (a) 511,250<br />
Schaeffler Finance BV:<br />
1,900 M 8.5%, 2/15/2019 (a) 2,130,375<br />
2,050 M 4.75%, 5/15/2021 (a) 2,106,375<br />
23,319,965<br />
Building Materials—1.6%<br />
Building Materials Corp.:<br />
3,625 M 6.875%, 8/15/2018 (a) 3,824,375<br />
1,700 M 7.5%, 3/15/2020 (a) 1,840,250<br />
1,325 M Cemex Finance, LLC, 9.375%, 10/12/2022 (a) 1,561,844<br />
Cemex SAB de CV:<br />
1,350 M 9.5%, 6/15/2018 (a) 1,562,625<br />
525 M 5.875%, 3/25/2019 (a) 545,344<br />
400 M 6.5%, 12/10/2019 (a) 426,500<br />
1,600 M Griffon Corporation, 5.25%, 3/1/2022 (a) 1,588,000<br />
11,348,938<br />
Chemicals—1.5%<br />
1,625 M Huntsman International, LLC, 8.625%, 3/15/2020 1,791,563<br />
1,125 M LSB Industries, Inc., 7.75%, 8/1/2019 (a) 1,212,188<br />
2,575 M Orion Engineered Carbon Bondco GmbH, 9.625%, 6/15/2018 (a) 2,800,313<br />
4,175 M TPC Group, Inc., 8.75%, 12/15/2020 (a) 4,597,719<br />
10,401,783<br />
38
Principal<br />
Amount Security Value<br />
Consumer Non-Durables—2.4%<br />
$2,200 M Hanesbrands, Inc., 6.375%, 12/15/2020 $ 2,414,500<br />
Levi Strauss & Co.:<br />
925 M 7.625%, 5/15/2020 1,009,406<br />
2,625 M 6.875%, 5/1/2022 2,894,063<br />
1,017 M Libbey Glass, Inc., 6.875%, 5/15/2020 1,112,344<br />
Reynolds Group Issuer, Inc.:<br />
1,250 M 7.125%, 4/15/2019 1,328,125<br />
4,900 M 5.75%, 10/15/2020 5,157,250<br />
Spectrum Brands Escrow Corp.:<br />
1,375 M 6.375%, 11/15/2020 1,495,313<br />
1,480 M 6.625%, 11/15/2022 1,618,750<br />
17,029,751<br />
Energy—16.7%<br />
AmeriGas Finance, LLC:<br />
500 M 6.75%, 5/20/2020 543,750<br />
1,250 M 7%, 5/20/2022 1,371,875<br />
Antero Resources Finance Corp.:<br />
675 M 6%, 12/1/2020 721,406<br />
950 M 5.375%, 11/1/2021 (a) 964,844<br />
Atlas Pipeline Partners, LP:<br />
2,225 M 4.75%, 11/15/2021 2,124,875<br />
4,000 M 5.875%, 8/1/2023 3,970,000<br />
Basic Energy Services, Inc.:<br />
1,025 M 7.75%, 2/15/2019 1,105,719<br />
2,100 M 7.75%, 10/15/2022 2,289,000<br />
Berry Petroleum Co.:<br />
675 M 6.75%, 11/1/2020 715,500<br />
2,275 M 6.375%, 9/15/2022 2,366,000<br />
Calumet Specialty Products Partners, LP:<br />
2,650 M 9.625%, 8/1/2020 3,054,125<br />
1,100 M 6.5%, 4/15/2021 (a) 1,111,000<br />
525 M 7.625%, 1/15/2022 558,469<br />
Chesapeake Energy Corp.:<br />
2,025 M 7.25%, 12/15/2018 2,369,250<br />
800 M 6.625%, 8/15/2020 902,000<br />
2,000 M 6.875%, 11/15/2020 2,280,000<br />
1,325 M 5.75%, 3/15/2023 1,409,469<br />
Consol Energy, Inc.:<br />
1,225 M 8%, 4/1/2017 1,280,125<br />
4,250 M 8.25%, 4/1/2020 4,637,812<br />
39
Portfolio of Investments (continued)<br />
FUND FOR INCOME<br />
March 31, 2014<br />
Principal<br />
Amount Security Value<br />
Energy (continued)<br />
$1,450 M Crestwood Midstream Partners, LP, 6%, 12/15/2020 $ 1,526,125<br />
3,325 M Eagle Rock Energy Partners, LP, 8.375%, 6/1/2019 3,624,250<br />
2,750 M El Paso Corp., 6.5%, 9/15/2020 3,031,297<br />
2,075 M Energy XXI Gulf Coast, Inc., 7.5%, 12/15/2021 (a) 2,183,937<br />
3,126 M Expro Finance Luxembourg SCA, 8.5%, 12/15/2016 (a) 3,272,531<br />
1,350 M Exterran Partners, LP, 6%, 10/1/2022 (a)(b)(c) 1,328,008<br />
1,375 M Forum Energy Technologies, Inc., 6.25%, 10/1/2021 (a) 1,464,375<br />
2,800 M Genesis Energy, LP, 7.875%, 12/15/2018 3,027,500<br />
2,125 M Gibson Energy, Inc., 6.75%, 7/15/2021 (a) 2,289,687<br />
Kinder Morgan, Inc.:<br />
650 M 5%, 2/15/2021 (a) 654,169<br />
1,650 M 5.625%, 11/15/2023 (a) 1,640,118<br />
875 M Laredo Petroleum, Inc., 5.625%, 1/15/2022 (a) 887,031<br />
Legacy Reserves, LP:<br />
3,175 M 8%, 12/1/2020 3,413,125<br />
1,500 M 6.625%, 12/1/2021 1,503,750<br />
Linn Energy, LLC:<br />
625 M 6.5%, 5/15/2019 654,688<br />
1,850 M 7.25%, 11/1/2019 (a) 1,937,875<br />
1,225 M 8.625%, 4/15/2020 1,336,781<br />
1,975 M 7.75%, 2/1/2021 2,133,000<br />
3,025 M Memorial Production Partners, LP, 7.625%, 5/1/2021 (a) 3,206,500<br />
1,100 M Newfield Exploration Co., 5.75%, 1/30/2022 1,174,250<br />
3,450 M Northern Blizzard Resources, Inc., 7.25%, 2/1/2022 (a) 3,557,813<br />
1,375 M NuStar Logistics, LP, 6.75%, 2/1/2021 1,493,594<br />
Offshore Group Investment, Ltd.:<br />
4,075 M 7.5%, 11/1/2019 4,360,250<br />
1,075 M 7.125%, 4/1/2023 1,099,188<br />
1,675 M Pacific Drilling SA, 5.375%, 6/1/2020 (a) 1,670,813<br />
Penn Virginia Resource Partners, LP:<br />
2,200 M 8.25%, 4/15/2018 2,300,375<br />
490 M 8.375%, 6/1/2020 552,475<br />
2,600 M PetroLogistics, LP, 6.25%, 4/1/2020 2,619,500<br />
1,400 M Pioneer Energy Services Corp., 6.125%, 3/15/2022 (a) 1,428,000<br />
4,000 M Rain CII Carbon, LLC, 8.25%, 1/15/2021 (a) 4,140,000<br />
1,150 M Regency Energy Partners, LP, 5.875%, 3/1/2022 1,196,000<br />
1,865 M RKI Exploration and Production, LLC, 8.5%, 8/1/2021 (a) 2,023,525<br />
3,750 M Sabine Pass Liquefaction, 6.25%, 3/15/2022 (a) 3,914,063<br />
1,575 M Samson Investment Co., 10.75%, 2/15/2020 (a) 1,724,625<br />
2,450 M SandRidge Energy, Inc., 7.5%, 2/15/2023 2,609,250<br />
40
Principal<br />
Amount Security Value<br />
Energy (continued)<br />
SM Energy Co.:<br />
$ 425 M 6.625%, 2/15/2019 $ 456,875<br />
1,175 M 6.5%, 11/15/2021 1,274,875<br />
1,150 M 6.5%, 1/1/2023 1,233,375<br />
Suburban Propane Partners, LP:<br />
2,089 M 7.5%, 10/1/2018 2,230,008<br />
433 M 7.375%, 8/1/2021 479,548<br />
1,225 M Ultra Petroleum Corp., 5.75%, 12/15/2018 (a) 1,289,313<br />
2,875 M Unit Corp., 6.625%, 5/15/2021 3,061,875<br />
118,779,556<br />
Financials—3.3%<br />
Ally Financial, Inc.:<br />
3,625 M 6.25%, 12/1/2017 4,060,000<br />
1,350 M 4.75%, 9/10/2018 1,432,687<br />
4,525 M 8%, 3/15/2020 5,475,250<br />
1,375 M 8%, 11/1/2031 1,701,562<br />
General Motors Financial Co., Inc.:<br />
575 M 3.25%, 5/15/2018 582,187<br />
175 M 4.25%, 5/15/2023 173,250<br />
International Lease Finance Corp.:<br />
4,775 M 8.75%, 3/15/2017 5,622,563<br />
2,350 M 8.25%, 12/15/2020 2,848,177<br />
1,375 M Nielsen Co., (Luxembourg) Sarl, 5.5%, 10/1/2021 (a) 1,442,031<br />
23,337,707<br />
Food/Beverage/Tobacco—2.1%<br />
2,100 M B&G Foods, Inc., 4.625%, 6/1/2021 2,081,625<br />
2,200 M Barry Callebaut Services SA, 5.5%, 6/15/2023 (a) 2,304,258<br />
1,624 M Chiquita Brands International, Inc., 7.875%, 2/1/2021 1,818,880<br />
2,550 M Darling Escrow Corp., 5.375%, 1/15/2022 (a) 2,623,312<br />
JBS Investments GmbH:<br />
1,000 M 7.75%, 10/28/2020 (a) 1,058,750<br />
750 M 7.25%, 4/3/2024 (a)(c) 750,000<br />
1,700 M JBS USA, LLC, 7.25%, 6/1/2021 (a) 1,814,750<br />
1,275 M Post Holdings, Inc., 6.75%, 12/1/2021 (a) 1,353,094<br />
375 M Sun Merger Sub, Inc., 5.875%, 8/1/2021 (a) 390,000<br />
1,475 M Treehouse Foods, Inc., 4.875%, 3/15/2022 1,487,906<br />
15,682,575<br />
41
Portfolio of Investments (continued)<br />
FUND FOR INCOME<br />
March 31, 2014<br />
Principal<br />
Amount Security Value<br />
Food/Drug—.4%<br />
$2,900 M BI-LO, LLC, 8.625%, 9/15/2018 (a) $ 3,019,625<br />
Forest Products/Containers—2.6%<br />
2,675 M Ardagh Packaging Finance, PLC, 7.375%, 10/15/2017 (a) 2,857,999<br />
1,050 M Ball Corp., 4%, 11/15/2023 987,000<br />
3,525 M Clearwater Paper Corp., 7.125%, 11/1/2018 3,771,750<br />
1,925 M CROWN Americas, LLC, 4.5%, 1/15/2023 1,848,000<br />
2,200 M Greif, Inc., 7.75%, 8/1/2019 2,530,000<br />
Sealed Air Corp.:<br />
1,500 M 8.125%, 9/15/2019 (a) 1,683,750<br />
1,250 M 8.375%, 9/15/2021 (a) 1,445,313<br />
3,170 M Tekni-Plex, Inc., 9.75%, 6/1/2019 (a) 3,613,800<br />
18,737,612<br />
Gaming/Leisure—1.5%<br />
GLP Capital, LP:<br />
850 M 4.875%, 11/1/2020 (a) 874,437<br />
1,150 M 5.375%, 11/1/2023 (a) 1,187,375<br />
1,350 M Hilton Worldwide Finance, LLC, 5.625%, 10/15/2021 (a) 1,413,281<br />
3,325 M National CineMedia, LLC, 7.875%, 7/15/2021 3,686,594<br />
1,700 M Regal Entertainment Group, 5.75%, 3/15/2022 1,755,250<br />
1,575 M Six Flags Entertainment Corp., 5.25%, 1/15/2021 (a) 1,590,750<br />
10,507,687<br />
Health Care—7.5%<br />
Aviv Healthcare Properties, LP:<br />
850 M 7.75%, 2/15/2019 922,250<br />
825 M 6%, 10/15/2021 860,062<br />
4,924 M Biomet, Inc., 6.5%, 8/1/2020 5,327,768<br />
Community Health Systems, Inc.:<br />
1,275 M 5.125%, 8/15/2018 1,341,937<br />
2,050 M 8%, 11/15/2019 2,262,687<br />
2,425 M 7.125%, 7/15/2020 2,634,156<br />
575 M 5.125%, 8/1/2021 (a) 592,250<br />
1,150 M 6.875%, 2/1/2022 (a) 1,207,500<br />
1,950 M DaVita, Inc., 6.375%, 11/1/2018 2,052,375<br />
2,025 M Endo Finance Co., 5.75%, 1/15/2022 (a) 2,080,687<br />
42
Principal<br />
Amount Security Value<br />
Health Care (continued)<br />
$1,150 M Fresenius Medical Care US Finance II, Inc.,<br />
5.625%, 7/31/2019 (a) $ 1,244,875<br />
HCA, Inc.:<br />
2,075 M 8%, 10/1/2018 2,464,063<br />
1,375 M 6.5%, 2/15/2020 1,543,438<br />
475 M 7.25%, 9/15/2020 514,781<br />
1,225 M 6.25%, 2/15/2021 1,314,425<br />
1,950 M 7.75%, 5/15/2021 2,154,750<br />
2,075 M 7.5%, 2/15/2022 2,375,875<br />
HealthSouth Corp.:<br />
1,852 M 8.125%, 2/15/2020 2,014,050<br />
847 M 7.75%, 9/15/2022 931,700<br />
3,600 M NBTY, Inc., 9%, 10/1/2018 3,888,000<br />
3,450 M Tenet Healthcare Corp., 6.75%, 2/1/2020 3,644,063<br />
3,000 M Universal Hospital Services, Inc., 7.625%, 8/15/2020 3,225,000<br />
Valeant Pharmaceuticals International, Inc.:<br />
4,575 M 6.375%, 10/15/2020 (a) 4,963,875<br />
1,300 M 5.625%, 12/1/2021 (a) 1,368,250<br />
1,975 M WellCare Health Plans, Inc., 5.75%, 11/15/2020 2,083,625<br />
53,012,442<br />
Information Technology—3.8%<br />
Activision Blizzard, Inc.:<br />
1,075 M 5.625%, 9/15/2021 (a) 1,152,937<br />
500 M 6.125%, 9/15/2023 (a) 545,625<br />
Advanced Micro Devices, Inc.:<br />
1,000 M 6.75%, 3/1/2019 (a) 1,006,250<br />
2,450 M 7.5%, 8/15/2022 2,437,750<br />
Audatex North America, Inc.:<br />
4,225 M 6%, 6/15/2021 (a) 4,531,312<br />
875 M 6.125%, 11/1/2023 (a) 935,156<br />
1,475 M CyrusOne, LP, 6.375%, 11/15/2022 1,563,500<br />
2,125 M Denali Borrower, LLC, 5.625%, 10/15/2020 (a) 2,167,500<br />
350 M Entegris, Inc., 6%, 4/1/2022 (a) 358,750<br />
2,025 M Equinix, Inc., 7%, 7/15/2021 2,265,469<br />
3,175 M Healthcare Technology Intermediate, Inc., 7.375%, 9/1/2018 (a) 3,238,500<br />
1,800 M IAC/InterActiveCorp, 4.875%, 11/30/2018 1,887,750<br />
3,375 M Lender Processing Services, Inc., 5.75%, 4/15/2023 3,615,469<br />
1,150 M Micron Technology, Inc., 5.875%, 2/15/2022 (a) 1,207,500<br />
26,913,468<br />
43
Portfolio of Investments (continued)<br />
FUND FOR INCOME<br />
March 31, 2014<br />
Principal<br />
Amount Security Value<br />
Manufacturing—4.3%<br />
Bombardier, Inc.:<br />
$2,425 M 7.5%, 3/15/2018 (a) $ 2,746,312<br />
1,125 M 4.75%, 4/15/2019 (a)(c) 1,125,000<br />
2,200 M 7.75%, 3/15/2020 (a) 2,475,000<br />
1,850 M 6%, 10/15/2022 (a)(c) 1,850,000<br />
2,150 M 6.125%, 1/15/2023 (a) 2,182,250<br />
1,775 M Brand Energy & Infrastructure Services, Inc., 8.5%, 12/1/2021 (a) 1,885,937<br />
3,850 M Case New Holland, Inc., 7.875%, 12/1/2017 4,533,375<br />
2,450 M Dematic SA, 7.75%, 12/15/2020 (a) 2,627,625<br />
1,550 M EDP Finance BV, 6%, 2/2/2018 (a) 1,685,625<br />
2,150 M H&E Equipment Services, Inc., 7%, 9/1/2022 2,375,750<br />
Rexel SA:<br />
5,475 M 6.125%, 12/15/2019 (a) 5,789,813<br />
975 M 5.25%, 6/15/2020 (a) 1,001,813<br />
30,278,500<br />
Media-Broadcasting—2.4%<br />
2,450 M Allbritton Communication Co., 8%, 5/15/2018 2,572,500<br />
Belo Corp.:<br />
725 M 7.75%, 6/1/2027 783,906<br />
150 M 7.25%, 9/15/2027 156,375<br />
1,575 M Block Communications, Inc., 7.25%, 2/1/2020 (a) 1,685,250<br />
2,075 M LIN Television Corp., 8.375%, 4/15/2018 2,204,688<br />
3,175 M Nexstar Broadcasting, Inc., 6.875%, 11/15/2020 3,429,000<br />
Sinclair Television Group, Inc.:<br />
2,300 M 5.375%, 4/1/2021 2,294,250<br />
925 M 6.375%, 11/1/2021 966,625<br />
Sirius XM Radio, Inc.:<br />
1,875 M 5.75%, 8/1/2021 (a) 1,959,375<br />
800 M 4.625%, 5/15/2023 (a) 756,000<br />
16,807,969<br />
Media-Cable TV—6.6%<br />
Cablevision Systems Corp.:<br />
2,000 M 8.625%, 9/15/2017 2,380,000<br />
1,525 M 7.75%, 4/15/2018 1,748,031<br />
44
Principal<br />
Amount Security Value<br />
Media-Cable TV (continued)<br />
CCO Holdings, LLC:<br />
$1,825 M 7%, 1/15/2019 $ 1,934,500<br />
1,125 M 8.125%, 4/30/2020 1,234,687<br />
1,175 M 7.375%, 6/1/2020 1,288,094<br />
650 M 5.25%, 3/15/2021 658,125<br />
550 M 6.5%, 4/30/2021 585,062<br />
875 M 5.125%, 2/15/2023 846,562<br />
3,825 M Cequel Communications Holdings I, LLC, 6.375%, 9/15/2020 (a) 4,016,250<br />
Clear Channel Worldwide Holdings, Inc.:<br />
200 M 7.625%, 3/15/2020 Series “A” 215,500<br />
950 M 7.625%, 3/15/2020 Series “B” 1,030,750<br />
1,025 M 6.5%, 11/15/2022 Series “A” 1,092,906<br />
2,375 M 6.5%, 11/15/2022 Series “B” 2,550,156<br />
DISH DBS Corp.:<br />
5,475 M 7.875%, 9/1/2019 6,487,875<br />
950 M 5%, 3/15/2023 959,500<br />
1,175 M Echostar DBS Corp., 7.125%, 2/1/2016 1,286,625<br />
3,025 M Gray Television, Inc., 7.5%, 10/1/2020 3,297,250<br />
3,275 M Harron Communications, LP, 9.125%, 4/1/2020 (a) 3,717,125<br />
1,675 M Lynx II Corp., 6.375%, 4/15/2023 (a) 1,783,875<br />
1,725 M Midcontinent Communications Corp., 6.25%, 8/1/2021 (a) 1,802,625<br />
2,375 M Nara Cable Funding, Ltd., 8.875%, 12/1/2018 (a) 2,597,656<br />
450 M Quebecor Media, Inc., 5.75%, 1/15/2023 453,375<br />
3,850 M UPC Holding BV, 9.875%, 4/15/2018 (a) 4,066,563<br />
1,275 M VTR Finance BV, 6.875%, 1/15/2024 (a) 1,329,188<br />
47,362,280<br />
Media-Diversified—1.0%<br />
Gannett Company, Inc.:<br />
1,700 M 5.125%, 7/15/2020 (a) 1,755,250<br />
1,600 M 6.375%, 10/15/2023 (a) 1,702,000<br />
3,625 M Lamar Media Corp., 7.875%, 4/15/2018 3,783,594<br />
7,240,844<br />
Metals/Mining—7.8%<br />
3,775 M Alcoa, Inc., 6.15%, 8/15/2020 4,119,197<br />
4,000 M Aleris International, Inc., 7.875%, 11/1/2020 4,140,000<br />
ArcelorMittal:<br />
1,925 M 6.125%, 6/1/2018 2,117,500<br />
4,481 M 10.35%, 6/1/2019 5,696,471<br />
2,275 M 6.75%, 2/25/2022 2,508,187<br />
45
Portfolio of Investments (continued)<br />
FUND FOR INCOME<br />
March 31, 2014<br />
Principal<br />
Amount Security Value<br />
Metals/Mining (continued)<br />
Arch Coal, Inc.:<br />
$ 325 M 7%, 6/15/2019 $ 252,687<br />
2,475 M 7.25%, 10/1/2020 1,911,937<br />
2,400 M 7.25%, 6/15/2021 1,824,000<br />
FMG Resources (August 2006) Property, Ltd.:<br />
3,675 M 6.875%, 2/1/2018 (a) 3,881,719<br />
1,350 M 8.25%, 11/1/2019 (a) 1,490,062<br />
5,025 M JMC Steel Group, 8.25%, 3/15/2018 (a) 5,156,906<br />
1,000 M Kaiser Aluminum Corp., 8.25%, 6/1/2020 1,132,500<br />
Novelis, Inc.:<br />
6,475 M 8.375%, 12/15/2017 6,936,344<br />
1,850 M 8.75%, 12/15/2020 2,076,625<br />
Peabody Energy Corp.:<br />
2,050 M 6%, 11/15/2018 2,160,188<br />
1,700 M 6.5%, 9/15/2020 1,763,750<br />
2,525 M 6.25%, 11/15/2021 2,543,938<br />
Steel Dynamics, Inc.:<br />
1,200 M 6.125%, 8/15/2019 1,311,000<br />
675 M 6.375%, 8/15/2022 737,438<br />
United States Steel Corp.:<br />
550 M 7%, 2/1/2018 611,875<br />
1,275 M 7.375%, 4/1/2020 1,402,500<br />
1,925 M Wise Metals Group, LLC, 8.75%, 12/15/2018 (a) 2,074,188<br />
55,849,012<br />
Real Estate Investment Trusts—.3%<br />
2,162 M Taylor Morrison Communities, Inc., 7.75%, 4/15/2020 (a) 2,394,415<br />
Retail-General Merchandise—2.3%<br />
800 M Chinos Intermediate Holdings A, Inc., 7.75%, 5/1/2019 (a) 828,000<br />
1,635 M Jo-Ann Stores, Inc., 8.125%, 3/15/2019 (a) 1,704,488<br />
2,975 M Landry’s, Inc., 9.375%, 5/1/2020 (a) 3,291,094<br />
3,125 M Limited Brands, Inc., 8.5%, 6/15/2019 3,796,875<br />
2,275 M Michaels Stores, Inc., 7.75%, 11/1/2018 2,442,781<br />
2,250 M Party City Holdings, Inc., 8.875%, 8/1/2020 2,517,188<br />
1,800 M Sally Holdings, LLC, 6.875%, 11/15/2019 1,980,000<br />
16,560,426<br />
46
Principal<br />
Amount Security Value<br />
Services—5.1%<br />
ADT Corp.:<br />
$1,075 M 6.25%, 10/15/2021 (a) $ 1,105,906<br />
3,650 M 3.5%, 7/15/2022 3,214,037<br />
650 M 4.125%, 6/15/2023 583,079<br />
1,300 M APX Group, Inc., 6.375%, 12/1/2019 1,332,500<br />
1,525 M Ashtead Capital, Inc., 6.5%, 7/15/2022 (a) 1,666,062<br />
1,350 M CoreLogic, Inc., 7.25%, 6/1/2021 1,468,125<br />
Covanta Holding Corp.:<br />
1,200 M 7.25%, 12/1/2020 1,317,000<br />
2,225 M 6.375%, 10/1/2022 2,375,187<br />
1,450 M Geo Group, Inc., 5.875%, 1/15/2022 1,497,125<br />
Iron Mountain, Inc.:<br />
1,525 M 7.75%, 10/1/2019 1,688,938<br />
3,250 M 5.75%, 8/15/2024 3,180,938<br />
3,000 M Live Nation Entertainment, Inc., 7%, 9/1/2020 (a) 3,296,250<br />
3,650 M LKQ Corp., 4.75%, 5/15/2023 (a) 3,467,500<br />
1,725 M Monitronics International, Inc., 9.125%, 4/1/2020 1,854,375<br />
PHH Corp.:<br />
1,350 M 7.375%, 9/1/2019 1,498,500<br />
1,500 M 6.375%, 8/15/2021 1,556,250<br />
2,925 M Reliance Intermediate Holdings, LP, 9.5%, 12/15/2019 (a) 3,217,500<br />
1,625 M Safway Group Holding, LLC, 7%, 5/15/2018 (a) 1,738,750<br />
36,058,022<br />
Telecommunications—6.2%<br />
CenturyLink, Inc.:<br />
400 M 5.625%, 4/1/2020 422,500<br />
1,500 M 5.8%, 3/15/2022 1,541,250<br />
1,250 M 6.75%, 12/1/2023 1,332,812<br />
Citizens Communications Co.:<br />
5,200 M 7.125%, 3/15/2019 5,785,000<br />
2,175 M 9%, 8/15/2031 2,234,812<br />
575 M Frontier Communications Corp., 8.5%, 4/15/2020 671,312<br />
2,525 M GCI, Inc., 8.625%, 11/15/2019 2,714,375<br />
5,850 M Inmarsat Finance, PLC, 7.375%, 12/1/2017 (a) 6,098,625<br />
Intelsat Jackson Holdings SA:<br />
3,525 M 7.25%, 4/1/2019 3,807,000<br />
1,200 M 8.5%, 11/1/2019 1,291,500<br />
2,075 M 7.25%, 10/15/2020 2,259,156<br />
800 M PAETEC Holding Corp., 9.875%, 12/1/2018 882,000<br />
47
Portfolio of Investments (continued)<br />
FUND FOR INCOME<br />
March 31, 2014<br />
Principal<br />
Amount Security Value<br />
Telecommunications (continued)<br />
Sprint Capital Corp.:<br />
$2,600 M 6.9%, 5/1/2019 $ 2,866,500<br />
2,875 M 6.875%, 11/15/2028 2,803,125<br />
1,700 M Telesat Canada, 6%, 5/15/2017 (a) 1,763,750<br />
Wind Acquisition Finance SA:<br />
750 M 11.75%, 7/15/2017 (a) 791,250<br />
2,175 M 7.25%, 2/15/2018 (a) 2,305,500<br />
Windstream Corp.:<br />
1,725 M 7.875%, 11/1/2017 1,988,063<br />
2,050 M 7.75%, 10/15/2020 2,208,875<br />
600 M 6.375%, 8/1/2023 588,000<br />
44,355,405<br />
Transportation—1.0%<br />
Aircastle, Ltd.:<br />
550 M 4.625%, 12/15/2018 564,437<br />
5,112 M 6.25%, 12/1/2019 5,546,520<br />
900 M Fly Leasing, Ltd., 6.75%, 12/15/2020 945,000<br />
7,055,957<br />
Utilities—2.6%<br />
AES Corp.:<br />
875 M 9.75%, 4/15/2016 1,021,562<br />
98 M 8%, 10/15/2017 116,252<br />
1,275 M 7.375%, 7/1/2021 1,459,875<br />
1,375 M 5.5%, 3/15/2024 1,368,125<br />
Calpine Corp.:<br />
297 M 7.875%, 7/31/2020 (a) 328,185<br />
2,024 M 7.5%, 2/15/2021 (a) 2,221,340<br />
2,100 M Dynegy, Inc., 5.875%, 6/1/2023 (a) 2,073,750<br />
1,027 M Indiantown Cogeneration Utilities, LP, 9.77%, 12/15/2020 1,159,022<br />
3,075 M InterGen NV, 7%, 6/30/2023 (a) 3,244,125<br />
2,350 M NRG Energy, Inc., 7.625%, 5/15/2019 2,455,750<br />
3,010 M NSG Holdings, LLC, 7.75%, 12/15/2025 (a) 3,228,225<br />
18,676,211<br />
48
Principal<br />
Amount Security Value<br />
Waste Management—.3%<br />
$2,050 M ADS Waste Holdings, Inc., 8.25%, 10/1/2020 $ 2,239,625<br />
Wireless Communications—2.4%<br />
2,225 M MetroPCS Wireless, Inc., 6.625%, 11/15/2020 2,383,531<br />
Sprint Nextel Corp.:<br />
925 M 9.125%, 3/1/2017 1,098,438<br />
1,250 M 8.375%, 8/15/2017 1,476,563<br />
2,125 M 7%, 8/15/2020 2,326,875<br />
1,750 M 6%, 11/15/2022 1,791,563<br />
T-Mobile USA, Inc.:<br />
4,100 M 6.25%, 4/1/2021 4,351,125<br />
2,725 M 6.625%, 4/1/2023 2,902,125<br />
675 M Videotron, Ltd., 5.375%, 6/15/2024 (a)(b) 680,063<br />
17,010,283<br />
Total Value of Corporate Bonds (cost $609,463,857) 637,998,402<br />
LOAN PARTICIPATIONS†—7.8%<br />
Automotive—.2%<br />
1,525 M CS Intermediate Holdings Co., 4%, 4/4/2021 (b) 1,527,859<br />
Chemicals—.4%<br />
2,804 M Axalta Performance Coating Systems US Holdings, Inc., 4%, 2/1/2020 2,813,890<br />
Energy—1.0%<br />
3,905 M Drillships Financing Holding, Inc., 6%, 3/31/2021 3,993,246<br />
1,000 M Fieldwood Energy, LLC, 8.125%, 9/30/2020 1,045,625<br />
1,925 M Samson Investment Co., 5%, 9/25/2018 1,949,062<br />
6,987,933<br />
Financial Services—.4%<br />
2,955 M Ocwen Financial Corp., 5%, 2/15/2018 2,978,546<br />
Food/Drug—1.4%<br />
3,896 M Albertson’s, LLC, 4.75%, 3/21/2019 3,932,133<br />
3,215 M Rite Aid Corp., 4.875%, 6/21/2021 3,269,253<br />
2,838 M Supervalu, Inc., 4.5%, 3/21/2019 2,848,495<br />
10,049,881<br />
49
Portfolio of Investments (continued)<br />
FUND FOR INCOME<br />
March 31, 2014<br />
Principal<br />
Amount Security Value<br />
Gaming/Leisure—.2%<br />
1,558 M Seminole Hard Rock Entertainment, Inc., 3.5%, 5/14/2020 1,558,549<br />
Health Care—.1%<br />
988 M Community Health Systems, Inc., 4.25%, 1/27/2021 997,753<br />
Information Technology—.9%<br />
1,838 M ARRIS Group, Inc., 3.5%, 4/17/2020 1,830,374<br />
4,788 M BMC Software Finance, Inc., 5%, 9/10/2020 4,797,724<br />
6,628,098<br />
Manufacturing—.8%<br />
2,213 M Apex Tool Group, LLC, 4.5%, 1/31/2020 2,201,983<br />
3,667 M Gardner Denver, Inc., 4.25%, 7/30/2020 3,670,396<br />
5,872,379<br />
Media-Diversified—.9%<br />
1,150 M Kasima, LLC, 3.25%, 5/17/2021 1,150,719<br />
4,988 M Tribune Co., 4%, 12/27/2020 4,999,191<br />
6,149,910<br />
Metals/Mining—.6%<br />
2,825 M Arch Coal, Inc., 6.25%, 5/16/2018 2,784,125<br />
1,280 M Oxbow Carbon & Minerals, LLC, 8%, 1/19/2020 1,305,066<br />
4,089,191<br />
Retail-General Merchandise—.6%<br />
1,231 M Burger King Corp., 3.75%, 9/28/2019 1,239,100<br />
2,692 M General Nutrition Centers, Inc., 3.25%, 3/4/2019 2,684,305<br />
3,923,405<br />
Services—.3%<br />
1,100 M Allied Security Holdings, LLC, 4.25%, 2/12/2021 (b) 1,098,282<br />
Brickman Group, Ltd., LLC:<br />
608 M 4%, 12/18/2020 611,327<br />
470 M 7.5%, 12/17/2021 482,141<br />
2,191,750<br />
Total Value of Loan Participations (cost $55,231,141) 55,769,144<br />
50
Principal<br />
Amount Security Value<br />
PASS THROUGH CERTIFICATES—.6%<br />
Transportation<br />
$3,873 M American Airlines, Series “B” PTT, 5.6%, 7/15/2020<br />
(cost $3,926,941) (a) $ 4,038,033<br />
Total Value of Investments (cost $668,621,939) 98.0% 697,805,579<br />
Other Assets, Less Liabilities 2.0 14,373,518<br />
Net Assets 100.0% $712,179,097<br />
(a) Security exempt from registration under Rule 144A of the Securities Act of 1933 (see Note 4).<br />
(b) A portion or all of the security purchased on a when-issued or delayed delivery basis<br />
(see Note 1G).<br />
(c) Securities valued at fair value (see Note 1A)<br />
† Interest rates are determined and reset periodically. The interest rates above are the rates in effect<br />
at March 31, 2014.<br />
Summary of Abbreviations:<br />
PTT Pass Through Trust<br />
51
Portfolio of Investments (continued)<br />
FUND FOR INCOME<br />
March 31, 2014<br />
Accounting Standards Codification 820 established a three-tier hierarchy of inputs to establish a classification<br />
of fair value measurements for disclosure purposes. The three-tier hierarchy of inputs is summarized<br />
in the three broad Levels listed below:<br />
Level 1 — Unadjusted quoted prices in active markets for identical securities that the Fund has<br />
the ability to access.<br />
Level 2 — Observable inputs other than quoted prices included in Level 1 that are observable<br />
for the asset or liability, either directly or indirectly. These inputs may include<br />
quoted prices for the identical instrument on an inactive market, prices for similar<br />
instruments, interest rates, prepayment speeds, credit risk, yield curves, default rates<br />
and similar data.<br />
Level 3 — Unobservable inputs for the asset or liability, to the extent relevant observable inputs<br />
are not available, representing the Fund’s own assumption about the assumptions a<br />
market participant would use in valuing the asset or liability, and would be based on<br />
the best information available.<br />
The inputs methodology used for valuing securities are not necessarily an indication of the risk<br />
associated with investing in those securities. For example, amortized cost approximates the current<br />
fair value of a security, but since the value is not obtained from a quoted price in an active market,<br />
such securities are reflected as Level 2.<br />
The following is a summary, by category of Level, of inputs used to value the Fund’s investments as of<br />
March 31, 2014:<br />
Level 1 Level 2 Level 3 Total<br />
Corporate Bonds . . . . . . . . . . . . . $ — $ 637,998,402 $ — $ 637,998,402<br />
Loan Participations . . . . . . . . . . . — 55,769,144 — 55,769,144<br />
Pass Through Certificates . . . . . . — 4,038,033 — 4,038,033<br />
Total Investments in Securities* . . $ — $ 697,805,579 $ — $ 697,805,579<br />
* The Portfolio of Investments provides information on the industry categorization for corporate bonds<br />
and loan participations.<br />
There were no transfers into or from Level 1 and Level 2 by the Fund during the period ended<br />
March 31, 2014. Transfers, if any, between Levels are recognized at the end of the reporting period.<br />
52
The following is a reconciliation of Fund investments valued using Level 3 inputs for the period:<br />
Investments<br />
in<br />
Corporate<br />
Bonds<br />
Investments<br />
in<br />
Common<br />
Stocks<br />
Total<br />
Balance, September 30, 2013. . . . . . . . $ — $ 3,785 $ 3,785<br />
Net sales. . . . . . . . . . . . . . . . . . . . . . . . — (3,785) (3,785)<br />
Change in unrealized appreciation. . . . 4,478,295 381,985 4,860,280<br />
Realized loss . . . . . . . . . . . . . . . . . . . . (4,478,295) (381,985) (4,860,280)<br />
Transfer in and/or out of Level 3. . . . . . — — —<br />
Balance, March 31, 2014 . . . . . . . . . . . $ — $ — —<br />
See notes to financial statements<br />
53
Fund Expenses (unaudited)<br />
TOTAL RETURN FUND<br />
The examples below show the ongoing costs (in dollars) of investing in your Fund and will<br />
help you in comparing these costs with costs of other mutual funds. Please refer to page 4 for a<br />
detailed explanation of the information presented in these examples.<br />
Expense Example<br />
Annualized<br />
Expense<br />
Ratio<br />
Beginning<br />
Account Value<br />
(10/1/13)<br />
Ending<br />
Account Value<br />
(3/31/14)<br />
Expenses Paid<br />
During Period<br />
(10/1/13–3/31/14)*<br />
Class A Shares 1.20%<br />
Actual $1,000.00 $1,070.88 $ 6.20<br />
Hypothetical** $1,000.00 $1,018.95 $ 6.04<br />
Class B Shares 1.99%<br />
Actual $1,000.00 $1,066.63 $10.25<br />
Hypothetical** $1,000.00 $1,015.01 $10.00<br />
Advisor Class Shares 0.97%<br />
Actual $1,000.00 $1,070.23 $ 5.01<br />
Hypothetical** $1,000.00 $1,020.09 $ 4.89<br />
Institutional Class Shares 0.80%<br />
Actual $1,000.00 $1,072.63 $ 4.13<br />
Hypothetical** $1,000.00 $1,020.94 $ 4.03<br />
* Expenses are equal to the annualized expense ratio, multiplied by the average account value over<br />
the period, multiplied by 182/365 (to reflect the one-half year period).<br />
**Assumed rate of return of 5% before expenses.<br />
Portfolio Composition<br />
TOP TEN SECTORS<br />
Financials<br />
15.0%<br />
Information Technology<br />
12.5%<br />
Health Care<br />
Industrials<br />
Consumer Discretionary<br />
9.7%<br />
9.6%<br />
10.5%<br />
Consumer Staples<br />
Energy<br />
8.1%<br />
8.0%<br />
Materials<br />
6.1%<br />
Residential Mortgage-<br />
Backed Securities<br />
U.S. Government<br />
Agency Obligations<br />
3.4%<br />
3.1%<br />
Portfolio holdings and allocations are subject to change. Percentages are as of March 31, 2014, and<br />
are based on the total market value of investments.<br />
54
Portfolio of Investments (continued)<br />
TOTAL RETURN FUND<br />
March 31, 2014<br />
Shares Security Value<br />
COMMON STOCKS—59.2%<br />
Consumer Discretionary—8.3%<br />
51,900 Best Buy Company, Inc. $ 1,370,679<br />
63,500 BorgWarner, Inc. 3,903,345<br />
98,600 CBS Corporation – Class “B” 6,093,480<br />
12,300 Dana Holding Corporation 286,221<br />
78,200 Delphi Automotive, PLC 5,306,652<br />
62,500 * Express, Inc. 992,500<br />
1,700 Extended Stay America, Inc. 38,709<br />
129,200 Ford Motor Company 2,015,520<br />
33,700 GNC Holdings, Inc. – Class “A” 1,483,474<br />
39,200 Harman International Industries, Inc. 4,170,880<br />
44,800 Home Depot, Inc. 3,545,024<br />
64,000 * Jarden Corporation 3,829,120<br />
81,000 L Brands, Inc. 4,598,370<br />
33,900 Lear Corporation 2,838,108<br />
39,200 Macy’s, Inc. 2,324,168<br />
25,300 McDonald’s Corporation 2,480,159<br />
82,100 Newell Rubbermaid, Inc. 2,454,790<br />
77,800 * Orient-Express Hotels, Ltd. – Class “A” 1,121,098<br />
15,300 Penske Automotive Group, Inc. 654,228<br />
113,600 Pier 1 Imports, Inc. 2,144,768<br />
27,600 * Steiner Leisure, Ltd. 1,276,500<br />
32,000 * TRW Automotive Holdings Corporation 2,611,840<br />
30,600 Tupperware Brands Corporation 2,563,056<br />
1,400 * Vince Holding Corporation 36,904<br />
10,000 Walt Disney Company 800,700<br />
34,960 Wyndham Worldwide Corporation 2,560,121<br />
61,500,414<br />
Consumer Staples—5.2%<br />
114,000 Altria Group, Inc. 4,267,020<br />
64,400 Avon Products, Inc. 942,816<br />
111,800 Coca-Cola Company 4,322,188<br />
72,700 CVS Caremark Corporation 5,442,322<br />
53,700 Herbalife, Ltd. 3,075,399<br />
76,200 Nu Skin Enterprises, Inc. – Class “A” 6,313,170<br />
32,400 PepsiCo, Inc. 2,705,400<br />
70,300 Philip Morris International, Inc. 5,755,461<br />
31,700 Procter & Gamble Company 2,555,020<br />
38,600 Wal-Mart Stores, Inc. 2,950,198<br />
38,328,994<br />
55
Portfolio of Investments (continued)<br />
TOTAL RETURN FUND<br />
March 31, 2014<br />
Shares Security Value<br />
Energy—5.9%<br />
34,900 Anadarko Petroleum Corporation $ 2,958,124<br />
25,200 Chevron Corporation 2,996,532<br />
59,600 ConocoPhillips 4,192,860<br />
63,200 Devon Energy Corporation 4,229,976<br />
36,200 Ensco, PLC – Class “A” 1,910,636<br />
58,400 ExxonMobil Corporation 5,704,512<br />
8,200 Hess Corporation 679,616<br />
1,897 Hugoton Royalty Trust 15,309<br />
89,886 Marathon Oil Corporation 3,192,751<br />
36,843 Marathon Petroleum Corporation 3,206,815<br />
41,800 National Oilwell Varco, Inc. 3,254,966<br />
68,800 Noble Corporation, PLC 2,252,512<br />
25,800 Occidental Petroleum Corporation 2,458,482<br />
29,700 Phillips 66 2,288,682<br />
12,200 Schlumberger, Ltd. 1,189,500<br />
91,800 Suncor Energy, Inc. 3,209,328<br />
43,740,601<br />
Financials—6.3%<br />
58,300 American Express Company 5,248,749<br />
35,400 Ameriprise Financial, Inc. 3,896,478<br />
30,400 Armada Hoffler Properties, Inc. (REIT) 305,216<br />
139,100 Brixmor Property Group, Inc. (REIT) 2,967,003<br />
69,350 Discover Financial Services 4,035,476<br />
25,300 Financial Select Sector SPDR Fund (ETF) 565,202<br />
56,900 <strong>First</strong>Merit Corporation 1,185,227<br />
47,400 * Health Insurance Innovations, Inc. – Class “A” 490,116<br />
22,100 Invesco, Ltd. 817,700<br />
102,100 JPMorgan Chase & Company 6,198,491<br />
26,000 MetLife, Inc. 1,372,800<br />
25,600 Morgan Stanley 797,952<br />
42,400 PNC Financial Services Group, Inc. 3,688,800<br />
19,300 SPDR S&P 500 ETF Trust (ETF) 3,609,872<br />
25,300 SPDR S&P Regional Banking (ETF) 1,046,914<br />
91,372 Sunstone Hotel <strong>Investors</strong>, Inc. (REIT) 1,254,537<br />
90,900 U.S. Bancorp 3,895,974<br />
109,700 Urstadt Biddle Properties, Inc. – Class “A” (REIT) 2,266,402<br />
61,100 Wells Fargo & Company 3,039,114<br />
46,682,023<br />
56
Shares Security Value<br />
Health Care—9.2%<br />
102,600 Abbott Laboratories $ 3,951,126<br />
58,700 AbbVie, Inc. 3,017,180<br />
38,304 * Actavis, PLC 7,884,878<br />
45,700 Baxter International, Inc. 3,362,606<br />
19,000 Covidien, PLC 1,399,540<br />
51,117 * Express Scripts Holding Company 3,838,376<br />
123,300 * Gilead Sciences, Inc. 8,737,038<br />
69,600 Johnson & Johnson 6,836,808<br />
2,600 * Mallinckrodt, PLC 164,866<br />
17,700 McKesson Corporation 3,125,289<br />
83,300 Merck & Company, Inc. 4,728,941<br />
39,600 Omnicare, Inc. 2,362,932<br />
211,934 Pfizer, Inc. 6,807,320<br />
35,100 * Salix Pharmaceuticals, Ltd. 3,636,711<br />
65,700 Thermo Fisher Scientific, Inc. 7,899,768<br />
27,972 Zoetis, Inc. 809,510<br />
68,562,889<br />
Industrials—7.7%<br />
45,600 3M Company 6,186,096<br />
58,200 ADT Corporation 1,743,090<br />
63,100 Altra Industrial Motion Corporation 2,252,670<br />
22,300 * Armstrong World Industries, Inc. 1,187,475<br />
19,300 Caterpillar, Inc. 1,917,841<br />
45,600 Chicago Bridge & Iron Company NV – NY Shares 3,974,040<br />
38,900 Dover Corporation 3,180,075<br />
41,300 Generac Holdings, Inc. 2,435,461<br />
98,000 General Electric Company 2,537,220<br />
53,500 Honeywell International, Inc. 4,962,660<br />
45,100 ITT Corporation 1,928,476<br />
4,800 Lockheed Martin Corporation 783,552<br />
31,500 Pentair, Ltd. 2,499,210<br />
37,000 Ryder System, Inc. 2,957,040<br />
25,300 Snap-On, Inc. 2,871,044<br />
58,200 * TAL International Group, Inc. 2,495,034<br />
27,800 Textainer Group Holdings, Ltd. 1,063,906<br />
84,100 Textron, Inc. 3,304,289<br />
96,675 Tyco International, Ltd. 4,099,020<br />
2,600 * United Rentals, Inc. 246,844<br />
39,200 United Technologies Corporation 4,580,128<br />
57,205,171<br />
57
Portfolio of Investments (continued)<br />
TOTAL RETURN FUND<br />
March 31, 2014<br />
Shares Security Value<br />
Information Technology—11.8%<br />
13,000 Apple, Inc. $ 6,977,620<br />
89,500 * ARRIS Group, Inc. 2,522,110<br />
78,500 Avago Technologies, Ltd. 5,056,185<br />
62,300 * Blackhawk Network Holdings, Inc. 1,519,497<br />
103,300 CDW Corporation 2,834,552<br />
225,700 Cisco Systems, Inc. 5,057,937<br />
25,600 * eBay, Inc. 1,414,144<br />
208,200 EMC Corporation 5,706,762<br />
122,000 Hewlett-Packard Company 3,947,920<br />
150,500 Intel Corporation 3,884,405<br />
38,900 International Business Machines Corporation 7,487,861<br />
105,900 Intersil Corporation – Class “A” 1,368,228<br />
123,200 * Juniper Networks, Inc. 3,173,632<br />
15,050 * Knowles Corporation 475,128<br />
149,600 Mentor Graphics Corporation 3,294,192<br />
81,900 Methode Electronics, Inc. 2,511,054<br />
224,000 Microsoft Corporation 9,181,760<br />
49,900 * NeuStar, Inc. – Class “A” 1,622,249<br />
89,500 Oracle Corporation 3,661,445<br />
37,900 * PTC, Inc. 1,342,797<br />
73,400 QUALCOMM, Inc. 5,788,324<br />
115,000 Symantec Corporation 2,296,550<br />
65,200 * Take-Two Interactive Software, Inc. 1,429,836<br />
57,000 TE Connectivity, Ltd. 3,431,970<br />
53,200 * Yahoo!, Inc. 1,909,880<br />
87,896,038<br />
Materials—3.2%<br />
40,400 Celanese Corporation – Series “A” 2,242,604<br />
33,000 Cytec Industries, Inc. 3,221,130<br />
109,500 Freeport-McMoRan Copper & Gold, Inc. 3,621,165<br />
63,000 International Paper Company 2,890,440<br />
60,700 LyondellBasell Industries NV – Class “A” 5,398,658<br />
10,200 Praxair, Inc. 1,335,894<br />
35,600 Rock-Tenn Company – Class “A” 3,758,292<br />
34,700 RPM International, Inc. 1,451,848<br />
23,920,031<br />
58
Shares or<br />
Principal<br />
Amount Security Value<br />
Telecommunication Services—1.3%<br />
120,600 AT&T, Inc. $ 4,229,442<br />
110,600 Verizon Communications, Inc. 5,261,242<br />
9,490,684<br />
Utilities—.3%<br />
13,000 Atmos Energy Corporation 612,690<br />
39,300 NiSource, Inc. 1,396,329<br />
2,009,019<br />
Total Value of Common Stocks (cost $262,664,284) 439,335,864<br />
CORPORATE BONDS—23.3%<br />
Aerospace/Defense—.1%<br />
$ 1,000 M BAE Systems Holdings, Inc., 4.95%, 6/1/2014 (a) 1,006,845<br />
Agriculture—.2%<br />
1,000 M Cargill, Inc., 6%, 11/27/2017 (a) 1,143,743<br />
Automotive—.6%<br />
1,000 M Daimler Finance NA, LLC, 2.95%, 1/11/2017 (a) 1,042,716<br />
1,000 M General Motors Co., 3.5%, 10/2/2018 (a) 1,023,750<br />
2,000 M Johnson Controls, Inc., 5%, 3/30/2020 2,222,906<br />
4,289,372<br />
Chemicals—1.1%<br />
2,000 M CF Industries, Inc., 7.125%, 5/1/2020 2,380,916<br />
2,000 M Dow Chemical Co., 4.25%, 11/15/2020 2,121,638<br />
1,000 M Lubrizol Corp., 8.875%, 2/1/2019 1,293,106<br />
2,000 M LyondellBasell Industries NV, 6%, 11/15/2021 2,346,364<br />
8,142,024<br />
Consumer Durables—.2%<br />
1,500 M Newell Rubbermaid, Inc., 4.7%, 8/15/2020 1,601,301<br />
Energy—2.1%<br />
1,500 M Canadian Oil Sands, Ltd., 7.75%, 5/15/2019 (a) 1,823,127<br />
1,000 M DCP Midstream, LLC, 9.75%, 3/15/2019 (a) 1,276,197<br />
2,000 M Enbridge Energy Partners, LP, 4.2%, 9/15/2021 2,073,880<br />
1,000 M Kinder Morgan Energy Partners, LP, 3.45%, 2/15/2023 954,967<br />
1,500 M Nabors Industries, Inc., 6.15%, 2/15/2018 1,698,381<br />
1,000 M Petrobras International Finance Co., 5.375%, 1/27/2021 1,016,321<br />
59
Portfolio of Investments (continued)<br />
TOTAL RETURN FUND<br />
March 31, 2014<br />
Principal<br />
Amount Security Value<br />
Energy (continued)<br />
$ 1,000 M Reliance Holdings USA, Inc., 4.5%, 10/19/2020 (a) $ 1,013,762<br />
500 M Spectra Energy Capital, LLC, 6.2%, 4/15/2018 570,214<br />
1,000 M Suncor Energy, Inc., 6.1%, 6/1/2018 1,156,107<br />
1,500 M Valero Energy Corp., 9.375%, 3/15/2019 1,953,971<br />
1,500 M Weatherford International, Inc., 6.35%, 6/15/2017 1,698,542<br />
15,235,469<br />
Financial Services—3.1%<br />
1,500 M Aflac, Inc., 8.5%, 5/15/2019 1,929,970<br />
American Express Co.:<br />
500 M 6.15%, 8/28/2017 576,770<br />
1,000 M 7%, 3/19/2018 1,187,119<br />
American International Group, Inc.:<br />
750 M 4.875%, 9/15/2016 818,725<br />
750 M 8.25%, 8/15/2018 939,271<br />
1,500 M Ameriprise Financial, Inc., 5.3%, 3/15/2020 1,703,620<br />
1,000 M Berkshire Hathaway, Inc., 3.4%, 1/31/2022 1,026,321<br />
2,000 M BlackRock, Inc., 5%, 12/10/2019 2,259,288<br />
1,000 M CoBank, ACB, 7.875%, 4/16/2018 (a) 1,198,465<br />
1,000 M ERAC USA Finance Co., 4.5%, 8/16/2021 (a) 1,064,468<br />
2,000 M Ford Motor Credit Co., LLC, 8.125%, 1/15/2020 2,525,012<br />
General Electric Capital Corp.:<br />
1,000 M 5.625%, 9/15/2017 1,135,510<br />
2,000 M 5.3%, 2/11/2021 2,252,766<br />
1,000 M Harley-Davidson Funding Corp., 5.75%, 12/15/2014 (a) 1,034,434<br />
1,000 M Liberty Mutual Group, Inc., 4.95%, 5/1/2022 (a) 1,072,171<br />
1,000 M Protective Life Corp., 7.375%, 10/15/2019 1,215,457<br />
1,000 M Prudential Financial, Inc., 7.375%, 6/15/2019 1,226,612<br />
23,165,979<br />
Financials—4.2%<br />
Bank of America Corp.:<br />
3,500 M 5.65%, 5/1/2018 3,960,166<br />
1,000 M 5%, 5/13/2021 1,104,308<br />
Barclays Bank, PLC:<br />
2,500 M 6.75%, 5/22/2019 3,002,837<br />
1,000 M 5.125%, 1/8/2020 1,120,855<br />
3,500 M Citigroup, Inc., 6.125%, 11/21/2017 4,010,867<br />
Goldman Sachs Group, Inc.:<br />
2,600 M 5.375%, 3/15/2020 2,904,647<br />
1,000 M 3.625%, 1/22/2023 985,542<br />
60
Principal<br />
Amount Security Value<br />
Financials (continued)<br />
JPMorgan Chase & Co.:<br />
$ 2,500 M 6%, 1/15/2018 $ 2,871,748<br />
1,000 M 4.5%, 1/24/2022 1,079,865<br />
Morgan Stanley:<br />
2,050 M 6.625%, 4/1/2018 2,391,944<br />
1,000 M 5.5%, 7/28/2021 1,131,595<br />
1,000 M Siemens Financieringsmaatschappij NV, 5.75%, 10/17/2016 (a) 1,118,822<br />
1,000 M SunTrust Banks, Inc., 6%, 9/11/2017 1,140,012<br />
1,000 M UBS AG, 4.875%, 8/4/2020 1,108,854<br />
3,000 M Wells Fargo & Co., 4.6%, 4/1/2021 3,306,912<br />
31,238,974<br />
Food/Beverage/Tobacco—2.5%<br />
1,500 M Altria Group, Inc., 9.7%, 11/10/2018 1,970,838<br />
Anheuser-Busch InBev Worldwide, Inc.:<br />
1,000 M 6.875%, 11/15/2019 1,223,988<br />
500 M 5.375%, 1/15/2020 574,716<br />
1,000 M Bottling Group, LLC, 5.125%, 1/15/2019 1,129,339<br />
1,750 M Bunge Ltd. Finance Corp., 8.5%, 6/15/2019 2,161,948<br />
1,000 M ConAgra Foods, Inc., 5.875%, 4/15/2014 1,001,837<br />
1,500 M Diageo Capital, PLC, 5.75%, 10/23/2017 1,720,255<br />
1,500 M Dr. Pepper Snapple Group, Inc., 6.82%, 5/1/2018 1,757,545<br />
1,000 M Ingredion, Inc., 4.625%, 11/1/2020 1,062,151<br />
1,500 M Lorillard Tobacco Co., 6.875%, 5/1/2020 1,756,461<br />
1,000 M Mead Johnson Nutrition Co., 4.9%, 11/1/2019 1,093,857<br />
1,000 M Philip Morris International, Inc., 5.65%, 5/16/2018 1,147,611<br />
1,500 M SABMiller Holdings, Inc., 3.75%, 1/15/2022 (a) 1,535,643<br />
18,136,189<br />
Forest Products/Containers—.4%<br />
2,000 M International Paper Co., 9.375%, 5/15/2019 2,614,178<br />
Health Care—1.2%<br />
2,000 M Biogen IDEC, Inc., 6.875%, 3/1/2018 2,356,200<br />
1,500 M Express Scripts Holding Co., 4.75%, 11/15/2021 1,632,792<br />
1,000 M Laboratory Corp. of America Holdings, 3.75%, 8/23/2022 995,029<br />
1,000 M Mylan, Inc., 3.125%, 1/15/2023 (a) 949,280<br />
1,000 M Novartis Securities Investments, Ltd., 5.125%, 2/10/2019 1,136,544<br />
1,000 M Quest Diagnostics, Inc., 6.4%, 7/1/2017 1,135,699<br />
688 M Roche Holdings, Inc., 6%, 3/1/2019 (a) 809,180<br />
9,014,724<br />
61
Portfolio of Investments (continued)<br />
TOTAL RETURN FUND<br />
March 31, 2014<br />
Principal<br />
Amount Security Value<br />
Information Technology—.6%<br />
$ 1,500 M Harris Corp., 4.4%, 12/15/2020 $ 1,582,094<br />
1,500 M Motorola Solutions, Inc., 6%, 11/15/2017 1,715,981<br />
1,500 M Symantec Corp., 3.95%, 6/15/2022 1,489,614<br />
4,787,689<br />
Manufacturing—.8%<br />
2,000 M CRH America, Inc., 8.125%, 7/15/2018 2,444,454<br />
1,000 M Ingersoll-Rand Global Holdings Co., Ltd., 6.875%, 8/15/2018 1,176,412<br />
1,000 M John Deere Capital Corp., 5.35%, 4/3/2018 1,132,014<br />
1,000 M Tyco Electronics Group SA, 6.55%, 10/1/2017 1,157,294<br />
5,910,174<br />
Media-Broadcasting—.9%<br />
1,000 M British Sky Broadcasting Group, PLC, 9.5%, 11/15/2018 (a) 1,298,982<br />
1,750 M CBS Corp., 8.875%, 5/15/2019 2,246,055<br />
2,000 M Comcast Corp., 5.15%, 3/1/2020 2,267,586<br />
1,000 M DirecTV Holdings, LLC, 3.8%, 3/15/2022 991,222<br />
6,803,845<br />
Media-Diversified—.1%<br />
1,000 M McGraw-Hill Financial, Inc., 5.9%, 11/15/2017 1,110,160<br />
Metals/Mining—1.2%<br />
1,500 M Alcoa, Inc., 6.15%, 8/15/2020 1,636,767<br />
1,500 M ArcelorMittal, 6.125%, 6/1/2018 1,650,000<br />
1,500 M Newmont Mining Corp., 5.125%, 10/1/2019 1,597,221<br />
1,500 M Rio Tinto Finance USA, Ltd., 3.75%, 9/20/2021 1,547,390<br />
1,500 M Vale Overseas, Ltd., 5.625%, 9/15/2019 1,664,262<br />
1,000 M Xstrata Finance Canada, Ltd., 4.95%, 11/15/2021 (a) 1,035,261<br />
9,130,901<br />
Real Estate Investment Trusts—1.2%<br />
1,500 M Boston Properties, LP, 5.875%, 10/15/2019 1,732,695<br />
1,500 M Digital Realty Trust, LP, 5.25%, 3/15/2021 1,579,324<br />
HCP, Inc.:<br />
500 M 6.7%, 1/30/2018 583,961<br />
1,000 M 5.375%, 2/1/2021 1,121,199<br />
62
Principal<br />
Amount Security Value<br />
Real Estate Investment Trusts (continued)<br />
$ 1,000 M ProLogis, LP, 6.625%, 5/15/2018 $ 1,164,629<br />
1,000 M Simon Property Group, LP, 5.75%, 12/1/2015 1,071,736<br />
1,500 M Ventas Realty, LP, 4.75%, 6/1/2021 1,619,051<br />
8,872,595<br />
Retail-General Merchandise—.4%<br />
1,500 M Gap, Inc., 5.95%, 4/12/2021 1,691,337<br />
1,000 M Home Depot, Inc., 5.875%, 12/16/2036 1,208,553<br />
2,899,890<br />
Telecommunications—.1%<br />
1,000 M Rogers Communications, Inc., 3%, 3/15/2023 941,269<br />
Transportation—.6%<br />
1,000 M Burlington North Santa Fe, LLC, 5.15%, 9/1/2043 1,063,957<br />
1,000 M Con-way, Inc., 7.25%, 1/15/2018 1,166,994<br />
1,000 M GATX Corp., 4.75%, 6/15/2022 1,066,386<br />
1,000 M Penske Truck Leasing Co., LP, 4.875%, 7/11/2022 (a) 1,061,096<br />
4,358,433<br />
Utilities—1.6%<br />
925 M Arizona Public Service Co., 8.75%, 3/1/2019 1,184,351<br />
1,000 M Atmos Energy Corp., 8.5%, 3/15/2019 1,277,358<br />
1,000 M E.ON International Finance BV, 5.8%, 4/30/2018 (a) 1,137,299<br />
1,000 M Electricite de France SA, 6.5%, 1/26/2019 (a) 1,184,977<br />
1,500 M Exelon Generation Co., LLC, 5.2%, 10/1/2019 1,641,632<br />
357 M Great River Energy Co., 5.829%, 7/1/2017 (a) 384,722<br />
1,000 M National Fuel Gas Co., 8.75%, 5/1/2019 1,255,152<br />
2,000 M Ohio Power Co., 5.375%, 10/1/2021 2,312,420<br />
1,000 M Sempra Energy, 9.8%, 2/15/2019 1,325,656<br />
11,703,567<br />
Waste Management—.1%<br />
1,000 M Republic Services, Inc., 3.8%, 5/15/2018 1,061,145<br />
Total Value of Corporate Bonds (cost $165,804,687) 173,168,466<br />
63
Portfolio of Investments (continued)<br />
TOTAL RETURN FUND<br />
March 31, 2014<br />
Principal<br />
Amount Security Value<br />
RESIDENTIAL MORTGAGE-BACKED<br />
SECURITIES—3.3%<br />
Fannie Mae—2.5%<br />
$ 2,208 M 3%, 3/1/2027 – 7/1/2027 $ 2,270,857<br />
1,523 M 3.5%, 10/1/2025 1,627,889<br />
4,231 M 4%, 4/16/2029 – 10/1/2041 (b) 4,422,804<br />
4,137 M 5%, 3/1/2034 – 11/1/2040 4,546,716<br />
3,588 M 5.5%, 5/1/2033 – 10/1/2039 3,982,279<br />
645 M 6%, 5/1/2036 – 8/1/2037 720,413<br />
545 M 6.5%, 11/1/2033 – 6/1/2036 612,305<br />
670 M 7%, 3/1/2032 – 8/1/2032 741,327<br />
18,924,590<br />
Freddie Mac—.8%<br />
931 M 3.5%, 9/1/2032 972,050<br />
961 M 4%, 11/1/2040 1,011,337<br />
1,252 M 4.5%, 10/1/2040 1,345,364<br />
2,039 M 5.5%, 5/1/2038 – 10/1/2039 2,267,548<br />
268 M 6%, 9/1/2032 – 6/1/2035 298,052<br />
5,894,351<br />
Total Value of Residential Mortgage-Backed Securities (cost $24,136,492) 24,818,941<br />
U.S. GOVERNMENT AGENCY<br />
OBLIGATIONS—3.2%<br />
17,500 M Fannie Mae, 1.625%, 11/27/2018 17,448,113<br />
Federal Farm Credit Bank:<br />
1,000 M 2.68%, 7/30/2020 1,000,267<br />
1,000 M 2.79%, 11/12/2020 1,007,378<br />
Freddie Mac:<br />
1,000 M 5.125%, 10/18/2016 1,112,578<br />
1,000 M 1.25%, 5/12/2017 1,008,508<br />
1,500 M 5.125%, 11/17/2017 1,707,000<br />
Total Value of U.S. Government Agency Obligations (cost $23,158,623) 23,283,844<br />
U.S. GOVERNMENT OBLIGATIONS—1.8%<br />
13,500 M U.S. Treasury Notes, 1.375%, 12/31/2018 (cost $13,373,371) 13,329,144<br />
64
Principal<br />
Amount Security Value<br />
SHORT-TERM U.S. GOVERNMENT<br />
OBLIGATIONS—6.7%<br />
U.S. Treasury Bills:<br />
$ 5,000 M 0.036%, 4/3/2014 $ 4,999,990<br />
3,000 M 0.02%, 4/17/2014 2,999,973<br />
16,000 M 0.04%, 4/17/2014 15,999,716<br />
16,000 M 0.0405%, 4/17/2014 15,999,712<br />
10,000 M 0.0605%, 4/24/2014 9,999,613<br />
Total Value of Short-Term U.S. Government Obligations (cost $49,999,004) 49,999,004<br />
SHORT-TERM U.S. GOVERNMENT AGENCY<br />
OBLIGATIONS—2.1%<br />
Federal Home Loan Bank:<br />
1,734 M 0.04%, 4/9/2014 1,733,985<br />
5,000 M 0.04%, 4/10/2014 4,999,950<br />
4,000 M 0.05%, 4/21/2014 3,999,889<br />
5,000 M 0.065%, 4/25/2014 4,999,783<br />
Total Value of Short-Term U.S. Government Agency Obligations (cost $15,733,607) 15,733,607<br />
Total Value of Investments (cost $554,870,068) 99.6% 739,668,870<br />
Other Assets, Less Liabilities .4 2,951,731<br />
Net Assets 100.0% $742,620,601<br />
* Non-income producing<br />
(a) Security exempt from registration under Rule 144A of the Securities Act of 1933 (see Note 4).<br />
(b) A portion or all of the security purchased on a when-issued or delayed delivery basis<br />
(see Note 1G).<br />
Summary of Abbreviations:<br />
ETF Exchange Traded Fund<br />
REIT Real Estate Investment Trust<br />
65
Portfolio of Investments (continued)<br />
TOTAL RETURN FUND<br />
March 31, 2014<br />
Accounting Standards Codification 820 established a three-tier hierarchy of inputs to establish a classification<br />
of fair value measurements for disclosure purposes. The three-tier hierarchy of inputs is summarized<br />
in the three broad Levels listed below:<br />
Level 1 — Unadjusted quoted prices in active markets for identical securities that the Fund has<br />
the ability to access.<br />
Level 2 — Observable inputs other than quoted prices included in Level 1 that are observable<br />
for the asset or liability, either directly or indirectly. These inputs may include quoted<br />
prices for the identical instrument on an inactive market, prices for similar instruments,<br />
interest rates, prepayment speeds, credit risk, yield curves, default rates and<br />
similar data.<br />
Level 3 — Unobservable inputs for the asset or liability, to the extent relevant observable inputs<br />
are not available, representing the Fund’s own assumption about the assumptions a<br />
market participant would use in valuing the asset or liability, and would be based on<br />
the best information available.<br />
The inputs methodology used for valuing securities are not necessarily an indication of the risk<br />
associated with investing in those securities. For example, amortized cost approximates the current<br />
fair value of a security, but since the value is not obtained from a quoted price in an active market,<br />
such securities are reflected as Level 2.<br />
The following is a summary, by category of Level, of inputs used to value the Fund’s investments as of<br />
March 31, 2014:<br />
Level 1 Level 2 Level 3 Total<br />
Common Stocks. . . . . . . . . . . . . . $ 439,335,864 $ — $ — $ 439,335,864<br />
Corporate Bonds . . . . . . . . . . . . . — 173,168,466 — 173,168,466<br />
Residential Mortgage-Backed<br />
Securities . . . . . . . . . . . . . . . . . — 24,818,941 — 24,818,941<br />
U.S. Government Agency<br />
Obligations. . . . . . . . . . . . . . . . — 23,283,844 — 23,283,844<br />
U.S. Government Obligations . . . — 13,329,144 — 13,329,144<br />
Short-Term U.S. Government<br />
Agency Obligations . . . . . . . . . — 49,999,004 — 49,999,004<br />
Short-Term U.S. Government<br />
Obligations. . . . . . . . . . . . . . . . — 15,733,607 — 15,733,607<br />
Total Investments in Securities* . . $ 439,335,864 $ 300,333,006 $ — $ 739,668,870<br />
* The Portfolio of Investments provides information on the industry categorization for common stocks<br />
and corporate bonds.<br />
There were no transfers into or from Level 1 and Level 2 by the Fund during the period ended<br />
March 31, 2014. Transfers, if any, between Levels are recognized at the end of the reporting period.<br />
66<br />
See notes to financial statements
Fund Expenses (unaudited)<br />
EQUITY INCOME FUND<br />
The examples below show the ongoing costs (in dollars) of investing in your Fund and will<br />
help you in comparing these costs with costs of other mutual funds. Please refer to page 4 for a<br />
detailed explanation of the information presented in these examples.<br />
Expense Example<br />
Annualized<br />
Expense<br />
Ratio<br />
Beginning<br />
Account Value<br />
(10/1/13)<br />
Ending<br />
Account Value<br />
(3/31/14)<br />
Expenses Paid<br />
During Period<br />
(10/1/13–3/31/14)*<br />
Class A Shares 1.23%<br />
Actual $1,000.00 $1,101.56 $ 6.44<br />
Hypothetical** $1,000.00 $1,018.80 $ 6.19<br />
Class B Shares 2.08%<br />
Actual $1,000.00 $1,096.48 $10.87<br />
Hypothetical** $1,000.00 $1,014.56 $10.45<br />
Advisor Class Shares 1.00%<br />
Actual $1,000.00 $1,101.30 $ 5.24<br />
Hypothetical** $1,000.00 $1,019.94 $ 5.04<br />
Institutional Class Shares 0.81%<br />
Actual $1,000.00 $1,103.07 $ 4.25<br />
Hypothetical** $1,000.00 $1,020.89 $ 4.08<br />
* Expenses are equal to the annualized expense ratio, multiplied by the average account value over<br />
the period, multiplied by 182/365 (to reflect the one-half year period).<br />
**Assumed rate of return of 5% before expenses.<br />
Portfolio Composition<br />
BY SECTOR<br />
Financials<br />
16.2%<br />
Health Care<br />
13.6%<br />
Industrials<br />
Information Technology<br />
Consumer Discretionary<br />
11.8%<br />
11.2%<br />
10.9%<br />
Consumer Staples<br />
9.7%<br />
Energy<br />
8.3%<br />
Utilities<br />
5.4%<br />
Materials<br />
Telecommunication<br />
Services<br />
2.9%<br />
3.8%<br />
Portfolio holdings and allocations are subject to change. Percentages are as of March 31, 2014, and<br />
are based on the total market value of investments.<br />
67
Portfolio of Investments (continued)<br />
EQUITY INCOME FUND<br />
March 31, 2014<br />
Shares Security Value<br />
COMMON STOCKS—93.7%<br />
Consumer Discretionary—11.0%<br />
40,000 BorgWarner, Inc. $ 2,458,800<br />
30,000 CBS Corporation – Class “B” 1,854,000<br />
800 * CBS Outdoor Americas, Inc. (a) 23,400<br />
158,000 Comcast Corporation – Special Shares “A” 7,704,080<br />
70,000 Delphi Automotive, PLC 4,750,200<br />
170,400 Extended Stay America, Inc. 3,880,008<br />
160,000 Ford Motor Company 2,496,000<br />
20,000 GNC Holdings, Inc. – Class “A” 880,400<br />
45,000 Hanesbrands, Inc. 3,441,600<br />
45,000 Harman International Industries, Inc. 4,788,000<br />
42,200 Home Depot, Inc. 3,339,286<br />
34,500 Lowe’s Companies, Inc. 1,687,050<br />
41,100 McDonald’s Corporation 4,029,033<br />
92,400 Newell Rubbermaid, Inc. 2,762,760<br />
124,500 * Orient-Express Hotels, Ltd. – Class “A” 1,794,045<br />
201,900 Regal Entertainment Group – Class “A” 3,771,492<br />
79,633 Time Warner, Inc. 5,202,424<br />
15,000 Tupperware Brands Corporation 1,256,400<br />
41,900 Walt Disney Company 3,354,933<br />
59,473,911<br />
Consumer Staples—9.8%<br />
235,000 Altria Group, Inc. 8,796,050<br />
54,300 Avon Products, Inc. 794,952<br />
53,800 Beam, Inc. 4,481,540<br />
64,200 Coca-Cola Company 2,481,972<br />
91,700 CVS Caremark Corporation 6,864,662<br />
25,000 Dr. Pepper Snapple Group, Inc. 1,361,500<br />
23,300 Kimberly-Clark Corporation 2,568,825<br />
83,066 Kraft Foods Group, Inc. 4,660,003<br />
51,300 Nu Skin Enterprises, Inc. – Class “A” 4,250,205<br />
38,500 PepsiCo, Inc. 3,214,750<br />
82,300 Philip Morris International, Inc. 6,737,901<br />
55,400 Procter & Gamble Company 4,465,240<br />
29,400 Wal-Mart Stores, Inc. 2,247,042<br />
52,924,642<br />
68
Shares Security Value<br />
Energy—8.3%<br />
79,400 Chevron Corporation $ 9,441,454<br />
81,500 ConocoPhillips 5,733,525<br />
59,600 Devon Energy Corporation 3,989,028<br />
52,500 Ensco, PLC – Class “A” 2,770,950<br />
47,400 ExxonMobil Corporation 4,630,032<br />
99,600 Marathon Oil Corporation 3,537,792<br />
28,000 Marathon Petroleum Corporation 2,437,120<br />
10,000 National Oilwell Varco, Inc. 778,700<br />
25,400 Noble Corporation, PLC 831,596<br />
69,500 Occidental Petroleum Corporation 6,622,655<br />
40,500 Royal Dutch Shell, PLC – Class “A” (ADR) 2,958,930<br />
46,000 Seadrill, Ltd. 1,617,360<br />
45,349,142<br />
Financials—15.9%<br />
52,600 ACE, Ltd. 5,210,556<br />
35,000 American Express Company 3,151,050<br />
16,300 Ameriprise Financial, Inc. 1,794,141<br />
122,200 Armada Hoffler Properties, Inc. (REIT) 1,226,888<br />
123,000 Berkshire Hills Bancorp, Inc. 3,183,240<br />
132,200 Brixmor Property Group, Inc. (REIT) 2,819,826<br />
28,556 Chubb Corporation 2,550,051<br />
75,000 Discover Financial Services 4,364,250<br />
225,000 Financial Select Sector SPDR Fund (ETF) 5,026,500<br />
71,600 <strong>First</strong>Merit Corporation 1,491,428<br />
39,600 Invesco, Ltd. 1,465,200<br />
40,000 iShares S&P U.S. Preferred Stock Index Fund (ETF) 1,561,200<br />
177,800 JPMorgan Chase & Company 10,794,238<br />
85,000 MetLife, Inc. 4,488,000<br />
138,700 Oritani Financial Corporation 2,192,847<br />
52,900 PNC Financial Services Group, Inc. 4,602,300<br />
56,500 Protective Life Corporation 2,971,335<br />
104,300 Select Income REIT (REIT) 3,157,161<br />
255,600 Sterling Bancorp 3,235,896<br />
42,800 Travelers Companies, Inc. 3,642,280<br />
93,300 U.S. Bancorp 3,998,838<br />
108,500 Urstadt Biddle Properties, Inc. – Class “A” (REIT) 2,241,610<br />
198,500 Wells Fargo & Company 9,873,390<br />
130,500 Westfield Financial, Inc. 972,225<br />
86,014,450<br />
69
Portfolio of Investments (continued)<br />
EQUITY INCOME FUND<br />
March 31, 2014<br />
Shares Security Value<br />
Health Care—13.6%<br />
43,600 Abbott Laboratories $ 1,679,036<br />
86,100 AbbVie, Inc. 4,425,540<br />
32,240 * Actavis, PLC 6,636,604<br />
54,600 Baxter International, Inc. 4,017,468<br />
45,000 Covidien, PLC 3,314,700<br />
67,400 GlaxoSmithKline, PLC (ADR) 3,601,182<br />
113,900 Johnson & Johnson 11,188,397<br />
22,000 McKesson Corporation 3,884,540<br />
195,211 Merck & Company, Inc. 11,082,128<br />
16,500 Novartis AG (ADR) 1,402,830<br />
55,000 Omnicare, Inc. 3,281,850<br />
359,224 Pfizer, Inc. 11,538,275<br />
59,700 * Prestige Brands Holdings, Inc. 1,626,825<br />
40,500 Thermo Fisher Scientific, Inc. 4,869,720<br />
41,952 Zoetis, Inc. 1,214,091<br />
73,763,186<br />
Industrials—11.8%<br />
38,600 3M Company 5,236,476<br />
40,000 A.O. Smith Corporation 1,840,800<br />
64,537 ADT Corporation 1,932,883<br />
48,000 Altra Industrial Motion Corporation 1,713,600<br />
40,000 Chicago Bridge & Iron Company NV – NY Shares 3,486,000<br />
19,600 Dover Corporation 1,602,300<br />
30,000 Eaton Corporation, PLC 2,253,600<br />
40,000 G&K Services, Inc. – Class “A” 2,446,800<br />
50,000 Generac Holdings, Inc. 2,948,500<br />
17,800 General Dynamics Corporation 1,938,776<br />
371,800 General Electric Company 9,625,902<br />
71,900 Honeywell International, Inc. 6,669,444<br />
61,450 ITT Corporation 2,627,602<br />
101,300 Kforce, Inc. 2,159,716<br />
26,372 Pentair, Ltd. 2,092,354<br />
20,000 Snap-On, Inc. 2,269,600<br />
23,800 * TAL International Group, Inc. 1,020,306<br />
79,075 Tyco International, Ltd. 3,352,780<br />
31,700 United Parcel Service, Inc. – Class “B” 3,086,946<br />
47,500 United Technologies Corporation 5,549,900<br />
63,854,285<br />
70
Shares Security Value<br />
Information Technology—11.2%<br />
9,700 Apple, Inc. $ 5,206,378<br />
21,600 Automatic Data Processing, Inc. 1,668,816<br />
60,000 Avago Technologies, Ltd. 3,864,600<br />
307,000 Cisco Systems, Inc. 6,879,870<br />
309,700 Intel Corporation 7,993,357<br />
81,700 Intersil Corporation – Class “A” 1,055,564<br />
155,000 * Juniper Networks, Inc. 3,992,800<br />
144,100 Mentor Graphics Corporation 3,173,082<br />
101,800 Methode Electronics, Inc. 3,121,188<br />
105,000 Microchip Technology, Inc. 5,014,800<br />
240,000 Microsoft Corporation 9,837,600<br />
50,000 Oracle Corporation 2,045,500<br />
55,300 QUALCOMM, Inc. 4,360,958<br />
39,200 TE Connectivity, Ltd. 2,360,232<br />
60,574,745<br />
Materials—3.8%<br />
13,300 Cytec Industries, Inc. 1,298,213<br />
66,900 Dow Chemical Company 3,250,671<br />
50,100 DuPont (E.I.) de Nemours & Company 3,361,710<br />
76,200 Freeport-McMoRan Copper & Gold, Inc. 2,519,934<br />
45,400 International Paper Company 2,082,952<br />
51,700 LyondellBasell Industries NV – Class “A” 4,598,198<br />
13,000 Rock-Tenn Company – Class “A” 1,372,410<br />
35,000 Westlake Chemical Corporation 2,316,300<br />
20,800,388<br />
Telecommunication Services—2.9%<br />
165,730 AT&T, Inc. 5,812,151<br />
136,500 NTELOS Holdings Corporation 1,842,750<br />
167,300 Verizon Communications, Inc. 7,958,461<br />
15,613,362<br />
Utilities—5.4%<br />
97,000 American Electric Power Company, Inc. 4,914,020<br />
32,500 Dominion Resources, Inc. 2,307,175<br />
45,000 Duke Energy Corporation 3,204,900<br />
45,100 NextEra Energy, Inc. 4,312,462<br />
125,900 NiSource, Inc. 4,473,227<br />
71
Portfolio of Investments (continued)<br />
EQUITY INCOME FUND<br />
March 31, 2014<br />
Shares or<br />
Principal<br />
Amount Security Value<br />
Utilities (continued)<br />
69,000 Portland General Electric Company $ 2,231,460<br />
110,000 PPL Corporation 3,645,400<br />
106,400 Vectren Corporation 4,191,096<br />
29,279,740<br />
Total Value of Common Stocks (cost $360,245,761) 507,647,851<br />
PREFERRED STOCKS—.4%<br />
Financials<br />
50,500 Digital Realty Trust, Inc., Series G, 5.875%, 2049 (REIT) 1,028,180<br />
46,000 Urstadt Biddle Properties, Inc., Series F, 7.125%, 2049 (REIT) 1,129,300<br />
Total Value of Preferred Stocks (cost $2,403,576) 2,157,480<br />
SHORT-TERM U.S. GOVERNMENT AGENCY<br />
OBLIGATIONS—3.9%<br />
Federal Home Loan Bank:<br />
$1,100 M 0.04%, 4/9/2014 1,099,990<br />
6,000 M 0.045%, 4/11/2014 5,999,925<br />
3,000 M 0.05%, 4/21/2014 2,999,917<br />
8,000 M 0.04%, 4/23/2014 7,999,804<br />
3,000 M 0.065%, 4/25/2014 2,999,870<br />
Total Value of Short-Term U.S. Government Agency Obligations (cost $21,099,506) 21,099,506<br />
SHORT-TERM U.S. GOVERNMENT<br />
OBLIGATIONS—2.3%<br />
U.S. Treasury Bills:<br />
2,500 M 0.036%, 4/3/2014 2,499,995<br />
2,000 M 0.02%, 4/17/2014 1,999,982<br />
8,000 M 0.04%, 4/17/2014 7,999,858<br />
Total Value of Short-Term U.S. Government Obligations (cost $12,499,835) 12,499,835<br />
Total Value of Investments (cost $396,248,678) 100.3% 543,404,672<br />
Excess of Liabilities Over Other Assets (.3) (1,667,514)<br />
Net Assets 100.0% $541,737,158<br />
72
* Non-income producing<br />
(a) A portion or all of the security purchased on a when-issued or delayed delivery basis<br />
(see Note 1G).<br />
Summary of Abbreviations:<br />
ADR American Depositary Receipts<br />
ETF Exchange Traded Fund<br />
REIT Real Estate Investment Trust<br />
73
Portfolio of Investments (continued)<br />
EQUITY INCOME FUND<br />
March 31, 2014<br />
Accounting Standards Codification 820 established a three-tier hierarchy of inputs to establish a<br />
classification of fair value measurements for disclosure purposes. The three-tier hierarchy of inputs is<br />
summarized in the three broad Levels listed below:<br />
Level 1 — Unadjusted quoted prices in active markets for identical securities that the Fund has<br />
the ability to access.<br />
Level 2 — Observable inputs other than quoted prices included in Level 1 that are observable<br />
for the asset or liability, either directly or indirectly. These inputs may include<br />
quoted prices for the identical instrument on an inactive market, prices for similar<br />
instruments, interest rates, prepayment speeds, credit risk, yield curves, default rates<br />
and similar data.<br />
Level 3 — Unobservable inputs for the asset or liability, to the extent relevant observable inputs<br />
are not available, representing the Fund’s own assumption about the assumptions a<br />
market participant would use in valuing the asset or liability, and would be based on<br />
the best information available.<br />
The inputs methodology used for valuing securities are not necessarily an indication of the risk<br />
associated with investing in those securities. For example, amortized cost approximates the current<br />
fair value of a security, but since the value is not obtained from a quoted price in an active market,<br />
such securities are reflected as Level 2.<br />
The following is a summary, by category of Level, of inputs used to value the Fund’s investments as of<br />
March 31, 2014:<br />
Level 1 Level 2 Level 3 Total<br />
Common Stocks. . . . . . . . . . . . . . $ 507,647,851 $ — $ — $ 507,647,851<br />
Preferred Stocks. . . . . . . . . . . . . . 2,157,480 — — 2,157,480<br />
Short-Term U.S. Government<br />
Agency Obligations . . . . . . . . . — 21,099,506 — 21,099,506<br />
Short-Term U.S. Government<br />
Obligations. . . . . . . . . . . . . . . . — 12,499,835 — 12,499,835<br />
Total Investments in Securities* . . $ 509,805,331 $ 33,599,341 $ — $ 543,404,672<br />
* The Portfolio of Investments provides information on the industry categorization for common stocks<br />
and preferred stocks.<br />
There were no transfers into or from Level 1 and Level 2 by the Fund during the period ended<br />
March 31, 2014. Transfers, if any, between Levels are recognized at the end of the reporting period.<br />
74<br />
See notes to financial statements
Fund Expenses (unaudited)<br />
GROWTH & INCOME FUND<br />
The examples below show the ongoing costs (in dollars) of investing in your Fund and will<br />
help you in comparing these costs with costs of other mutual funds. Please refer to page 4 for a<br />
detailed explanation of the information presented in these examples.<br />
Expense Example<br />
Annualized<br />
Expense<br />
Ratio<br />
Beginning<br />
Account Value<br />
(10/1/13)<br />
Ending<br />
Account Value<br />
(3/31/14)<br />
Expenses Paid<br />
During Period<br />
(10/1/13–3/31/14)*<br />
Class A Shares 1.15%<br />
Actual $1,000.00 $1,106.87 $ 6.04<br />
Hypothetical** $1,000.00 $1,019.20 $ 5.79<br />
Class B Shares 1.96%<br />
Actual $1,000.00 $1,101.91 $10.27<br />
Hypothetical** $1,000.00 $1,015.16 $ 9.85<br />
Advisor Class Shares 0.93%<br />
Actual $1,000.00 $1,108.52 $ 4.89<br />
Hypothetical** $1,000.00 $1,020.29 $ 4.68<br />
Institutional Class Shares 0.75%<br />
Actual $1,000.00 $1,109.15 $ 3.94<br />
Hypothetical** $1,000.00 $1,021.19 $ 3.78<br />
* Expenses are equal to the annualized expense ratio, multiplied by the average account value over<br />
the period, multiplied by 182/365 (to reflect the one-half year period).<br />
**Assumed rate of return of 5% before expenses.<br />
Portfolio Composition<br />
BY SECTOR<br />
Information Technology<br />
19.7%<br />
Health Care<br />
Consumer Discretionary<br />
Industrials<br />
12.9%<br />
14.4%<br />
15.4%<br />
Financials<br />
Energy<br />
10.5%<br />
10.1%<br />
Consumer Staples<br />
8.7%<br />
Materials<br />
5.4%<br />
Telecommunication<br />
Services<br />
2.1%<br />
Utilities<br />
0.5%<br />
Portfolio holdings and allocations are subject to change. Percentages are as of March 31, 2014, and<br />
are based on the total market value of investments.<br />
75
Portfolio of Investments (continued)<br />
GROWTH & INCOME FUND<br />
March 31, 2014<br />
76<br />
Shares Security Value<br />
COMMON STOCKS—99.5%<br />
Consumer Discretionary—14.4%<br />
205,000 Best Buy Company, Inc. $ 5,414,050<br />
250,000 BorgWarner, Inc. 15,367,500<br />
390,000 CBS Corporation – Class “B” 24,102,000<br />
50,000 Dana Holding Corporation 1,163,500<br />
305,000 Delphi Automotive, PLC 20,697,300<br />
240,000 * Express, Inc. 3,811,200<br />
6,600 Extended Stay America, Inc. 150,282<br />
500,000 Ford Motor Company 7,800,000<br />
135,000 GNC Holdings, Inc. – Class “A” 5,942,700<br />
150,000 Harman International Industries, Inc. 15,960,000<br />
180,000 Home Depot, Inc. 14,243,400<br />
250,000 * Jarden Corporation 14,957,500<br />
315,000 L Brands, Inc. 17,882,550<br />
130,000 Lear Corporation 10,883,600<br />
151,800 Macy’s, Inc. 9,000,222<br />
100,000 McDonald’s Corporation 9,803,000<br />
325,000 Newell Rubbermaid, Inc. 9,717,500<br />
307,900 * Orient-Express Hotels, Ltd. – Class “A” 4,436,839<br />
60,000 Penske Automotive Group, Inc. 2,565,600<br />
450,000 Pier 1 Imports, Inc. 8,496,000<br />
89,300 * Steiner Leisure, Ltd. 4,130,125<br />
125,000 * TRW Automotive Holdings Corporation 10,202,500<br />
117,000 Tupperware Brands Corporation 9,799,920<br />
5,000 * Vince Holding Corporation 131,800<br />
160,000 Walt Disney Company 12,811,200<br />
140,000 Wyndham Worldwide Corporation 10,252,200<br />
249,722,488<br />
Consumer Staples—8.7%<br />
450,000 Altria Group, Inc. 16,843,500<br />
250,000 Avon Products, Inc. 3,660,000<br />
432,600 Coca-Cola Company 16,724,316<br />
285,000 CVS Caremark Corporation 21,335,100<br />
210,000 Herbalife, Ltd. 12,026,700<br />
300,000 Nu Skin Enterprises, Inc. – Class “A” 24,855,000<br />
126,000 PepsiCo, Inc. 10,521,000<br />
275,000 Philip Morris International, Inc. 22,514,250<br />
135,562 Procter & Gamble Company 10,926,297<br />
160,000 Wal-Mart Stores, Inc. 12,228,800<br />
151,634,963
Shares Security Value<br />
Energy—10.1%<br />
138,000 Anadarko Petroleum Corporation $ 11,696,880<br />
144,800 Chevron Corporation 17,218,168<br />
230,000 ConocoPhillips 16,180,500<br />
245,000 Devon Energy Corporation 16,397,850<br />
145,000 Ensco, PLC – Class “A” 7,653,100<br />
230,000 ExxonMobil Corporation 22,466,400<br />
31,700 Hess Corporation 2,627,296<br />
6,920 Hugoton Royalty Trust 55,845<br />
348,019 Marathon Oil Corporation 12,361,635<br />
142,509 Marathon Petroleum Corporation 12,403,983<br />
160,000 National Oilwell Varco, Inc. 12,459,200<br />
247,500 Noble Corporation, PLC 8,103,150<br />
100,000 Occidental Petroleum Corporation 9,529,000<br />
115,000 Phillips 66 8,861,900<br />
48,300 Schlumberger, Ltd. 4,709,250<br />
350,200 Suncor Energy, Inc. 12,242,992<br />
174,967,149<br />
Financials—10.4%<br />
230,000 American Express Company 20,706,900<br />
140,000 Ameriprise Financial, Inc. 15,409,800<br />
120,000 Armada Hoffler Properties, Inc. (REIT) 1,204,800<br />
532,500 Brixmor Property Group, Inc. (REIT) 11,358,225<br />
275,000 Discover Financial Services 16,002,250<br />
100,000 Financial Select Sector SPDR Fund (ETF) 2,234,000<br />
225,000 <strong>First</strong>Merit Corporation 4,686,750<br />
187,500 * Health Insurance Innovations, Inc. – Class “A” 1,938,750<br />
85,000 Invesco, Ltd. 3,145,000<br />
396,730 JPMorgan Chase & Company 24,085,478<br />
100,000 MetLife, Inc. 5,280,000<br />
100,000 Morgan Stanley 3,117,000<br />
165,000 PNC Financial Services Group, Inc. 14,355,000<br />
75,000 SPDR S&P 500 ETF Trust (ETF) 14,028,000<br />
100,000 SPDR S&P Regional Banking (ETF) 4,138,000<br />
357,666 Sunstone Hotel <strong>Investors</strong>, Inc. (REIT) 4,910,754<br />
355,000 U.S. Bancorp 15,215,300<br />
385,100 Urstadt Biddle Properties, Inc. – Class “A” (REIT) 7,956,166<br />
237,050 Wells Fargo & Company 11,790,867<br />
181,563,040<br />
77
Portfolio of Investments (continued)<br />
GROWTH & INCOME FUND<br />
March 31, 2014<br />
Shares Security Value<br />
Health Care—15.4%<br />
400,000 Abbott Laboratories $ 15,404,000<br />
230,000 AbbVie, Inc. 11,822,000<br />
151,344 * Actavis, PLC 31,154,162<br />
175,000 Baxter International, Inc. 12,876,500<br />
75,000 Covidien, PLC 5,524,500<br />
200,000 * Express Scripts Holding Company 15,018,000<br />
482,500 * Gilead Sciences, Inc. 34,189,950<br />
270,625 Johnson & Johnson 26,583,494<br />
9,375 * Mallinckrodt, PLC 594,469<br />
70,900 McKesson Corporation 12,518,813<br />
325,000 Merck & Company, Inc. 18,450,250<br />
152,000 Omnicare, Inc. 9,069,840<br />
829,301 Pfizer, Inc. 26,637,148<br />
135,000 * Salix Pharmaceuticals, Ltd. 13,987,350<br />
260,000 Thermo Fisher Scientific, Inc. 31,262,400<br />
103,905 Zoetis, Inc. 3,007,011<br />
268,099,887<br />
Industrials—12.9%<br />
175,000 3M Company 23,740,500<br />
225,000 ADT Corporation 6,738,750<br />
250,000 Altra Industrial Motion Corporation 8,925,000<br />
90,000 * Armstrong World Industries, Inc. 4,792,500<br />
77,000 Caterpillar, Inc. 7,651,490<br />
180,000 Chicago Bridge & Iron Company NV – NY Shares 15,687,000<br />
153,700 Dover Corporation 12,564,975<br />
165,000 Generac Holdings, Inc. 9,730,050<br />
385,000 General Electric Company 9,967,650<br />
209,700 Honeywell International, Inc. 19,451,772<br />
175,000 ITT Corporation 7,483,000<br />
20,000 Lockheed Martin Corporation 3,264,800<br />
125,000 Pentair, Ltd. 9,917,500<br />
145,000 Ryder System, Inc. 11,588,400<br />
100,000 Snap-On, Inc. 11,348,000<br />
230,000 * TAL International Group, Inc. 9,860,100<br />
110,000 Textainer Group Holdings, Ltd. 4,209,700<br />
325,000 Textron, Inc. 12,769,250<br />
372,475 Tyco International, Ltd. 15,792,940<br />
9,800 * United Rentals, Inc. 930,412<br />
154,700 United Technologies Corporation 18,075,148<br />
224,488,937<br />
78
Shares Security Value<br />
Information Technology—19.7%<br />
50,000 Apple, Inc. $ 26,837,000<br />
350,000 * ARRIS Group, Inc. 9,863,000<br />
300,000 Avago Technologies, Ltd. 19,323,000<br />
240,500 * Blackhawk Network Holdings, Inc. 5,865,795<br />
400,000 CDW Corporation 10,976,000<br />
875,000 Cisco Systems, Inc. 19,608,750<br />
100,000 * eBay, Inc. 5,524,000<br />
800,000 EMC Corporation 21,928,000<br />
475,000 Hewlett-Packard Company 15,371,000<br />
583,775 Intel Corporation 15,067,233<br />
151,425 International Business Machines Corporation 29,147,798<br />
416,800 Intersil Corporation – Class “A” 5,385,056<br />
475,000 * Juniper Networks, Inc. 12,236,000<br />
60,000 * Knowles Corporation 1,894,200<br />
590,000 Mentor Graphics Corporation 12,991,800<br />
315,000 Methode Electronics, Inc. 9,657,900<br />
876,345 Microsoft Corporation 35,921,381<br />
200,000 * NeuStar, Inc. – Class “A” 6,502,000<br />
350,000 Oracle Corporation 14,318,500<br />
150,000 * PTC, Inc. 5,314,500<br />
290,000 QUALCOMM, Inc. 22,869,400<br />
455,200 Symantec Corporation 9,090,344<br />
250,000 * Take-Two Interactive Software, Inc. 5,482,500<br />
225,000 TE Connectivity, Ltd. 13,547,250<br />
210,000 * Yahoo!, Inc. 7,539,000<br />
342,261,407<br />
Materials—5.4%<br />
156,900 Celanese Corporation – Series “A” 8,709,519<br />
130,000 Cytec Industries, Inc. 12,689,300<br />
425,000 Freeport-McMoRan Copper & Gold, Inc. 14,054,750<br />
245,000 International Paper Company 11,240,600<br />
235,000 LyondellBasell Industries NV – Class “A” 20,900,900<br />
40,000 Praxair, Inc. 5,238,800<br />
140,000 Rock-Tenn Company – Class “A” 14,779,800<br />
135,000 RPM International, Inc. 5,648,400<br />
93,262,069<br />
79
Portfolio of Investments (continued)<br />
GROWTH & INCOME FUND<br />
March 31, 2014<br />
Shares or<br />
Principal<br />
Amount Security Value<br />
Telecommunication Services—2.1%<br />
475,000 AT&T, Inc. $ 16,658,250<br />
425,000 Verizon Communications, Inc. 20,217,250<br />
36,875,500<br />
Utilities—.4%<br />
50,000 Atmos Energy Corporation 2,356,500<br />
151,100 NiSource, Inc. 5,368,583<br />
7,725,083<br />
Total Value of Common Stocks (cost $1,054,409,280) 1,730,600,523<br />
SHORT-TERM U.S. GOVERNMENT<br />
OBLIGATIONS—.2%<br />
U.S. Treasury Bills:<br />
$ 2,000 M 0.036%, 4/3/2014 1,999,996<br />
1,000 M 0.02%, 4/17/2014 999,991<br />
Total Value of Short-Term U.S. Government Obligations (cost $2,999,987) 2,999,987<br />
SHORT-TERM U.S. GOVERNMENT AGENCY<br />
OBLIGATIONS—.1%<br />
2,000 M Federal Home Loan Bank, 0.065%, 4/25/2014 (cost $1,999,913) 1,999,913<br />
Total Value of Investments (cost $1,059,409,180) 99.8% 1,735,600,423<br />
Other Assets, Less Liabilities .2 3,093,571<br />
Net Assets 100.0% $1,738,693,994<br />
* Non-income producing<br />
Summary of Abbreviations:<br />
ETF Exchange Traded Fund<br />
REIT Real Estate Investment Trust<br />
80
Accounting Standards Codification 820 established a three-tier hierarchy of inputs to establish a<br />
classification of fair value measurements for disclosure purposes. The three-tier hierarchy of inputs is<br />
summarized in the three broad Levels listed below:<br />
Level 1 — Unadjusted quoted prices in active markets for identical securities that the Fund has<br />
the ability to access.<br />
Level 2 — Observable inputs other than quoted prices included in Level 1 that are observable<br />
for the asset or liability, either directly or indirectly. These inputs may include<br />
quoted prices for the identical instrument on an inactive market, prices for similar<br />
instruments, interest rates, prepayment speeds, credit risk, yield curves, default rates<br />
and similar data.<br />
Level 3 — Unobservable inputs for the asset or liability, to the extent relevant observable inputs<br />
are not available, representing the Fund’s own assumption about the assumptions a<br />
market participant would use in valuing the asset or liability, and would be based on<br />
the best information available.<br />
The inputs methodology used for valuing securities are not necessarily an indication of the risk<br />
associated with investing in those securities. For example, amortized cost approximates the current<br />
fair value of a security, but since the value is not obtained from a quoted price in an active market,<br />
such securities are reflected as Level 2.<br />
The following is a summary, by category of Level, of inputs used to value the Fund’s investments as of<br />
March 31, 2014:<br />
Level 1 Level 2 Level 3 Total<br />
Common Stocks. . . . . . . . . . . . . . $ 1,730,600,523 $ — $ — $1,730,600,523<br />
Short-Term U.S. Government<br />
Obligations. . . . . . . . . . . . . . . . — 2,999,987 — 2,999,987<br />
Short-Term U.S. Government<br />
Agency Obligations . . . . . . . . . — 1,999,913 — 1,999,913<br />
Total Investments in Securities* . . $ 1,730,600,523 $ 4,999,900 $ — $ 1,735,600,423<br />
* The Portfolio of Investments provides information on the industry categorization for common stocks.<br />
There were no transfers into or from Level 1 and Level 2 by the Fund during the period ended<br />
March 31, 2014. Transfers, if any, between Levels are recognized at the end of the reporting period.<br />
See notes to financial statements<br />
81
Fund Expenses (unaudited)<br />
GLOBAL FUND<br />
The examples below show the ongoing costs (in dollars) of investing in your Fund and will<br />
help you in comparing these costs with costs of other mutual funds. Please refer to page 4 for a<br />
detailed explanation of the information presented in these examples.<br />
Expense Example<br />
Annualized<br />
Expense<br />
Ratio<br />
Beginning<br />
Account Value<br />
(10/1/13)<br />
Ending<br />
Account Value<br />
(3/31/14)<br />
Expenses Paid<br />
During Period<br />
(10/1/13–3/31/14)*<br />
Class A Shares 1.51%<br />
Actual $1,000.00 $1,067.00 $ 7.78<br />
Hypothetical** $1,000.00 $1,017.40 $ 7.59<br />
Class B Shares 2.34%<br />
Actual $1,000.00 $1,063.71 $12.04<br />
Hypothetical** $1,000.00 $1,013.26 $11.75<br />
Advisor Class Shares 1.24%<br />
Actual $1,000.00 $1,067.04 $ 6.39<br />
Hypothetical** $1,000.00 $1,018.75 $ 6.24<br />
Institutional Class Shares 1.05%<br />
Actual $1,000.00 $1,069.48 $ 5.42<br />
Hypothetical** $1,000.00 $1,019.69 $ 5.29<br />
* Expenses are equal to the annualized expense ratio, multiplied by the average account value over<br />
the period, multiplied by 182/365 (to reflect the one-half year period).<br />
**Assumed rate of return of 5% before expenses.<br />
Portfolio Composition<br />
BY SECTOR<br />
Financials<br />
20.5%<br />
Health Care<br />
Industrials<br />
17.4%<br />
18.3%<br />
Information Technology<br />
13.7%<br />
Consumer Discretionary<br />
10.2%<br />
Consumer Staples<br />
7.5%<br />
Energy<br />
5.5%<br />
Materials<br />
3.9%<br />
Telecommunication<br />
Services<br />
1.7%<br />
Portfolio holdings and allocations are subject to change. Percentages are as of March 31, 2014, and<br />
are based on the total market value of investments.<br />
82
Portfolio of Investments (continued)<br />
GLOBAL FUND<br />
March 31, 2014<br />
Shares Security Value<br />
COMMON STOCKS—99.1%<br />
United States—58.3%<br />
34,100 Accenture, PLC – Class “A” $ 2,718,452<br />
98,500 Activision Blizzard, Inc. 2,013,340<br />
83,400 Aetna, Inc. 6,252,498<br />
47,940 * Alkermes, PLC 2,113,675<br />
7,700 Alliance Data Systems Corporation 2,097,865<br />
8,600 Amazon.com, Inc. 2,894,072<br />
90,480 American International Group, Inc. 4,524,905<br />
32,125 Ameriprise Financial, Inc. 3,535,999<br />
66,800 AMETEK, Inc. 3,439,532<br />
57,415 Amgen, Inc. 7,081,566<br />
49,040 Anadarko Petroleum Corporation 4,156,630<br />
119,647 Arena Pharmaceuticals, Inc. 753,776<br />
8,900 Artisan Partners Asset Management, Inc. – Class “A” 571,825<br />
27,555 BlackRock, Inc. 8,665,496<br />
82,320 Bristol-Myers Squibb Company 4,276,524<br />
26,700 Celgene Corporation 3,727,320<br />
138,655 Citigroup, Inc. 6,599,978<br />
20,700 * Concho Resources, Inc. 2,535,750<br />
85,360 Eli Lilly & Company 5,024,290<br />
70,200 Equifax, Inc. 4,775,706<br />
28,100 Estee Lauder Companies, Inc. – Class “A” 1,879,328<br />
161,200 Ford Motor Company 2,514,720<br />
59,900 Gap, Inc. 2,399,594<br />
30,300 * Gilead Sciences, Inc. 2,147,058<br />
6,550 * Google, Inc. – Class “A” 7,300,040<br />
68,700 Halliburton Company 4,045,743<br />
72,300 HCA, Inc. 3,795,750<br />
6,000 IntercontinentalExchange Group, Inc. 1,186,980<br />
58,600 International Paper Company 2,688,568<br />
23,900 Invesco, Ltd. 884,300<br />
74,100 KBR, Inc. 1,976,988<br />
65,200 L Brands, Inc. 3,701,404<br />
11,100 * LinkedIn Corporation – Class “A” 2,052,834<br />
36,600 MasterCard, Inc. 2,734,020<br />
20,865 McKesson Corporation 3,684,133<br />
155,360 Merck & Company, Inc. 8,819,787<br />
148,400 Mondelez International, Inc. – Class “A” 5,127,220<br />
45,720 Monster Beverage Corporation 3,175,254<br />
72,769 Nielsen Holdings NV 3,247,680<br />
55,200 NPS Pharmaceuticals, Inc. 1,652,136<br />
83
Portfolio of Investments (continued)<br />
GLOBAL FUND<br />
March 31, 2014<br />
Shares Security Value<br />
United States (continued)<br />
46,120 Parker Hannifin Corporation $ 5,521,025<br />
28,700 Pioneer Natural Resources Company 5,370,918<br />
77,475 PNC Financial Services Group, Inc. 6,740,325<br />
78,400 QUALCOMM, Inc. 6,182,624<br />
40,900 Range Resources Corporation 3,393,473<br />
14,900 Regeneron Pharmaceuticals, Inc. 4,474,172<br />
57,490 * Salesforce.com, Inc. 3,282,104<br />
13,300 * Salix Pharmaceuticals, Ltd. 1,378,013<br />
29,000 Solera Holdings, Inc. 1,836,860<br />
35,645 * Teledyne Technologies, Inc. 3,469,328<br />
52,400 * TRW Automotive Holdings Corporation 4,276,888<br />
91,000 United Continental Holdings, Inc. 4,061,330<br />
45,600 VF Corporation 2,821,728<br />
8,100 Virtus Investment Partners, Inc. 1,402,677<br />
98,500 Vulcan Materials Company 6,545,325<br />
20,380 W.W. Grainger, Inc. 5,149,211<br />
48,400 WABCO Holdings, Inc. 5,109,104<br />
40,960 Wabtec Corporation 3,174,400<br />
149,000 WisdomTree Investments, Inc. 1,954,880<br />
317,600 Xerox Corporation 3,588,880<br />
157,824 Zoetis, Inc. 4,567,427<br />
227,073,428<br />
Japan—12.1%<br />
27,570 Aeon Mall Company, Ltd. 705,681<br />
111,600 Asahi Group Holdings, Ltd. 3,130,673<br />
116,000 Daiwa House Industry Company, Ltd. 1,972,287<br />
76,600 Dentsu, Inc. 2,911,968<br />
622,000 Isuzu Motors, Ltd. 3,581,551<br />
42,500 Japan Exchange Group, Inc. 1,039,132<br />
112,410 KDDI Corporation 6,522,913<br />
325,100 Mitsubishi Electric Corporation 3,668,167<br />
243,790 Mitsubishi UFJ Financial Group, Inc. 1,342,224<br />
267,400 Nomura Holdings, Inc. 1,718,879<br />
60,700 Nomura Research Institute, Ltd. 1,921,464<br />
79,900 Olympus Corporation 2,552,517<br />
273,900 ORIX Corporation 3,864,414<br />
150,700 Rakuten, Inc. 2,014,991<br />
88,000 Rohm Company, Ltd. 3,934,942<br />
84
Shares Security Value<br />
Japan (continued)<br />
64,600 Seven & I Holdings Company, Ltd. $ 2,473,976<br />
215,420 T&D Holdings, Inc. 2,566,591<br />
32,900 Tokio Marine Holdings, Inc. 989,699<br />
46,912,069<br />
France—7.9%<br />
44,091 Air Liquide SA 5,974,733<br />
62,122 BNP Paribas SA 4,793,829<br />
42,131 Cap Gemini SA 3,190,775<br />
175,010 Rexel SA 4,593,784<br />
74,510 Schneider Electric SA 6,608,300<br />
92,801 Societe Generale 5,717,885<br />
30,879,306<br />
United Kingdom—5.8%<br />
144,673 AstraZeneca, PLC 9,349,731<br />
132,827 Diageo, PLC 4,121,018<br />
486,453 Kingfisher, PLC 3,417,490<br />
309,927 * Rolls-Royce Holdings, PLC 5,549,266<br />
22,437,505<br />
Italy—3.0%<br />
324,737 Assicurazioni Generali SpA 7,241,640<br />
66,389 Banca Generali SpA 2,191,434<br />
701,415 Intesa Sanpaolo 2,378,137<br />
11,811,211<br />
Belgium—2.3%<br />
86,290 Anheuser-Busch InBev NV 9,050,484<br />
Canada—1.8%<br />
303,000 * Air Canada – Class “A” 1,520,833<br />
63,000 Cameco Corporation 1,442,700<br />
73,390 Tim Hortons, Inc. 4,067,950<br />
7,031,483<br />
85
Portfolio of Investments (continued)<br />
GLOBAL FUND<br />
March 31, 2014<br />
Shares Security Value<br />
Germany—1.5%<br />
11,653 Brenntag AG $ 2,162,573<br />
80,645 ProSiebenSat. 1 Media AG 3,692,358<br />
5,854,931<br />
Netherlands—1.3%<br />
83,911 NXP Semiconductors NV 4,934,806<br />
Switzerland—1.2%<br />
106,103 Julius Baer Group, Ltd. 4,712,085<br />
South Korea—1.0%<br />
116,880 SK Hynix, Inc. 3,952,915<br />
Sweden—1.0%<br />
74,193 Assa Abloy AB-Class “B” 3,943,350<br />
China—.5%<br />
24,100 * 58.Com, Inc. (ADR) 1,003,283<br />
6,800 * Baidu.com, Inc. (ADR) 1,036,184<br />
2,039,467<br />
Hong Kong—.4%<br />
485,690 MGM China Holdings, Ltd. 1,712,458<br />
Greece—.4%<br />
1,638,551 * Alpha Bank A.E. (a) 1,614,703<br />
Mexico—.3%<br />
376,500 Fibra Uno Administracion SA 1,218,765<br />
Norway—.2%<br />
44,990 * Tanker Investments, Ltd. 582,378<br />
India—.1%<br />
6,960 United Spirits, Ltd. 308,531<br />
Total Value of Common Stocks (cost $360,507,327) 386,069,875<br />
86
Principal<br />
Amount Security Value<br />
SHORT-TERM U.S. GOVERNMENT<br />
OBLIGATIONS—1.3%<br />
United States<br />
U.S. Treasury Bills:<br />
$ 500 M 0.04%, 4/17/2014 $ 499,991<br />
500 M 0.0405%, 4/17/2014 499,991<br />
4,000 M 0.0605%, 4/24/2014 3,999,845<br />
Total Value of Short-Term U.S. Government Obligations (cost $4,999,827) 4,999,827<br />
Total Value of Investments (cost $365,507,154) 100.4% 391,069,702<br />
Excess of Liabilities Over Other Assets (.4) (1,629,146)<br />
Net Assets 100.0% $389,440,556<br />
* Non-income producing<br />
(a) A portion or all of the security purchased on a when-issued or delayed delivery basis<br />
(see Note 1G).<br />
Summary of Abbreviations:<br />
ADR American Depositary Receipts<br />
Accounting Standards Codification 820 established a three-tier hierarchy of inputs to establish a<br />
classification of fair value measurements for disclosure purposes. The three-tier hierarchy of inputs is<br />
summarized in the three broad Levels listed below:<br />
Level 1 — Unadjusted quoted prices in active markets for identical securities that the Fund has<br />
the ability to access.<br />
Level 2 — Observable inputs other than quoted prices included in Level 1 that are observable<br />
for the asset or liability, either directly or indirectly. These inputs may include quoted<br />
prices for the identical instrument on an inactive market, prices for similar instruments,<br />
interest rates, prepayment speeds, credit risk, yield curves, default rates and<br />
similar data.<br />
Level 3 — Unobservable inputs for the asset or liability, to the extent relevant observable inputs<br />
are not available, representing the Fund’s own assumption about the assumptions a<br />
market participant would use in valuing the asset or liability, and would be based on<br />
the best information available.<br />
The inputs methodology used for valuing securities are not necessarily an indication of the risk<br />
associated with investing in those securities. For example, amortized cost approximates the current<br />
fair value of a security, but since the value is not obtained from a quoted price in an active market,<br />
such securities are reflected as Level 2.<br />
87
Portfolio of Investments (continued)<br />
GLOBAL FUND<br />
March 31, 2014<br />
The following is a summary, by category of Level, of inputs used to value the Fund’s investments as of<br />
March 31, 2014:<br />
Level 1 Level 2 Level 3 Total<br />
Common Stocks<br />
United States . . . . . . . . . . . . $ 227,073,428 $ — $ — $ 227,073,428<br />
Japan . . . . . . . . . . . . . . . . . . 46,912,069 — — 46,912,069<br />
France . . . . . . . . . . . . . . . . . 30,879,306 — — 30,879,306<br />
United Kingdom . . . . . . . . . 22,437,505 — — 22,437,505<br />
Italy . . . . . . . . . . . . . . . . . . . 11,811,211 — — 11,811,211<br />
Belgium . . . . . . . . . . . . . . . . 9,050,484 — — 9,050,484<br />
Canada . . . . . . . . . . . . . . . . . 7,031,483 — — 7,031,483<br />
Germany . . . . . . . . . . . . . . . 5,854,931 — — 5,854,931<br />
Netherlands . . . . . . . . . . . . . 4,934,806 — — 4,934,806<br />
Switzerland . . . . . . . . . . . . . 4,712,085 — — 4,712,085<br />
South Korea . . . . . . . . . . . . . 3,952,915 — — 3,952,915<br />
Sweden . . . . . . . . . . . . . . . . 3,943,350 — — 3,943,350<br />
China . . . . . . . . . . . . . . . . . . 2,039,467 — — 2,039,467<br />
Hong Kong . . . . . . . . . . . . . 1,712,458 — — 1,712,458<br />
Greece . . . . . . . . . . . . . . . . . 1,614,703 — — 1,614,703<br />
Mexico. . . . . . . . . . . . . . . . . 1,218,765 — — 1,218,765<br />
Norway . . . . . . . . . . . . . . . . 582,378 — — 582,378<br />
India. . . . . . . . . . . . . . . . . . . 308,531 — — 308,531<br />
Short-Term U.S. Government<br />
Obligations. . . . . . . . . . . . . . . . — 4,999,827 — 4,999,827<br />
Total Investments in Securities. . . . $ 386,069,875 $ 4,999,827 $ — $ 391,069,702<br />
During the period ended March 31, 2014, there were no transfers between Level 1 investments and<br />
Level 2 investments that had a material impact to the Fund. This does not include transfers between<br />
Level 1 investments and Level 2 investments due to the Fund utilizing international fair value pricing<br />
during the period (see Note 1A). Transfers, if any, between Levels are recognized at the end of the<br />
reporting period.<br />
88<br />
See notes to financial statements
Fund Expenses (unaudited)<br />
SELECT GROWTH FUND<br />
The examples below show the ongoing costs (in dollars) of investing in your Fund and will<br />
help you in comparing these costs with costs of other mutual funds. Please refer to page 4 for a<br />
detailed explanation of the information presented in these examples.<br />
Expense Example<br />
Annualized<br />
Expense<br />
Ratio<br />
Beginning<br />
Account Value<br />
(10/1/13)<br />
Ending<br />
Account Value<br />
(3/31/14)<br />
Expenses Paid<br />
During Period<br />
(10/1/13–3/31/14)*<br />
Class A Shares 1.28%<br />
Actual $1,000.00 $1,151.96 $ 6.87<br />
Hypothetical** $1,000.00 $1,018.55 $ 6.44<br />
Class B Shares 2.06%<br />
Actual $1,000.00 $1,146.28 $11.02<br />
Hypothetical** $1,000.00 $1,014.66 $10.35<br />
Advisor Class Shares 1.02%<br />
Actual $1,000.00 $1,151.18 $ 5.47<br />
Hypothetical** $1,000.00 $1,019.84 $ 5.14<br />
Institutional Class Shares 0.84%<br />
Actual $1,000.00 $1,154.26 $ 4.51<br />
Hypothetical** $1,000.00 $1,020.74 $ 4.23<br />
* Expenses are equal to the annualized expense ratio, multiplied by the average account value over<br />
the period, multiplied by 182/365 (to reflect the one-half year period).<br />
**Assumed rate of return of 5% before expenses.<br />
Portfolio Composition<br />
BY SECTOR<br />
Information Technology<br />
22.6%<br />
Consumer Discretionary<br />
19.9%<br />
Industrials<br />
17.8%<br />
Health Care<br />
15.6%<br />
Financials<br />
8.6%<br />
Consumer Staples<br />
7.7%<br />
Energy<br />
7.0%<br />
Portfolio holdings and allocations are subject to change. Percentages are as of March 31, 2014, and<br />
are based on the total market value of investments.<br />
89
Portfolio of Investments (continued)<br />
SELECT GROWTH FUND<br />
March 31, 2014<br />
Shares Security Value<br />
COMMON STOCKS—99.0%<br />
Consumer Discretionary—19.8%<br />
150,300 BorgWarner, Inc. $ 9,238,941<br />
302,700 Gentex Corporation 9,544,131<br />
136,200 Home Depot, Inc. 10,777,506<br />
11,000 * Priceline.com, Inc. 13,110,790<br />
129,500 Starbucks Corporation 9,502,710<br />
218,300 TJX Companies, Inc. 13,239,895<br />
44,740 Whirlpool Corporation 6,686,840<br />
72,100,813<br />
Consumer Staples—7.7%<br />
189,400 Coca-Cola Enterprises, Inc. 9,045,744<br />
71,000 Kimberly-Clark Corporation 7,827,750<br />
257,200 Kroger Company 11,226,780<br />
28,100,274<br />
Energy—7.0%<br />
43,800 Chevron Corporation 5,208,258<br />
47,200 ExxonMobil Corporation 4,610,496<br />
71,900 Helmerich & Payne, Inc. 7,733,564<br />
149,600 Valero Energy Corporation 7,943,760<br />
25,496,078<br />
Financials—8.6%<br />
151,300 American Express Company 13,621,539<br />
127,400 Discover Financial Services 7,413,406<br />
54,800 Travelers Companies, Inc. 4,663,480<br />
128,200 U.S. Bancorp 5,494,652<br />
31,193,077<br />
Health Care—15.5%<br />
80,800 * Actavis, PLC 16,632,680<br />
151,200 * Align Technology, Inc. 7,830,648<br />
45,700 C.R. Bard, Inc. 6,762,686<br />
104,000 * Gilead Sciences, Inc. 7,369,440<br />
56,900 Johnson & Johnson 5,589,287<br />
69,800 McKesson Corporation 12,324,586<br />
56,509,327<br />
90
Shares or<br />
Principal<br />
Amount Security Value<br />
Industrials—17.8%<br />
106,800 Alaska Air Group, Inc. $ 9,965,508<br />
200,500 AMETEK, Inc. 10,323,745<br />
89,000 Boeing Company 11,168,610<br />
93,300 Rockwell Automation, Inc. 11,620,515<br />
48,300 Union Pacific Corporation 9,063,978<br />
162,100 Wabtec Corporation 12,562,750<br />
64,705,106<br />
Information Technology—22.6%<br />
54,100 * Alliance Data Systems Corporation 14,739,545<br />
144,800 Amdocs, Ltd. 6,727,408<br />
27,800 Apple, Inc. 14,921,372<br />
188,699 * CoreLogic, Inc. 5,668,518<br />
95,400 DST Systems, Inc. 9,042,966<br />
239,400 Hewlett-Packard Company 7,746,984<br />
149,100 * Red Hat, Inc. 7,899,318<br />
84,600 SanDisk Corporation 6,868,674<br />
91,619 Western Digital Corporation 8,412,457<br />
82,027,242<br />
Total Value of Common Stocks (cost $246,681,003) 360,131,917<br />
SHORT-TERM U.S. GOVERNMENT<br />
OBLIGATIONS—.5%<br />
$ 2,000 M U.S. Treasury Bills, 0.02%, 4/17/2014 (cost $1,999,982) 1,999,982<br />
SHORT-TERM U.S. GOVERNMENT AGENCY<br />
OBLIGATIONS—.3%<br />
1,000 M Freddie Mac, 0.045%, 4/8/2014 (cost $999,991) 999,991<br />
Total Value of Investments (cost $249,680,976) 99.8% 363,131,890<br />
Other Assets, Less Liabilities .2 593,122<br />
Net Assets 100.0% $363,725,012<br />
* Non-income producing<br />
91
Portfolio of Investments (continued)<br />
SELECT GROWTH FUND<br />
March 31, 2014<br />
Accounting Standards Codification 820 established a three-tier hierarchy of inputs to establish a<br />
classification of fair value measurements for disclosure purposes. The three-tier hierarchy of inputs is<br />
summarized in the three broad Levels listed below:<br />
Level 1 — Unadjusted quoted prices in active markets for identical securities that the Fund has<br />
the ability to access.<br />
Level 2 — Observable inputs other than quoted prices included in Level 1 that are observable<br />
for the asset or liability, either directly or indirectly. These inputs may include quoted<br />
prices for the identical instrument on an inactive market, prices for similar instruments,<br />
interest rates, prepayment speeds, credit risk, yield curves, default rates and<br />
similar data.<br />
Level 3 — Unobservable inputs for the asset or liability, to the extent relevant observable inputs<br />
are not available, representing the Fund’s own assumption about the assumptions a<br />
market participant would use in valuing the asset or liability, and would be based on<br />
the best information available.<br />
The inputs methodology used for valuing securities are not necessarily an indication of the risk<br />
associated with investing in those securities. For example, amortized cost approximates the current<br />
fair value of a security, but since the value is not obtained from a quoted price in an active market,<br />
such securities are reflected as Level 2.<br />
The following is a summary, by category of Level, of inputs used to value the Fund’s investments as of<br />
March 31, 2014:<br />
Level 1 Level 2 Level 3 Total<br />
Common Stocks. . . . . . . . . . . . . . $ 360,131,917 $ — $ — $ 360,131,917<br />
Short-Term U.S. Government<br />
Obligations. . . . . . . . . . . . . . . . — 1,999,982 — 1,999,982<br />
Short-Term U.S. Government<br />
Agency Obligations . . . . . . . . . — 999,991 — 999,991<br />
Total Investments in Securities* . . $ 360,131,917 $ 2,999,973 $ — $ 363,131,890<br />
* The Portfolio of Investments provides information on the industry categorization for common stocks.<br />
There were no transfers into or from Level 1 and Level 2 by the Fund during the period ended<br />
March 31, 2014. Transfers, if any, between Levels are recognized at the end of the reporting period.<br />
92<br />
See notes to financial statements
Fund Expenses (unaudited)<br />
OPPORTUNITY FUND<br />
The examples below show the ongoing costs (in dollars) of investing in your Fund and will<br />
help you in comparing these costs with costs of other mutual funds. Please refer to page 4 for a<br />
detailed explanation of the information presented in these examples.<br />
Expense Example<br />
Annualized<br />
Expense<br />
Ratio<br />
Beginning<br />
Account Value<br />
(10/1/13)<br />
Ending<br />
Account Value<br />
(3/31/14)<br />
Expenses Paid<br />
During Period<br />
(10/1/13–3/31/14)*<br />
Class A Shares 1.21%<br />
Actual $1,000.00 $1,112.41 $ 6.37<br />
Hypothetical** $1,000.00 $1,018.90 $ 6.09<br />
Class B Shares 2.00%<br />
Actual $1,000.00 $1,107.92 $10.51<br />
Hypothetical** $1,000.00 $1,014.96 $10.05<br />
Advisor Class Shares 0.98%<br />
Actual $1,000.00 $1,112.59 $ 5.16<br />
Hypothetical** $1,000.00 $1,020.04 $ 4.94<br />
Institutional Class Shares 0.79%<br />
Actual $1,000.00 $1,114.60 $ 4.16<br />
Hypothetical** $1,000.00 $1,020.99 $ 3.98<br />
* Expenses are equal to the annualized expense ratio, multiplied by the average account value over<br />
the period, multiplied by 182/365 (to reflect the one-half year period).<br />
**Assumed rate of return of 5% before expenses.<br />
Portfolio Composition<br />
BY SECTOR<br />
Consumer Discretionary<br />
Information Technology<br />
Industrials<br />
Health Care<br />
16.5%<br />
15.6%<br />
15.2%<br />
15.1%<br />
Financials<br />
12.7%<br />
Energy<br />
Materials<br />
6.7%<br />
7.5%<br />
Consumer Staples<br />
Utilities<br />
4.2%<br />
3.7%<br />
Telecommunication<br />
Services<br />
0.5%<br />
Portfolio holdings and allocations are subject to change. Percentages are as of March 31, 2014, and<br />
are based on the total market value of investments.<br />
93
Portfolio of Investments (continued)<br />
OPPORTUNITY FUND<br />
March 31, 2014<br />
Shares Security Value<br />
COMMON STOCKS—97.0%<br />
Consumer Discretionary—16.4%<br />
150,000 BorgWarner, Inc. $ 9,220,500<br />
6,000 * Container Store Group, Inc. 203,700<br />
240,000 CST Brands, Inc. 7,497,600<br />
50,000 Dana Holding Corporation 1,163,500<br />
40,000 * Del Frisco’s Restaurant Group, Inc. 1,116,000<br />
245,000 Delphi Automotive, PLC 16,625,700<br />
125,000 * Express, Inc. 1,985,000<br />
250,000 Extended Stay America, Inc. 5,692,500<br />
60,200 GNC Holdings, Inc. – Class “A” 2,650,004<br />
100,000 Harman International Industries, Inc. 10,640,000<br />
149,500 * Jarden Corporation 8,944,585<br />
165,000 L Brands, Inc. 9,367,050<br />
185,000 Newell Rubbermaid, Inc. 5,531,500<br />
50,000 Nordstrom, Inc. 3,122,500<br />
436,000 * Orient-Express Hotels, Ltd. – Class “A” 6,282,760<br />
109,900 Penske Automotive Group, Inc. 4,699,324<br />
335,000 Pier 1 Imports, Inc. 6,324,800<br />
25,000 Ralph Lauren Corporation 4,023,250<br />
205,900 Ruth’s Hospitality Group, Inc. 2,489,331<br />
145,000 * TRW Automotive Holdings Corporation 11,834,900<br />
100,000 Tupperware Brands Corporation 8,376,000<br />
4,000 * Vince Holding Corporation 105,440<br />
148,000 * William Lyon Homes – Class “A” 4,086,280<br />
63,200 Wyndham Worldwide Corporation 4,628,136<br />
136,610,360<br />
Consumer Staples—4.1%<br />
150,000 Avon Products, Inc. 2,196,000<br />
155,000 Herbalife, Ltd. 8,876,850<br />
20,000 McCormick & Company, Inc. 1,434,800<br />
210,000 Nu Skin Enterprises, Inc. – Class “A” 17,398,500<br />
82,600 Pinnacle Foods, Inc. 2,466,436<br />
71,489 Tootsie Roll Industries, Inc. 2,140,387<br />
34,512,973<br />
Energy—7.4%<br />
30,000 * Dril-Quip, Inc. 3,363,000<br />
116,500 Ensco, PLC – Class “A” 6,148,870<br />
40,000 EOG Resources, Inc. 7,846,800<br />
94
Shares Security Value<br />
Energy (continued)<br />
90,000 EQT Corporation $ 8,727,300<br />
275,000 * Helix Energy Solutions Group, Inc. 6,319,500<br />
43,000 Hess Corporation 3,563,840<br />
139,700 National Oilwell Varco, Inc. 10,878,439<br />
120,000 Noble Corporation, PLC 3,928,800<br />
232,000 * RSP Permian, Inc. 6,702,480<br />
225,000 Talisman Energy, Inc. 2,245,500<br />
125,000 * Weatherford International, Ltd. 2,170,000<br />
61,894,529<br />
Financials—12.7%<br />
60,000 Ameriprise Financial, Inc. 6,604,200<br />
220,000 Berkshire Hills Bancorp, Inc. 5,693,600<br />
308,600 Brixmor Property Group, Inc. (REIT) 6,582,438<br />
105,000 City National Corporation 8,265,600<br />
220,000 Discover Financial Services 12,801,800<br />
150,000 Douglas Emmett, Inc. (REIT) 4,071,000<br />
45,000 Federal Realty Investment Trust (REIT) 5,162,400<br />
90,000 Financial Select Sector SPDR Fund (ETF) 2,010,600<br />
175,000 <strong>First</strong>Merit Corporation 3,645,250<br />
171,000 * Health Insurance Innovations, Inc. – Class “A” 1,768,140<br />
15,000 Invesco, Ltd. 555,000<br />
120,000 NASDAQ OMX Group, Inc. 4,432,800<br />
100,000 Oritani Financial Corporation 1,581,000<br />
275,000 Protective Life Corporation 14,462,250<br />
150,000 * Realogy Holdings Corporation 6,517,500<br />
92,000 SPDR S&P Regional Banking (ETF) 3,806,960<br />
355,000 Sterling Bancorp 4,494,300<br />
175,000 Waddell & Reed Financial, Inc. – Class “A” 12,883,500<br />
105,338,338<br />
Health Care—15.0%<br />
170,000 * Actavis, PLC 34,994,500<br />
100,000 * Centene Corporation 6,225,000<br />
75,000 DENTSPLY International, Inc. 3,453,000<br />
175,000 * Gilead Sciences, Inc. 12,400,500<br />
115,000 * Lannett Company, Inc. 4,107,800<br />
80,000 McKesson Corporation 14,125,600<br />
122,300 Omnicare, Inc. 7,297,641<br />
20,000 Perrigo Company, PLC 3,093,200<br />
399,500 * Prestige Brands Holdings, Inc. 10,886,375<br />
95
Portfolio of Investments (continued)<br />
OPPORTUNITY FUND<br />
March 31, 2014<br />
Shares Security Value<br />
Health Care (continued)<br />
125,000 * Salix Pharmaceuticals, Ltd. $ 12,951,250<br />
2,700 * Surgical Care Affiliates, Inc. 83,025<br />
125,000 Thermo Fisher Scientific, Inc. 15,030,000<br />
124,647,891<br />
Industrials—15.1%<br />
140,000 A.O. Smith Corporation 6,442,800<br />
130,500 ADT Corporation 3,908,475<br />
180,000 Altra Industrial Motion Corporation 6,426,000<br />
65,000 * Armstrong World Industries, Inc. 3,461,250<br />
160,000 Chicago Bridge & Iron Company NV – NY Shares 13,944,000<br />
97,000 Dover Corporation 7,929,750<br />
120,000 G&K Services, Inc. – Class “A” 7,340,400<br />
100,000 Generac Holdings, Inc. 5,897,000<br />
60,000 IDEX Corporation 4,373,400<br />
160,000 ITT Corporation 6,841,600<br />
82,500 J.B. Hunt Transport Services, Inc. 5,933,400<br />
62,500 Pentair, Ltd. 4,958,750<br />
40,000 Roper Industries, Inc. 5,340,400<br />
130,000 Ryder System, Inc. 10,389,600<br />
85,500 Snap-On, Inc. 9,702,540<br />
90,000 * TAL International Group, Inc. 3,858,300<br />
60,000 Textainer Group Holdings, Ltd. 2,296,200<br />
80,000 Textron, Inc. 3,143,200<br />
146,400 * United Rentals, Inc. 13,899,216<br />
126,086,281<br />
Information Technology—15.5%<br />
250,000 * ARRIS Group, Inc. 7,045,000<br />
25,000 * ATMI, Inc. 850,250<br />
210,000 Avago Technologies, Ltd. 13,526,100<br />
288,000 * Blackhawk Network Holdings, Inc. 7,024,320<br />
300,000 CDW Corporation 8,232,000<br />
295,000 * Finisar Corporation 7,820,450<br />
90,000 * Fiserv, Inc. 5,102,100<br />
321,000 Intersil Corporation – Class “A” 4,147,320<br />
325,000 * Juniper Networks, Inc. 8,372,000<br />
49,500 * King Digital Entertainment, PLC 900,405<br />
40,000 * Knowles Corporation 1,262,800<br />
380,000 Mentor Graphics Corporation 8,367,600<br />
96
Shares Security Value<br />
Information Technology (continued)<br />
280,000 Methode Electronics, Inc. $ 8,584,800<br />
150,000 Microchip Technology, Inc. 7,164,000<br />
160,000 * NeuStar, Inc. – Class “A” 5,201,600<br />
380,000 * ON Semiconductor Corporation 3,572,000<br />
325,000 Symantec Corporation 6,490,250<br />
250,000 * Take-Two Interactive Software, Inc. 5,482,500<br />
160,000 TE Connectivity, Ltd. 9,633,600<br />
275,000 Technology Select Sector SPDR Fund (ETF) 9,996,250<br />
128,775,345<br />
Materials—6.6%<br />
70,000 Cytec Industries, Inc. 6,832,700<br />
267,322 Freeport-McMoRan Copper & Gold, Inc. 8,840,338<br />
142,500 International Paper Company 6,537,900<br />
95,000 Methanex Corporation 6,074,300<br />
40,000 Praxair, Inc. 5,238,800<br />
89,600 Rock-Tenn Company – Class “A” 9,459,072<br />
55,000 Sigma-Aldrich Corporation 5,135,900<br />
105,000 Westlake Chemical Corporation 6,948,900<br />
55,067,910<br />
Telecommunication Services—.5%<br />
332,000 NTELOS Holdings Corporation 4,482,000<br />
Utilities—3.7%<br />
111,000 AGL Resources, Inc. 5,434,560<br />
120,800 NiSource, Inc. 4,292,024<br />
144,800 Portland General Electric Company 4,682,832<br />
135,000 SCANA Corporation 6,928,200<br />
200,000 Wisconsin Energy Corporation 9,310,000<br />
30,647,616<br />
Total Value of Common Stocks (cost $492,811,632) 808,063,243<br />
97
Portfolio of Investments (continued)<br />
OPPORTUNITY FUND<br />
March 31, 2014<br />
Principal<br />
Amount Security Value<br />
SHORT-TERM U.S. GOVERNMENT<br />
OBLIGATIONS—1.3%<br />
U.S. Treasury Bills:<br />
$2,000 M 0.02%, 4/17/2014 $ 1,999,982<br />
9,000 M 0.04%, 4/17/2014 8,999,840<br />
Total Value of Short-Term U.S. Government Obligations (cost $10,999,822) 10,999,822<br />
SHORT-TERM U.S. GOVERNMENT AGENCY<br />
OBLIGATIONS—1.0%<br />
Federal Home Loan Bank:<br />
4,000 M 0.04%, 4/10/2014 3,999,960<br />
4,000 M 0.05%, 4/21/2014 3,999,889<br />
Total Value of Short-Term U.S. Government Agency Obligations (cost $7,999,849) 7,999,849<br />
Total Value of Investments (cost $511,811,303) 99.3% 827,062,914<br />
Other Assets, Less Liabilities .7 6,182,930<br />
Net Assets 100.0% $833,245,844<br />
* Non-income producing<br />
Summary of Abbreviations:<br />
ETF Exchange Traded Fund<br />
REIT Real Estate Investment Trust<br />
98
Accounting Standards Codification 820 established a three-tier hierarchy of inputs to establish a<br />
classification of fair value measurements for disclosure purposes. The three-tier hierarchy of inputs is<br />
summarized in the three broad Levels listed below:<br />
Level 1 — Unadjusted quoted prices in active markets for identical securities that the Fund has<br />
the ability to access.<br />
Level 2 — Observable inputs other than quoted prices included in Level 1 that are observable<br />
for the asset or liability, either directly or indirectly. These inputs may include<br />
quoted prices for the identical instrument on an inactive market, prices for similar<br />
instruments, interest rates, prepayment speeds, credit risk, yield curves, default rates<br />
and similar data.<br />
Level 3 — Unobservable inputs for the asset or liability, to the extent relevant observable inputs<br />
are not available, representing the Fund’s own assumption about the assumptions a<br />
market participant would use in valuing the asset or liability, and would be based on<br />
the best information available.<br />
The inputs methodology used for valuing securities are not necessarily an indication of the risk<br />
associated with investing in those securities. For example, amortized cost approximates the current<br />
fair value of a security, but since the value is not obtained from a quoted price in an active market,<br />
such securities are reflected as Level 2.<br />
The following is a summary, by category of Level, of inputs used to value the Fund’s investments as of<br />
March 31, 2014:<br />
Level 1 Level 2 Level 3 Total<br />
Common Stocks. . . . . . . . . . . . . . $ 808,063,243 $ — $ — $ 808,063,243<br />
Short-Term U.S. Government<br />
Obligations. . . . . . . . . . . . . . . . — 10,999,822 — 10,999,822<br />
Short-Term U.S. Government<br />
Agency Obligations . . . . . . . . . — 7,999,849 — 7,999,849<br />
Total Investments in Securities* . . $ 808,063,243 $ 18,999,671 $ — $ 827,062,914<br />
* The Portfolio of Investments provides information on the industry categorization for common stocks.<br />
There were no transfers into or from Level 1 and Level 2 by the Fund during the period ended<br />
March 31, 2014. Transfers, if any, between Levels are recognized at the end of the reporting period.<br />
See notes to financial statements<br />
99
Fund Expenses (unaudited)<br />
SPECIAL SITUATIONS FUND<br />
The examples below show the ongoing costs (in dollars) of investing in your Fund and will<br />
help you in comparing these costs with costs of other mutual funds. Please refer to page 4 for a<br />
detailed explanation of the information presented in these examples.<br />
Expense Example<br />
Annualized<br />
Expense<br />
Ratio<br />
Beginning<br />
Account Value<br />
(10/1/13)<br />
Ending<br />
Account Value<br />
(3/31/14)<br />
Expenses Paid<br />
During Period<br />
(10/1/13–3/31/14)*<br />
Class A Shares 1.35%<br />
Actual $1,000.00 $1,114.80 $ 7.12<br />
Hypothetical** $1,000.00 $1,018.20 $ 6.79<br />
Class B Shares 2.19%<br />
Actual $1,000.00 $1,109.67 $11.52<br />
Hypothetical** $1,000.00 $1,014.01 $11.00<br />
Advisor Class Shares 1.08%<br />
Actual $1,000.00 $1,114.03 $ 5.69<br />
Hypothetical** $1,000.00 $1,019.54 $ 5.44<br />
Institutional Class Shares 0.90%<br />
Actual $1,000.00 $1,116.80 $ 4.75<br />
Hypothetical** $1,000.00 $1,020.44 $ 4.53<br />
* Expenses are equal to the annualized expense ratio, multiplied by the average account value over<br />
the period, multiplied by 182/365 (to reflect the one-half year period). Expenses paid during the<br />
period are net of expenses waived.<br />
**Assumed rate of return of 5% before expenses.<br />
Portfolio Composition<br />
BY SECTOR<br />
Information Technology<br />
21.0%<br />
Financials<br />
19.2%<br />
Consumer Discretionary<br />
Industrials<br />
15.2%<br />
14.6%<br />
Energy<br />
9.6%<br />
Health Care<br />
7.7%<br />
Materials<br />
Utilities<br />
Consumer Staples<br />
2.4%<br />
3.4%<br />
4.1%<br />
Telecommunication<br />
Services<br />
0.6%<br />
Portfolio holdings and allocations are subject to change. Percentages are as of March 31, 2014, and<br />
are based on the total market value of investments.<br />
100
Portfolio of Investments (continued)<br />
SPECIAL SITUATIONS FUND<br />
March 31, 2014<br />
Shares Security Value<br />
COMMON STOCKS—99.0%<br />
Consumer Discretionary—15.4%<br />
63,500 Best Buy Company, Inc. $ 1,677,035<br />
2,700 * Container Store Group, Inc. 91,665<br />
213,150 CST Brands, Inc. 6,658,806<br />
25,300 Dana Holding Corporation 588,731<br />
60,475 * Deckers Outdoor Corporation 4,821,672<br />
45,125 * Express, Inc. 716,585<br />
255,725 * Fox Factory Holding Corporation 4,833,203<br />
35,125 Hanesbrands, Inc. 2,686,360<br />
40,000 Harman International Industries, Inc. 4,256,000<br />
90,725 * Jarden Corporation 5,428,077<br />
125,875 * Live Nation Entertainment, Inc. 2,737,781<br />
252,900 * Orient-Express Hotels, Ltd. – Class “A” 3,644,289<br />
88,300 Penske Automotive Group, Inc. 3,775,708<br />
252,000 Pier 1 Imports, Inc. 4,757,760<br />
202,525 Regal Entertainment Group – Class “A” 3,783,167<br />
228,400 Ruth’s Hospitality Group, Inc. 2,761,356<br />
96,075 * Starz – Class “A” 3,101,301<br />
65,425 Tupperware Brands Corporation 5,479,998<br />
2,200 * Vince Holding Corporation 57,992<br />
75,600 * Visteon Corporation 6,686,064<br />
105,550 * William Lyon Homes – Class “A” 2,914,235<br />
71,457,785<br />
Consumer Staples—2.4%<br />
66,900 Herbalife, Ltd. 3,831,363<br />
52,000 Nu Skin Enterprises, Inc. – Class “A” 4,308,200<br />
100,700 Pinnacle Foods, Inc. 3,006,902<br />
11,146,465<br />
Energy—9.7%<br />
33,700 * Dril-Quip, Inc. 3,777,770<br />
161,050 * Helix Energy Solutions Group, Inc. 3,700,929<br />
279,066 * Matrix Service Company 9,426,849<br />
3,500 * Navigator Holdings, Ltd. 91,000<br />
44,850 Noble Corporation, PLC 1,468,389<br />
129,500 * RSP Permian, Inc. 3,741,255<br />
214,575 * Stone Energy Corporation 9,005,713<br />
198,675 Western Refining, Inc. 7,668,855<br />
89,300 * Whiting Petroleum Corporation 6,196,527<br />
45,077,287<br />
101
Portfolio of Investments (continued)<br />
SPECIAL SITUATIONS FUND<br />
March 31, 2014<br />
Shares Security Value<br />
Financials—19.4%<br />
137,175 American Financial Group, Inc. $ 7,916,369<br />
14,200 Armada Hoffler Properties, Inc. (REIT) 142,568<br />
100,750 Aspen Insurance Holdings, Ltd. 3,999,775<br />
163,225 Berkshire Hills Bancorp, Inc. 4,224,263<br />
193,475 Brixmor Property Group, Inc. (REIT) 4,126,822<br />
100,500 Brown & Brown, Inc. 3,091,380<br />
60,700 City National Corporation 4,778,304<br />
152,200 Douglas Emmett, Inc. (REIT) 4,130,708<br />
40,125 Federal Realty Investment Trust (REIT) 4,603,140<br />
59,424 Fidelity National Financial, Inc. 1,868,291<br />
105,000 Financial Select Sector SPDR Fund (ETF) 2,345,700<br />
177,375 <strong>First</strong>Merit Corporation 3,694,721<br />
176,075 Montpelier Re Holdings, Ltd. 5,239,992<br />
148,525 Ocean<strong>First</strong> Financial Corporation 2,627,407<br />
178,150 Oritani Financial Corporation 2,816,552<br />
50,000 Prosperity Bancshares, Inc. 3,307,500<br />
156,875 Protective Life Corporation 8,250,056<br />
99,725 SPDR S&P Regional Banking (ETF) 4,126,621<br />
475,150 Sterling Bancorp 6,015,399<br />
276,325 * Strategic Hotels & Resorts, Inc. 2,815,752<br />
231,475 TCF Financial Corporation 3,856,374<br />
68,725 United Fire Group, Inc. 2,085,804<br />
55,750 Waddell & Reed Financial, Inc. – Class “A” 4,104,315<br />
90,167,813<br />
Health Care—7.8%<br />
100,000 * ANI Pharmaceuticals, Inc. 3,135,000<br />
120,050 * Centene Corporation 7,473,112<br />
132,250 * Exactech, Inc. 2,983,560<br />
78,575 Health Care Select Sector SPDR Fund (ETF) 4,595,852<br />
65,000 * Lannett Company, Inc. 2,321,800<br />
90,000 * Masimo Corporation 2,457,900<br />
100,450 Omnicare, Inc. 5,993,851<br />
84,700 PerkinElmer, Inc. 3,816,582<br />
32,500 * Salix Pharmaceuticals, Ltd. 3,367,325<br />
1,600 * Surgical Care Affiliates, Inc. 49,200<br />
36,194,182<br />
Industrials—14.8%<br />
76,400 Altra Industrial Motion Corporation 2,727,480<br />
44,200 Applied Industrial Technologies, Inc. 2,132,208<br />
102
Shares Security Value<br />
Industrials (continued)<br />
93,125 G&K Services, Inc. – Class “A” $ 5,696,456<br />
100,000 Generac Holdings, Inc. 5,897,000<br />
140,225 Industrial Select Sector SPDR Fund (ETF) 7,337,974<br />
136,475 ITT Corporation 5,835,671<br />
238,450 Kforce, Inc. 5,083,754<br />
94,550 * Korn/Ferry International 2,814,753<br />
320,800 * NCI Building Systems, Inc. 5,601,168<br />
10,250 Precision Castparts Corporation 2,590,790<br />
120,975 Ryder System, Inc. 9,668,322<br />
45,650 Snap-On, Inc. 5,180,362<br />
86,275 * United Rentals, Inc. 8,190,949<br />
68,756,887<br />
Information Technology—21.3%<br />
156,025 * Advanced Energy Industries, Inc. 3,822,612<br />
115,475 * ATMI, Inc. 3,927,305<br />
175,000 Avnet, Inc. 8,142,750<br />
191,100 * Blackhawk Network Holdings, Inc. 4,660,929<br />
242,300 CDW Corporation 6,648,712<br />
196,775 * CommScope Holding Company, Inc. 4,856,407<br />
200,000 * Entegris, Inc. 2,422,000<br />
178,300 * Finisar Corporation 4,726,733<br />
45,125 IAC/InterActiveCorp 3,221,474<br />
630,500 Intersil Corporation – Class “A” 8,146,060<br />
34,500 * King Digital Entertainment, PLC 627,555<br />
214,275 Mentor Graphics Corporation 4,718,335<br />
217,100 Methode Electronics, Inc. 6,656,286<br />
54,425 Microchip Technology, Inc. 2,599,338<br />
120,650 * Microsemi Corporation 3,019,869<br />
94,425 * NeuStar, Inc. – Class “A” 3,069,757<br />
353,925 * ON Semiconductor Corporation 3,326,895<br />
155,000 * Orbotech, Ltd. 2,385,450<br />
49,000 * OSI Systems, Inc. 2,933,140<br />
67,700 * Progress Software Corporation 1,475,860<br />
320,000 * Take-Two Interactive Software, Inc. 7,017,600<br />
64,975 Technology Select Sector SPDR Fund (ETF) 2,361,841<br />
401,050 * TriQuint Semiconductor, Inc. 5,370,060<br />
60,700 * Verint Systems, Inc. 2,848,651<br />
98,985,619<br />
103
Portfolio of Investments (continued)<br />
SPECIAL SITUATIONS FUND<br />
March 31, 2014<br />
Shares or<br />
Principal<br />
Amount Security Value<br />
Materials—4.2%<br />
107,725 AptarGroup, Inc. $ 7,120,622<br />
50,150 Sensient Technologies Corporation 2,828,962<br />
142,380 Westlake Chemical Corporation 9,422,708<br />
19,372,292<br />
Telecommunication Services—.6%<br />
205,475 NTELOS Holdings Corporation 2,773,912<br />
Utilities—3.4%<br />
91,275 AGL Resources, Inc. 4,468,824<br />
91,575 Portland General Electric Company 2,961,536<br />
75,350 SCANA Corporation 3,866,962<br />
100,125 Wisconsin Energy Corporation 4,660,819<br />
15,958,141<br />
Total Value of Common Stocks (cost $368,754,562) 459,890,383<br />
SHORT-TERM U.S. GOVERNMENT AGENCY<br />
OBLIGATIONS—2.2%<br />
Federal Home Loan Bank:<br />
$ 5,000 M 0.08%, 4/9/2014 4,999,911<br />
5,284 M 0.04%, 4/23/2014 5,283,871<br />
Total Value of Short-Term U.S. Government Agency Obligations (cost $10,283,782) 10,283,782<br />
Total Value of Investments (cost $379,038,344) 101.2% 470,174,165<br />
Excess of Liabilities Over Other Assets (1.2) (5,450,887)<br />
Net Assets 100.0% $464,723,278<br />
* Non-income producing<br />
Summary of Abbreviations:<br />
ETF Exchange Traded Fund<br />
REIT Real Estate Investment Trust<br />
104
Accounting Standards Codification 820 established a three-tier hierarchy of inputs to establish a<br />
classification of fair value measurements for disclosure purposes. The three-tier hierarchy of inputs is<br />
summarized in the three broad Levels listed below:<br />
Level 1 — Unadjusted quoted prices in active markets for identical securities that the Fund has<br />
the ability to access.<br />
Level 2 — Observable inputs other than quoted prices included in Level 1 that are observable<br />
for the asset or liability, either directly or indirectly. These inputs may include<br />
quoted prices for the identical instrument on an inactive market, prices for similar<br />
instruments, interest rates, prepayment speeds, credit risk, yield curves, default rates<br />
and similar data.<br />
Level 3 — Unobservable inputs for the asset or liability, to the extent relevant observable inputs<br />
are not available, representing the Fund’s own assumption about the assumptions a<br />
market participant would use in valuing the asset or liability, and would be based on<br />
the best information available.<br />
The inputs methodology used for valuing securities are not necessarily an indication of the risk<br />
associated with investing in those securities. For example, amortized cost approximates the current<br />
fair value of a security, but since the value is not obtained from a quoted price in an active market,<br />
such securities are reflected as Level 2.<br />
The following is a summary, by category of Level, of inputs used to value the Fund’s investments as of<br />
March 31, 2014:<br />
Level 1 Level 2 Level 3 Total<br />
Common Stocks. . . . . . . . . . . . . . $ 459,890,383 $ — $ — $ 459,890,383<br />
Short-Term U.S. Government<br />
Agency Obligations . . . . . . . . . — 10,283,782 — 10,283,782<br />
Total Investments in Securities* . . $ 459,890,383 $ 10,283,782 $ — $ 470,174,165<br />
* The Portfolio of Investments provides information on the industry categorization for common stocks.<br />
There were no transfers into or from Level 1 and Level 2 by the Fund during the period ended<br />
March 31, 2014. Transfers, if any, between Levels are recognized at the end of the reporting period.<br />
See notes to financial statements<br />
105
Fund Expenses (unaudited)<br />
INTERNATIONAL FUND<br />
The examples below show the ongoing costs (in dollars) of investing in your Fund and will<br />
help you in comparing these costs with costs of other mutual funds. Please refer to page 4 for a<br />
detailed explanation of the information presented in these examples.<br />
Expense Example<br />
Annualized<br />
Expense<br />
Ratio<br />
Beginning<br />
Account Value<br />
(10/1/13)<br />
Ending<br />
Account Value<br />
(3/31/14)<br />
Expenses Paid<br />
During Period<br />
(10/1/13–3/31/14)*<br />
Class A Shares 1.65%<br />
Actual $1,000.00 $1,056.31 $ 8.46<br />
Hypothetical** $1,000.00 $1,016.70 $ 8.30<br />
Class B Shares 2.51%<br />
Actual $1,000.00 $1,051.75 $12.84<br />
Hypothetical** $1,000.00 $1,012.41 $12.59<br />
Advisor Class Shares 1.36%<br />
Actual $1,000.00 $1,055.77 $ 6.97<br />
Hypothetical** $1,000.00 $1,018.15 $ 6.84<br />
Institutional Class Shares 1.17%<br />
Actual $1,000.00 $1,059.72 $ 6.01<br />
Hypothetical** $1,000.00 $1,019.10 $ 5.89<br />
* Expenses are equal to the annualized expense ratio, multiplied by the average account value over<br />
the period, multiplied by 182/365 (to reflect the one-half year period).<br />
**Assumed rate of return of 5% before expenses.<br />
Portfolio Composition<br />
BY SECTOR<br />
Consumer Staples<br />
35.3%<br />
Financials<br />
Health Care<br />
Consumer Discretionary<br />
Industrials<br />
15.7%<br />
14.2%<br />
11.5%<br />
9.9%<br />
Information Technology<br />
Materials<br />
Energy<br />
4.1%<br />
4.0%<br />
3.9%<br />
Telecommunication<br />
Services<br />
Utilities<br />
0.6%<br />
0.4%<br />
Portfolio holdings and allocations are subject to change. Percentages are as of March 31, 2014, and<br />
are based on the total market value of investments.<br />
106
Portfolio of Investments (continued)<br />
INTERNATIONAL FUND<br />
March 31, 2014<br />
Shares Security Value<br />
COMMON STOCKS—98.6%<br />
Switzerland—18.0%<br />
22,233 Compagnie Financiere Richemont SA $ 2,124,260<br />
46,479 * DKSH Holding, Ltd. 3,698,957<br />
813 * Lindt & Spruengli AG 4,033,017<br />
130,889 Nestle SA – Registered 9,860,942<br />
17,801 Roche Holding AG – Genusscheine 5,340,199<br />
2,575 SGS SA – Registered 6,351,871<br />
462,649 * UBS AG – Registered 9,563,560<br />
40,972,806<br />
United Kingdom—17.8%<br />
163,830 Barratt Developments, PLC 1,126,650<br />
227,042 British American Tobacco, PLC 12,625,220<br />
191,289 Diageo, PLC 5,934,829<br />
227,037 Domino’s Pizza Group, PLC 2,087,440<br />
228,543 Fresnillo, PLC 3,213,844<br />
5,485 Intertek Group, PLC 280,912<br />
92,886 * Persimmon, PLC 2,084,333<br />
35,524 Reckitt Benckiser Group, PLC 2,894,250<br />
217,233 * Rolls-Royce Holdings, PLC 3,889,573<br />
126,906 SABMiller, PLC 6,336,520<br />
40,473,571<br />
India—10.2%<br />
575,389 HDFC Bank, Ltd. 7,214,220<br />
369 HDFC Bank, Ltd. (ADR) 15,140<br />
139,621 Hindustan Unilever, Ltd. 1,415,672<br />
571,224 Housing Development Finance Corporation, Ltd. 8,454,182<br />
1,061,058 ITC, Ltd. 6,268,899<br />
23,368,113<br />
France—8.8%<br />
203,137 Bureau Veritas SA 6,230,793<br />
35,538 Essilor International SA 3,585,343<br />
6,619 Hermes International 2,204,022<br />
27,724 Legrand SA 1,723,102<br />
18,832 L’Oreal SA 3,106,828<br />
26,967 Pernod Ricard SA 3,140,624<br />
19,990,712<br />
107
Portfolio of Investments (continued)<br />
INTERNATIONAL FUND<br />
March 31, 2014<br />
Shares Security Value<br />
Canada—7.4%<br />
28,624 Alimentation Couche-Tard – Class “B” $ 2,322,077<br />
59,143 Bank of Nova Scotia 3,438,466<br />
90,922 Enbridge, Inc. 4,145,961<br />
179,244 Goldcorp, Inc. 4,393,610<br />
45,778 Shaw Communications, Inc. – Class “B” 1,096,184<br />
63,245 Silver Wheaton Corporation 1,438,806<br />
16,835,104<br />
United States—7.3%<br />
52,900 Covidien, PLC 3,896,614<br />
123,745 Philip Morris International, Inc. 10,131,003<br />
2,168 Priceline.com, Inc. 2,584,018<br />
16,611,635<br />
Netherlands—6.3%<br />
23,837 Core Laboratories NV 4,730,214<br />
235,565 Unilever NV – CVA 9,686,424<br />
14,416,638<br />
Hong Kong—3.9%<br />
148,527 Cheung Kong Infrastructure Holdings, Ltd. 947,794<br />
177,831 Galaxy Entertainment Group, Ltd. 1,546,297<br />
410,184 Link REIT (REIT) 2,017,329<br />
557,968 L’Occitane International SA 1,375,310<br />
409,956 Sands China, Ltd. 3,062,627<br />
8,949,357<br />
Denmark—3.6%<br />
182,753 Novo Nordisk A/S-Series “B” 8,326,277<br />
Australia—3.0%<br />
51,741 CSL, Ltd. 3,335,839<br />
76,359 Ramsay Health Care, Ltd. 3,406,331<br />
6,742,170<br />
Brazil—2.1%<br />
74,171 Cielo SA 2,364,663<br />
159,515 Itau Unibanco Holding SA (ADR) 2,370,393<br />
4,735,056<br />
108
Shares or<br />
Principal<br />
Amount Security Value<br />
China—1.6%<br />
10,824 * Baidu.com, Inc. (ADR) $ 1,649,361<br />
27,159 Tencent Holdings, Ltd. 1,888,899<br />
3,538,260<br />
Germany—1.4%<br />
39,477 SAP AG 3,197,073<br />
Spain—1.4%<br />
57,108 Grifols SA 3,130,645<br />
Ireland—1.1%<br />
31,777 Paddy Power, PLC 2,518,300<br />
Japan—1.1%<br />
26,000 Daito Trust Construction Company, Ltd. 2,411,283<br />
South Africa—1.0%<br />
20,405 Naspers, Ltd. 2,253,030<br />
Mexico—.8%<br />
812,420 Wal-Mart de Mexico SAB de CV 1,936,297<br />
Italy—.8%<br />
31,591 Luxottica Group SpA 1,827,816<br />
Indonesia—.5%<br />
6,331,441 PT Telekomunikasi Indonesia Persero Tbk (a) 1,237,611<br />
Sweden—.5%<br />
81,158 Elekta AB – Class “B” 1,079,637<br />
Total Value of Common Stocks (cost $166,940,821) 224,551,391<br />
SHORT-TERM U.S. GOVERNMENT<br />
OBLIGATIONS—.4%<br />
United States<br />
$ 1,000 M U.S. Treasury Bills, 0.02%, 4/17/2014 (cost $999,991) 999,991<br />
Total Value of Investments (cost $167,940,812) 99.0% 225,551,382<br />
Other Assets, Less Liabilities 1.0 2,313,604<br />
Net Assets 100.0% $227,864,986<br />
* Non-income producing<br />
(a) Securities valued at fair value (see Note 1A)<br />
109
Portfolio of Investments (continued)<br />
INTERNATIONAL FUND<br />
March 31, 2014<br />
Summary of Abbreviations:<br />
ADR American Depositary Receipts<br />
REIT Real Estate Investment Trust<br />
Accounting Standards Codification 820 established a three-tier hierarchy of inputs to establish a<br />
classification of fair value measurements for disclosure purposes. The three-tier hierarchy of inputs is<br />
summarized in the three broad Levels listed below:<br />
Level 1 — Unadjusted quoted prices in active markets for identical securities that the Fund has<br />
the ability to access.<br />
Level 2 — Observable inputs other than quoted prices included in Level 1 that are observable<br />
for the asset or liability, either directly or indirectly. These inputs may include quoted<br />
prices for the identical instrument on an inactive market, prices for similar instruments,<br />
interest rates, prepayment speeds, credit risk, yield curves, default rates and<br />
similar data.<br />
Level 3 — Unobservable inputs for the asset or liability, to the extent relevant observable inputs<br />
are not available, representing the Fund’s own assumption about the assumptions a<br />
market participant would use in valuing the asset or liability, and would be based on<br />
the best information available.<br />
The inputs methodology used for valuing securities are not necessarily an indication of the risk<br />
associated with investing in those securities. For example, amortized cost approximates the current<br />
fair value of a security, but since the value is not obtained from a quoted price in an active market,<br />
such securities are reflected as Level 2.<br />
The following is a summary, by category of Level, of inputs used to value the Fund’s investments as of<br />
March 31, 2014:<br />
Level 1 Level 2 Level 3 Total<br />
Common Stocks<br />
Switzerland . . . . . . . . . . . . . . $ 40,972,806 $ — $ — $ 40,972,806<br />
United Kingdom . . . . . . . . . . 40,473,571 — — 40,473,571<br />
India . . . . . . . . . . . . . . . . . . . . 23,368,113 — — 23,368,113<br />
France . . . . . . . . . . . . . . . . . . 19,990,712 — — 19,990,712<br />
Canada . . . . . . . . . . . . . . . . . . 16,835,104 — — 16,835,104<br />
United States . . . . . . . . . . . . . 16,611,635 — — 16,611,635<br />
Netherlands . . . . . . . . . . . . . . 14,416,638 — — 14,416,638<br />
Hong Kong. . . . . . . . . . . . . . . 8,949,357 — — 8,949,357<br />
Denmark . . . . . . . . . . . . . . . . 8,326,277 — — 8,326,277<br />
Australia. . . . . . . . . . . . . . . . . 6,742,170 — — 6,742,170<br />
Brazil . . . . . . . . . . . . . . . . . . . 4,735,056 — — 4,735,056<br />
China . . . . . . . . . . . . . . . . . . . 3,538,260 — — 3,538,260<br />
Germany . . . . . . . . . . . . . . . . 3,197,073 — — 3,197,073<br />
Spain . . . . . . . . . . . . . . . . . . . 3,130,645 — — 3,130,645<br />
Ireland . . . . . . . . . . . . . . . . . . 2,518,300 — — 2,518,300<br />
110
Level 1 Level 2 Level 3 Total<br />
Japan . . . . . . . . . . . . . . . . . . . $ 2,411,283 $ — $ — $ 2,411,283<br />
South Africa. . . . . . . . . . . . . . 2,253,030 — — 2,253,030<br />
Mexico . . . . . . . . . . . . . . . . . . 1,936,297 — — 1,936,297<br />
Italy . . . . . . . . . . . . . . . . . . . . 1,827,816 — — 1,827,816<br />
Indonesia . . . . . . . . . . . . . . . . — 1,237,611 — 1,237,611<br />
Sweden. . . . . . . . . . . . . . . . . . 1,079,637 — — 1,079,637<br />
Short-Term U.S. Government<br />
Obligations. . . . . . . . . . . . . . . — 999,991 — 999,991<br />
Total Investments<br />
in Securities . . . . . . . . . . . . . . $ 223,313,780 $ 2,237,602* $ — $ 225,551,382<br />
* Includes certain foreign securities that were fair valued due to fluctuation in U.S. securities markets<br />
exceeding a predetermined level or a foreign market being closed; therefore, $1,237,611 of investment<br />
securities were classified as Level 2 instead of Level 1.<br />
During the period ended March 31, 2014, there were no transfers between Level 1 investments and<br />
Level 2 investments that had a material impact to the Fund. This does not include transfers between<br />
Level 1 investments and Level 2 investments due to the Fund utilizing international fair value pricing<br />
during the period (see Note 1A). Transfers, if any, between Levels are recognized at the end of the<br />
reporting period.<br />
See notes to financial statements<br />
111
Statements of Assets and Liabilities<br />
FIRST INVESTORS INCOME FUNDS<br />
March 31, 2014<br />
CASH<br />
MANAGEMENT<br />
Assets<br />
Investments in securities:<br />
Cost – Unaffiliated issuers . . . . . . . . . . . . . . . . . . . . . . . . . . $ 140,584,494<br />
Cost – Affiliated issuers (Note 2) . . . . . . . . . . . . . . . . . . . . . . . —<br />
Total cost of investments . . . . . . . . . . . . . . . . . . . . . . . . . . . $ 140,584,494<br />
Value – Unaffiliated issuers (Note 1A) . . . . . . . . . . . . . . . . . . . . $ 140,584,494<br />
Value – Affiliated issuers (Note 2) . . . . . . . . . . . . . . . . . . . . . . —<br />
Total value of investments. . . . . . . . . . . . . . . . . . . . . . . . . . . 140,584,494<br />
Cash . . . . . . . . . . . . . . . . . . . . . . . . . . . . . . . . . . . . . . . 988,457<br />
Receivables:<br />
Investment securities sold . . . . . . . . . . . . . . . . . . . . . . . . . . . —<br />
Dividends and interest. . . . . . . . . . . . . . . . . . . . . . . . . . . . . 316<br />
Shares sold . . . . . . . . . . . . . . . . . . . . . . . . . . . . . . . . . . —<br />
Other assets . . . . . . . . . . . . . . . . . . . . . . . . . . . . . . . . . . . 13,335<br />
Total Assets . . . . . . . . . . . . . . . . . . . . . . . . . . . . . . . . . . . 141,586,602<br />
Liabilities<br />
Payables:<br />
Investment securities purchased. . . . . . . . . . . . . . . . . . . . . . . . —<br />
Shares redeemed. . . . . . . . . . . . . . . . . . . . . . . . . . . . . . . . 564,107<br />
Dividends payable. . . . . . . . . . . . . . . . . . . . . . . . . . . . . . . —<br />
Accrued advisory fees . . . . . . . . . . . . . . . . . . . . . . . . . . . . . . —<br />
Accrued shareholder servicing costs. . . . . . . . . . . . . . . . . . . . . . . 38,412<br />
Accrued expenses . . . . . . . . . . . . . . . . . . . . . . . . . . . . . . . . 14,832<br />
Total Liabilities . . . . . . . . . . . . . . . . . . . . . . . . . . . . . . . . . 617,351<br />
Net Assets $ 140,969,251<br />
Net Assets Consist of:<br />
Capital paid in . . . . . . . . . . . . . . . . . . . . . . . . . . . . . . . . . . $ 140,969,251<br />
Undistributed net investment income (deficit). . . . . . . . . . . . . . . . . . —<br />
Accumulated net realized gain (loss) on investments . . . . . . . . . . . . . . —<br />
Net unrealized appreciation in value of investments . . . . . . . . . . . . . . —<br />
Total . . . . . . . . . . . . . . . . . . . . . . . . . . . . . . . . . . . . . . . $ 140,969,251<br />
112<br />
See notes to financial statements
GOVERNMENT<br />
INVESTMENT<br />
GRADE<br />
STRATEGIC<br />
INCOME<br />
$ 366,271,263 $ 514,273,727 $ —<br />
— — 74,762,094<br />
$ 366,271,263 $ 514,273,727 $ 74,762,094<br />
$ 371,196,603 $ 544,868,417 $ —<br />
— — 75,402,030<br />
371,196,603 544,868,417 75,402,030<br />
14,350,231 15,946,031 355,438<br />
5,618,644 2,520,441 —<br />
1,139,723 7,480,390 258,841<br />
452,497 860,640 512,487<br />
39,095 55,129 4,936<br />
392,796,793 571,731,048 76,533,732<br />
31,245,827 4,658,775 —<br />
852,751 1,344,923 110,396<br />
54,947 165,461 6,848<br />
168,795 263,503 3,159<br />
49,830 69,310 13,721<br />
45,400 30,822 67,361<br />
32,417,550 6,532,794 201,485<br />
$ 360,379,243 $ 565,198,254 $ 76,332,247<br />
$ 371,718,614 $ 553,391,933 $ 75,472,057<br />
(1,093,971) (8,560,347) 76,552<br />
(15,170,740) (10,228,022) 143,702<br />
4,925,340 30,594,690 639,936<br />
$ 360,379,243 $ 565,198,254 $ 76,332,247<br />
113
Statements of Assets and Liabilities<br />
FIRST INVESTORS INCOME FUNDS<br />
March 31, 2014<br />
CASH<br />
MANAGEMENT<br />
Net Assets:<br />
Class A . . . . . . . . . . . . . . . . . . . . . . . . . . . . . . . . . . . . $ 137,719,418<br />
Class B . . . . . . . . . . . . . . . . . . . . . . . . . . . . . . . . . . . . $701,570<br />
Advisor Class . . . . . . . . . . . . . . . . . . . . . . . . . . . . . . . . .<br />
N/A<br />
Institutional Class . . . . . . . . . . . . . . . . . . . . . . . . . . . . . . . $2,548,263<br />
Shares outstanding (Note 8):<br />
Class A . . . . . . . . . . . . . . . . . . . . . . . . . . . . . . . . . . . . 137,719,418<br />
Class B . . . . . . . . . . . . . . . . . . . . . . . . . . . . . . . . . . . . 701,570<br />
Advisor Class . . . . . . . . . . . . . . . . . . . . . . . . . . . . . . . . .<br />
N/A<br />
Institutional Class . . . . . . . . . . . . . . . . . . . . . . . . . . . . . . . 2,548,263<br />
Net asset value and redemption price<br />
per share – Class A. . . . . . . . . . . . . . . . . . . . . . . . . . . . . . $ 1.00#<br />
Maximum offering price per share – Class A<br />
(Net asset value/.9425)*. . . . . . . . . . . . . . . . . . . . . . . . . . . .<br />
N/A<br />
Net asset value and offering price per share –<br />
Class B** . . . . . . . . . . . . . . . . . . . . . . . . . . . . . . . . . . . $ 1.00<br />
Net asset value, offering price and redemption price<br />
per share – Advisor Class . . . . . . . . . . . . . . . . . . . . . . . . . .<br />
N/A<br />
Net asset value, offering price and redemption price<br />
per share – Institutional Class. . . . . . . . . . . . . . . . . . . . . . . . $ 1.00<br />
# Also maximum offering price per share.<br />
* On purchases of $100,000 or more, the sales charge is reduced.<br />
** Redemption price is equal to net asset value less contingent deferred sales charges, if applicable.<br />
114 See notes to financial statements
GOVERNMENT<br />
INVESTMENT<br />
GRADE<br />
STRATEGIC<br />
INCOME<br />
$ 348,554,775 $ 542,997,539 $76,091,012<br />
$3,828,985 $5,466,335 N/A<br />
$1,247 $1,009 $241,235<br />
$7,994,236 $16,733,371 N/A<br />
32,109,449 54,853,031 7,596,277<br />
353,635 554,228 N/A<br />
115 102 24,123<br />
734,447 1,687,762 N/A<br />
$ 10.86 $ 9.90 $ 10.02<br />
$ 11.52 $ 10.50 $ 10.63<br />
$ 10.83 $ 9.86 N/A<br />
$ 10.84 $ 9.89 $ 10.00<br />
$ 10.88 $ 9.91 N/A<br />
115
Statements of Assets and Liabilities<br />
FIRST INVESTORS INCOME FUNDS<br />
March 31, 2014<br />
INTERNATIONAL<br />
OPPORTUNITIES<br />
BOND<br />
Assets<br />
Investments in securities:<br />
At indentified cost . . . . . . . . . . . . . . . . . . . . . . . . . . . . . . . $ 98,731,533<br />
At value (Note 1A) . . . . . . . . . . . . . . . . . . . . . . . . . . . . . . $ 98,679,885<br />
Cash . . . . . . . . . . . . . . . . . . . . . . . . . . . . . . . . . . . . . . . 8,152,333<br />
Receivables:<br />
Investment securities sold . . . . . . . . . . . . . . . . . . . . . . . . . . . —<br />
Dividends and interest. . . . . . . . . . . . . . . . . . . . . . . . . . . . . 875,775<br />
Shares sold . . . . . . . . . . . . . . . . . . . . . . . . . . . . . . . . . . 190,951<br />
Unrealized gain of foreign exchange contracts (Note 7) . . . . . . . . . . . .<br />
Other assets . . . . . . . . . . . . . . . . . . . . . . . . . . . . . . . . . . .<br />
900,373<br />
11,109<br />
Total Assets . . . . . . . . . . . . . . . . . . . . . . . . . . . . . . . . . . . 108,810,426<br />
Liabilities<br />
Payables:<br />
Investment securities purchased. . . . . . . . . . . . . . . . . . . . . . . . 1,220,699<br />
Shares redeemed. . . . . . . . . . . . . . . . . . . . . . . . . . . . . . . . 218,854<br />
Dividends payable. . . . . . . . . . . . . . . . . . . . . . . . . . . . . . . 23,480<br />
Unrealized loss of foreign exchange contracts (Note 7). . . . . . . . . . . . . 697,515<br />
Accrued advisory fees . . . . . . . . . . . . . . . . . . . . . . . . . . . . . . 60,567<br />
Accrued shareholder servicing costs. . . . . . . . . . . . . . . . . . . . . . . 19,632<br />
Accrued expenses . . . . . . . . . . . . . . . . . . . . . . . . . . . . . . . . 57,925<br />
Total Liabilities . . . . . . . . . . . . . . . . . . . . . . . . . . . . . . . . . 2,298,672<br />
Net Assets $ 106,511,754<br />
Net Assets Consist of:<br />
Capital paid in . . . . . . . . . . . . . . . . . . . . . . . . . . . . . . . . . . $ 108,599,037<br />
Net investment deficit . . . . . . . . . . . . . . . . . . . . . . . . . . . . . . (368,004)<br />
Accumulated net realized gain (loss) on investments and<br />
foreign currency transactions . . . . . . . . . . . . . . . . . . . . . . . . . (1,881,083)<br />
Net unrealized appreciation in value of investments<br />
and foreign currency transactions . . . . . . . . . . . . . . . . . . . . . . . 161,804<br />
Total . . . . . . . . . . . . . . . . . . . . . . . . . . . . . . . . . . . . . . . $ 106,511,754<br />
116<br />
See notes to financial statements
FLOATING<br />
RATE<br />
FUND FOR<br />
INCOME<br />
$ 66,311,044 $ 668,621,939<br />
$ 66,463,840 $ 697,805,579<br />
10,661,708 11,936,464<br />
404,874 3,168,789<br />
289,585 12,060,760<br />
734,946 662,824<br />
—<br />
—<br />
—<br />
66,901<br />
78,554,953 725,701,317<br />
8,196,403 11,198,106<br />
92,953 1,235,283<br />
12,260 537,045<br />
— —<br />
20,819 421,806<br />
14,013 93,749<br />
41,698 36,231<br />
8,378,146 13,522,220<br />
$ 70,176,807 $ 712,179,097<br />
$ 70,080,926 $ 852,762,447<br />
(57,015) (4,642,072)<br />
100 (165,124,918)<br />
152,796 29,183,640<br />
$ 70,176,807 $ 712,179,097<br />
117
Statements of Assets and Liabilities<br />
FIRST INVESTORS INCOME FUNDS<br />
March 31, 2014<br />
INTERNATIONAL<br />
OPPORTUNITIES<br />
BOND<br />
Net Assets:<br />
Class A . . . . . . . . . . . . . . . . . . . . . . . . . . . . . . . . . . . . $98,464,003<br />
Class B . . . . . . . . . . . . . . . . . . . . . . . . . . . . . . . . . . . .<br />
N/A<br />
Advisor Class . . . . . . . . . . . . . . . . . . . . . . . . . . . . . . . . . $1,006<br />
Institutional Class . . . . . . . . . . . . . . . . . . . . . . . . . . . . . . . $8,046,745<br />
Shares outstanding (Note 8):<br />
Class A . . . . . . . . . . . . . . . . . . . . . . . . . . . . . . . . . . . . 9,878,825<br />
Class B . . . . . . . . . . . . . . . . . . . . . . . . . . . . . . . . . . . .<br />
N/A<br />
Advisor Class . . . . . . . . . . . . . . . . . . . . . . . . . . . . . . . . . 101<br />
Institutional Class . . . . . . . . . . . . . . . . . . . . . . . . . . . . . . . 805,394<br />
Net asset value and redemption price<br />
per share – Class A. . . . . . . . . . . . . . . . . . . . . . . . . . . . . . $ 9.97<br />
Maximum offering price per share – Class A<br />
(Net asset value/.9425)*. . . . . . . . . . . . . . . . . . . . . . . . . . . . $ 10.58<br />
Net asset value and offering price per share –<br />
Class B** . . . . . . . . . . . . . . . . . . . . . . . . . . . . . . . . . . .<br />
N/A<br />
Net asset value, offering price and redemption price<br />
per share – Advisor Class . . . . . . . . . . . . . . . . . . . . . . . . . . $ 9.96<br />
Net asset value, offering price and redemption price<br />
per share – Institutional Class. . . . . . . . . . . . . . . . . . . . . . . . $ 9.99<br />
* On purchases of $100,000 or more, the sales charge is reduced.<br />
** Redemption price is equal to net asset value less contingent deferred sales charges, if applicable.<br />
118 See notes to financial statements
FLOATING<br />
RATE<br />
FUND FOR<br />
INCOME<br />
$66,126,173 $ 673,947,773<br />
N/A $5,029,645<br />
$1,022 $1,060<br />
$4,049,612 $33,200,619<br />
6,598,586 252,309,903<br />
N/A 1,886,454<br />
102 397<br />
404,677 12,384,011<br />
$ 10.02 $ 2.67<br />
$ 10.63 $ 2.83<br />
N/A $ 2.67<br />
$ 10.02 $ 2.67<br />
$ 10.01 $ 2.68<br />
119
Statements of Assets and Liabilities<br />
FIRST INVESTORS EQUITY FUNDS<br />
March 31, 2014<br />
TOTAL<br />
RETURN<br />
Assets<br />
Investments in securities:<br />
At identified cost . . . . . . . . . . . . . . . . . . . . . . . . . . . . . . . $ 554,870,068<br />
At value (Note 1A) . . . . . . . . . . . . . . . . . . . . . . . . . . . . . . $ 739,668,870<br />
Cash . . . . . . . . . . . . . . . . . . . . . . . . . . . . . . . . . . . . . . . 1,555,437<br />
Receivables:<br />
Investment securities sold . . . . . . . . . . . . . . . . . . . . . . . . . . . 939,307<br />
Dividends and interest. . . . . . . . . . . . . . . . . . . . . . . . . . . . . 3,266,738<br />
Shares sold . . . . . . . . . . . . . . . . . . . . . . . . . . . . . . . . . . 1,143,213<br />
Other assets . . . . . . . . . . . . . . . . . . . . . . . . . . . . . . . . . . . 69,276<br />
Total Assets . . . . . . . . . . . . . . . . . . . . . . . . . . . . . . . . . . . 746,642,841<br />
Liabilities<br />
Payables:<br />
Investment securities purchased. . . . . . . . . . . . . . . . . . . . . . . . 2,039,049<br />
Shares redeemed. . . . . . . . . . . . . . . . . . . . . . . . . . . . . . . . 1,353,651<br />
Dividends payable. . . . . . . . . . . . . . . . . . . . . . . . . . . . . . . 40,359<br />
Accrued advisory fees . . . . . . . . . . . . . . . . . . . . . . . . . . . . . . 441,069<br />
Accrued shareholder servicing costs. . . . . . . . . . . . . . . . . . . . . . . 100,725<br />
Accrued expenses . . . . . . . . . . . . . . . . . . . . . . . . . . . . . . . . 47,387<br />
Total Liabilities . . . . . . . . . . . . . . . . . . . . . . . . . . . . . . . . . 4,022,240<br />
Net Assets . . . . . . . . . . . . . . . . . . . . . . . . . . . . . . . . . . . . $ 742,620,601<br />
Net Assets Consist of:<br />
Capital paid in . . . . . . . . . . . . . . . . . . . . . . . . . . . . . . . . . . $ 552,106,953<br />
Undistributed net investment income (deficit). . . . . . . . . . . . . . . . . . (4,045,653)<br />
Accumulated net realized gain on investments<br />
and foreign currency transactions . . . . . . . . . . . . . . . . . . . . . . . 9,760,499<br />
Net unrealized appreciation in value of investments<br />
and foreign currency transactions . . . . . . . . . . . . . . . . . . . . . . . 184,798,802<br />
Total . . . . . . . . . . . . . . . . . . . . . . . . . . . . . . . . . . . . . . . $ 742,620,601<br />
120<br />
See notes to financial statements
EQUITY<br />
INCOME<br />
GROWTH &<br />
INCOME<br />
GLOBAL<br />
$ 396,248,678 $ 1,059,409,180 $ 365,507,154<br />
$ 543,404,672 $ 1,735,600,423 $ 391,069,702<br />
281,354 2,898,678 1,348,272<br />
2,502,348 3,616,668 270,186<br />
878,605 1,703,364 749,054<br />
467,975 2,328,814 731,212<br />
48,745 155,433 31,400<br />
547,583,699 1,746,303,380 394,199,826<br />
4,337,450 2,939,770 3,662,344<br />
1,007,890 3,332,834 684,209<br />
49,197 21,620 —<br />
334,787 999,670 295,317<br />
70,993 227,932 60,495<br />
46,224 87,560 56,905<br />
5,846,541 7,609,386 4,759,270<br />
$ 541,737,158 $ 1,738,693,994 $ 389,440,556<br />
$ 383,314,418 $ 1,035,093,347 $ 304,600,576<br />
1,857,799 2,499,251 (525,229)<br />
9,408,947 24,910,153 59,793,909<br />
147,155,994 676,191,243 25,571,300<br />
$ 541,737,158 $ 1,738,693,994 $ 389,440,556<br />
121
Statements of Assets and Liabilities<br />
FIRST INVESTORS EQUITY FUNDS<br />
March 31, 2014<br />
TOTAL<br />
RETURN<br />
Net Assets:<br />
Class A . . . . . . . . . . . . . . . . . . . . . . . . . . . . . . . . . . . . $ 729,729,135<br />
Class B . . . . . . . . . . . . . . . . . . . . . . . . . . . . . . . . . . . . $10,220,942<br />
Advisor Class . . . . . . . . . . . . . . . . . . . . . . . . . . . . . . . . . $1,133<br />
Institutional Class . . . . . . . . . . . . . . . . . . . . . . . . . . . . . . . $2,669,391<br />
Shares outstanding (Note 8):<br />
Class A . . . . . . . . . . . . . . . . . . . . . . . . . . . . . . . . . . . . 37,960,536<br />
Class B . . . . . . . . . . . . . . . . . . . . . . . . . . . . . . . . . . . . 541,370<br />
Advisor Class . . . . . . . . . . . . . . . . . . . . . . . . . . . . . . . . . 59<br />
Institutional Class . . . . . . . . . . . . . . . . . . . . . . . . . . . . . . . 138,816<br />
Net asset value and redemption price per share – Class A . . . . . . . . . $ 19.22<br />
Maximum offering price per share – Class A<br />
(Net asset value/.9425)*. . . . . . . . . . . . . . . . . . . . . . . . . . . . $ 20.39<br />
Net asset value and offering price per share – Class B** . . . . . . . . . . $ 18.88<br />
Net asset value, offering price and redemption price<br />
per share – Advisor Class . . . . . . . . . . . . . . . . . . . . . . . . . .<br />
Net asset value, offering price and redemption price<br />
per share – Institutional Class. . . . . . . . . . . . . . . . . . . . . . . .<br />
$ 19.21<br />
$ 19.23<br />
* On purchases of $100,000 or more, the sales charge is reduced.<br />
** Redemption price is equal to net asset value less contingent deferred sales charges, if applicable.<br />
122 See notes to financial statements
EQUITY<br />
INCOME<br />
GROWTH &<br />
INCOME<br />
GLOBAL<br />
$ 525,780,325 $ 1,702,118,661 $ 382,266,415<br />
$6,335,128 $27,313,936 $4,297,645<br />
$1,189 $1,230 $1,173<br />
$9,620,516 $9,260,167 $2,875,323<br />
54,359,523 77,655,845 45,503,810<br />
666,039 1,329,621 597,885<br />
123 56 139<br />
991,622 422,531 339,444<br />
$ 9.67 $ 21.92 $ 8.40<br />
$ 10.26 $ 23.26 $ 8.91<br />
$ 9.51 $ 20.54 $ 7.19<br />
$ 9.67 $ 21.97 $ 8.44<br />
$ 9.70 $ 21.92 $ 8.47<br />
123
Statements of Assets and Liabilities<br />
FIRST INVESTORS EQUITY FUNDS<br />
March 31, 2014<br />
SELECT<br />
GROWTH<br />
Assets<br />
Investments in securities:<br />
At identified cost . . . . . . . . . . . . . . . . . . . . . . . . . . . . . . . $ 249,680,976<br />
At value (Note 1A) . . . . . . . . . . . . . . . . . . . . . . . . . . . . . . $ 363,131,890<br />
Cash . . . . . . . . . . . . . . . . . . . . . . . . . . . . . . . . . . . . . . . 1,034,855<br />
Receivables:<br />
Investment securities sold . . . . . . . . . . . . . . . . . . . . . . . . . . . —<br />
Dividends and interest. . . . . . . . . . . . . . . . . . . . . . . . . . . . . 234,522<br />
Shares sold . . . . . . . . . . . . . . . . . . . . . . . . . . . . . . . . . . 342,853<br />
Other assets . . . . . . . . . . . . . . . . . . . . . . . . . . . . . . . . . . . 32,109<br />
Total Assets . . . . . . . . . . . . . . . . . . . . . . . . . . . . . . . . . . . 364,776,229<br />
Liabilities<br />
Payables:<br />
Investment securities purchased. . . . . . . . . . . . . . . . . . . . . . . . —<br />
Shares redeemed. . . . . . . . . . . . . . . . . . . . . . . . . . . . . . . . 726,907<br />
Accrued advisory fees . . . . . . . . . . . . . . . . . . . . . . . . . . . . . . 231,478<br />
Accrued shareholder servicing costs. . . . . . . . . . . . . . . . . . . . . . . 54,277<br />
Accrued expenses . . . . . . . . . . . . . . . . . . . . . . . . . . . . . . . . 38,555<br />
Total Liabilities . . . . . . . . . . . . . . . . . . . . . . . . . . . . . . . . . 1,051,217<br />
Net Assets . . . . . . . . . . . . . . . . . . . . . . . . . . . . . . . . . . . . $ 363,725,012<br />
Net Assets Consist of:<br />
Capital paid in . . . . . . . . . . . . . . . . . . . . . . . . . . . . . . . . . . $ 266,698,139<br />
Undistributed net investment income (deficit). . . . . . . . . . . . . . . . . . (105,667)<br />
Accumulated net realized gain (loss) on investments<br />
and foreign currency transactions . . . . . . . . . . . . . . . . . . . . . . . (16,318,374)<br />
Net unrealized appreciation in value of investments<br />
and foreign currency transactions . . . . . . . . . . . . . . . . . . . . . . . 113,450,914<br />
Total . . . . . . . . . . . . . . . . . . . . . . . . . . . . . . . . . . . . . . . $ 363,725,012<br />
124<br />
See notes to financial statements
OPPORTUNITY<br />
SPECIAL<br />
SITUATIONS<br />
INTERNATIONAL<br />
$ 511,811,303 $ 379,038,344 $ 167,940,812<br />
$ 827,062,914 $ 470,174,165 $ 225,551,382<br />
5,446,245 2,039,357 1,356,431<br />
7,059,357 3,977,649 275,055<br />
512,174 350,206 1,021,458<br />
858,160 461,849 364,639<br />
74,464 46,875 21,771<br />
841,013,314 477,050,101 228,590,736<br />
5,599,004 11,039,542 —<br />
1,503,156 875,564 429,486<br />
507,030 312,568 188,282<br />
107,158 70,666 42,425<br />
51,122 28,483 65,557<br />
7,767,470 12,326,823 725,750<br />
$ 833,245,844 $ 464,723,278 $ 227,864,986<br />
$ 483,082,917 $ 360,509,181 $ 196,638,584<br />
517,728 131,106 147,498<br />
34,393,588 12,947,170 (26,541,642)<br />
315,251,611 91,135,821 57,620,546<br />
$ 833,245,844 $ 464,723,278 $ 227,864,986<br />
125
Statements of Assets and Liabilities<br />
FIRST INVESTORS EQUITY FUNDS<br />
March 31, 2014<br />
SELECT<br />
GROWTH<br />
Net Assets:<br />
Class A . . . . . . . . . . . . . . . . . . . . . . . . . . . . . . . . . . . . $355,490,246<br />
Class B . . . . . . . . . . . . . . . . . . . . . . . . . . . . . . . . . . . . $5,401,864<br />
Advisor Class . . . . . . . . . . . . . . . . . . . . . . . . . . . . . . . . . $1,258<br />
Institutional Class . . . . . . . . . . . . . . . . . . . . . . . . . . . . . . . $2,831,644<br />
Shares outstanding (Note 8):<br />
Class A . . . . . . . . . . . . . . . . . . . . . . . . . . . . . . . . . . . . 33,399,254<br />
Class B . . . . . . . . . . . . . . . . . . . . . . . . . . . . . . . . . . . . 564,798<br />
Advisor Class . . . . . . . . . . . . . . . . . . . . . . . . . . . . . . . . . 118<br />
Institutional Class . . . . . . . . . . . . . . . . . . . . . . . . . . . . . . . 264,539<br />
Net asset value and redemption price per share – Class A . . . . . . . . . $ 10.64<br />
Maximum offering price per share – Class A<br />
(Net asset value/.9425)*. . . . . . . . . . . . . . . . . . . . . . . . . . . . $ 11.29<br />
Net asset value and offering price per share – Class B** . . . . . . . . . . $ 9.56<br />
Net asset value, offering price and redemption price<br />
per share – Advisor Class . . . . . . . . . . . . . . . . . . . . . . . . . .<br />
Net asset value, offering price and redemption price<br />
per share – Institutional Class. . . . . . . . . . . . . . . . . . . . . . . .<br />
$ 10.66<br />
$ 10.70<br />
* On purchases of $100,000 or more, the sales charge is reduced.<br />
** Redemption price is equal to net asset value less contingent deferred sales charges, if applicable.<br />
126 See notes to financial statements
OPPORTUNITY<br />
SPECIAL<br />
SITUATIONS<br />
INTERNATIONAL<br />
$ 816,407,376 $ 453,870,937 $ 222,333,295<br />
$13,352,176 $5,000,255 $3,240,757<br />
$7,532 $1,224 $1,033<br />
$3,478,760 $5,850,862 $2,289,901<br />
20,491,523 17,058,514 16,827,953<br />
400,426 234,169 257,245<br />
188 46 78<br />
86,964 218,768 172,072<br />
$ 39.84 $ 26.61 $ 13.21<br />
$ 42.27 $ 28.23 $ 14.02<br />
$ 33.34 $ 21.35 $ 12.60<br />
$ 40.06 $ 26.61 $ 13.25<br />
$ 40.00 $ 26.74 $ 13.31<br />
127
Statements of Operations<br />
FIRST INVESTORS INCOME FUNDS<br />
Six Months Ended March 31, 2014<br />
CASH<br />
MANAGEMENT<br />
Investment Income<br />
Interest. . . . . . . . . . . . . . . . . . . . . . . . . . . . . . . . . . . . . $ 54,771<br />
Dividends from affiliate (Note 2) . . . . . . . . . . . . . . . . . . . . . . . —<br />
Total income. . . . . . . . . . . . . . . . . . . . . . . . . . . . . . . . . . 54,771<br />
Expenses (Notes 1 and 3):<br />
Advisory fees . . . . . . . . . . . . . . . . . . . . . . . . . . . . . . . . . 337,100<br />
Distribution plan expenses – Class A . . . . . . . . . . . . . . . . . . . . .<br />
N/A<br />
Distribution plan expenses – Class B . . . . . . . . . . . . . . . . . . . . . 2,366<br />
Shareholder servicing costs – Class A . . . . . . . . . . . . . . . . . . . . 235,049<br />
Shareholder servicing costs – Class B . . . . . . . . . . . . . . . . . . . . 889<br />
Shareholder servicing costs – Advisor Class . . . . . . . . . . . . . . . . .<br />
N/A<br />
Shareholder servicing costs – Institutional Class . . . . . . . . . . . . . . . 403<br />
Professional fees. . . . . . . . . . . . . . . . . . . . . . . . . . . . . . . . 18,545<br />
Custodian fees . . . . . . . . . . . . . . . . . . . . . . . . . . . . . . . . . 12,207<br />
Registration fees . . . . . . . . . . . . . . . . . . . . . . . . . . . . . . . 36,176<br />
Reports to shareholders . . . . . . . . . . . . . . . . . . . . . . . . . . . . 6,626<br />
Trustees’ fees . . . . . . . . . . . . . . . . . . . . . . . . . . . . . . . . . 3,196<br />
Other expenses . . . . . . . . . . . . . . . . . . . . . . . . . . . . . . . . 12,337<br />
Total expenses . . . . . . . . . . . . . . . . . . . . . . . . . . . . . . . . . . 664,894<br />
Less: Expenses (waived) repaid to advisor (Note 3). . . . . . . . . . . . . . . (610,123)<br />
Net expenses . . . . . . . . . . . . . . . . . . . . . . . . . . . . . . . . . . . 54,771<br />
Net investment income. . . . . . . . . . . . . . . . . . . . . . . . . . . . . . —<br />
Realized and Unrealized Gain (Loss) on Investments and Affiliate (Note 2):<br />
Net realized gain (loss) on investments . . . . . . . . . . . . . . . . . . . . . —<br />
Capital gain distributions from affiliate . . . . . . . . . . . . . . . . . . . . . —<br />
Net realized gain (loss) on investments and affiliate . . . . . . . . . . . . . . —<br />
Net unrealized gain (loss) on investments . . . . . . . . . . . . . . . . . . . . —<br />
Net gain (loss) on investments and affiliate . . . . . . . . . . . . . . . . . . . . —<br />
Net Increase in Net Assets Resulting<br />
from Operations. . . . . . . . . . . . . . . . . . . . . . . . . . . . . . . . . . . $ —<br />
128<br />
See notes to financial statements
GOVERNMENT<br />
INVESTMENT<br />
GRADE<br />
STRATEGIC<br />
INCOME<br />
$ 5,146,838 $ 11,858,791 $ 2<br />
— — 1,254,781<br />
5,146,838 11,858,791 1,254,783<br />
1,189,144 1,836,051 15,538<br />
525,241 805,807 92,989<br />
21,201 28,725 N/A<br />
256,344 372,160 37,962<br />
5,696 9,194 N/A<br />
15 15 48<br />
565 1,226 N/A<br />
31,317 42,948 62,264<br />
17,570 19,220 3,105<br />
37,495 39,997 30,000<br />
6,584 9,506 4,405<br />
8,700 13,302 1,423<br />
47,769 49,338 10,171<br />
2,147,641 3,227,489 257,905<br />
(216,464) (301,057) 95,428<br />
1,931,177 2,926,432 353,333<br />
3,215,661 8,932,359 901,450<br />
(1,140,157) 3,356,786 44,972<br />
— — 100,350<br />
(1,140,157) 3,356,786 145,322<br />
(478,101) 5,500,409 1,240,005<br />
(1,618,258) 8,857,195 1,385,327<br />
$ 1,597,403 $ 17,789,554 $ 2,286,777<br />
129
Statements of Operations<br />
FIRST INVESTORS INCOME FUNDS<br />
Six Months Ended March 31, 2014<br />
INTERNATIONAL<br />
OPPORTUNITIES<br />
BOND<br />
Investment Income<br />
Interest. . . . . . . . . . . . . . . . . . . . . . . . . . . . . . . . . . . . . $ 1,606,725 (a)<br />
Expenses (Notes 1 and 3):<br />
Advisory fees . . . . . . . . . . . . . . . . . . . . . . . . . . . . . . . . . 382,749<br />
Distribution plan expenses – Class A . . . . . . . . . . . . . . . . . . . . . 140,515<br />
Distribution plan expenses – Class B . . . . . . . . . . . . . . . . . . . . .<br />
N/A<br />
Shareholder servicing costs – Class A . . . . . . . . . . . . . . . . . . . . 84,550<br />
Shareholder servicing costs – Class B . . . . . . . . . . . . . . . . . . . .<br />
N/A<br />
Shareholder servicing costs – Advisor Class . . . . . . . . . . . . . . . . . 14<br />
Shareholder servicing costs – Institutional Class . . . . . . . . . . . . . . . 514<br />
Professional fees. . . . . . . . . . . . . . . . . . . . . . . . . . . . . . . . 2,622<br />
Custodian fees . . . . . . . . . . . . . . . . . . . . . . . . . . . . . . . . . 29,565<br />
Registration fees . . . . . . . . . . . . . . . . . . . . . . . . . . . . . . . 32,497<br />
Reports to shareholders . . . . . . . . . . . . . . . . . . . . . . . . . . . . 4,560<br />
Trustees’ fees . . . . . . . . . . . . . . . . . . . . . . . . . . . . . . . . . 2,298<br />
Other expenses . . . . . . . . . . . . . . . . . . . . . . . . . . . . . . . . 26,306<br />
Total expenses . . . . . . . . . . . . . . . . . . . . . . . . . . . . . . . . . . 706,190<br />
Less: Expenses waived. . . . . . . . . . . . . . . . . . . . . . . . . . . . . . (57,342)<br />
Net expenses . . . . . . . . . . . . . . . . . . . . . . . . . . . . . . . . . . . 648,848<br />
Net investment income. . . . . . . . . . . . . . . . . . . . . . . . . . . . . . 957,877<br />
Realized and Unrealized Gain (Loss) on Investments and Foreign<br />
Currency Transactions (Notes 2 and 7):<br />
Net realized gain (loss) on:<br />
Investments . . . . . . . . . . . . . . . . . . . . . . . . . . . . . . . . . . (298,987)<br />
Foreign currency transactions . . . . . . . . . . . . . . . . . . . . . . . . . (1,083,917)<br />
Net realized gain (loss) on investments and foreign currency transactions . . . (1,382,904)<br />
Net unrealized gain on:<br />
Investments . . . . . . . . . . . . . . . . . . . . . . . . . . . . . . . . . . 3,087,371<br />
Foreign currency transactions . . . . . . . . . . . . . . . . . . . . . . . . . 202,858<br />
Net unrealized gain on investments and<br />
foreign currency transactions . . . . . . . . . . . . . . . . . . . . . . . . . 3,290,229<br />
Net gain on investments and<br />
foreign currency transactions . . . . . . . . . . . . . . . . . . . . . . . . . . 1,907,325<br />
Net Increase in Net Assets Resulting<br />
from Operations. . . . . . . . . . . . . . . . . . . . . . . . . . . . . . . . . . . $ 2,865,202<br />
* From October 21, 2013 (commencement of operations) to March 31, 2014.<br />
(a) Net of $16,272 foreign taxes withheld.<br />
130<br />
See notes to financial statements
FLOATING<br />
RATE*<br />
FUND FOR<br />
INCOME<br />
$ 703,351 $ 20,579,204<br />
136,881 2,493,888<br />
65,198 986,397<br />
N/A 25,443<br />
38,340 493,378<br />
N/A 6,938<br />
14 14<br />
329 2,324<br />
138,478 49,104<br />
6,780 21,361<br />
24,997 37,003<br />
3,094 13,411<br />
915 16,165<br />
22,270 73,743<br />
437,296 4,219,169<br />
(191,233) (77,680)<br />
246,063 4,141,489<br />
457,288 16,437,715<br />
100 1,810,183<br />
— —<br />
100 1,810,183<br />
152,796 20,426,507<br />
— —<br />
152,796 20,426,507<br />
152,896 22,236,690<br />
$ 610,184 $ 38,674,405<br />
131
Statements of Operations<br />
FIRST INVESTORS EQUITY FUNDS<br />
Six Months Ended March 31, 2014<br />
TOTAL<br />
RETURN<br />
Investment Income<br />
Dividends . . . . . . . . . . . . . . . . . . . . . . . . . . . . . . . . . . . $ 4,262,427(a)<br />
Interest. . . . . . . . . . . . . . . . . . . . . . . . . . . . . . . . . . . . . 4,325,416<br />
Total income . . . . . . . . . . . . . . . . . . . . . . . . . . . . . . . . . . . 8,587,843<br />
Expenses (Notes 1 and 3):<br />
Advisory fees . . . . . . . . . . . . . . . . . . . . . . . . . . . . . . . . . 2,514,549<br />
Distribution plan expenses – Class A . . . . . . . . . . . . . . . . . . . . . 1,048,880<br />
Distribution plan expenses – Class B . . . . . . . . . . . . . . . . . . . . . 51,362<br />
Shareholder servicing costs – Class A . . . . . . . . . . . . . . . . . . . . 496,824<br />
Shareholder servicing costs – Class B . . . . . . . . . . . . . . . . . . . . 11,935<br />
Shareholder servicing costs – Advisor Class . . . . . . . . . . . . . . . . . 12<br />
Shareholder servicing costs – Institutional Class . . . . . . . . . . . . . . . 508<br />
Professional fees. . . . . . . . . . . . . . . . . . . . . . . . . . . . . . . . 41,140<br />
Custodian fees . . . . . . . . . . . . . . . . . . . . . . . . . . . . . . . . 14,685<br />
Registration fees. . . . . . . . . . . . . . . . . . . . . . . . . . . . . . . . 41,998<br />
Reports to shareholders . . . . . . . . . . . . . . . . . . . . . . . . . . . . 16,151<br />
Trustees’ fees . . . . . . . . . . . . . . . . . . . . . . . . . . . . . . . . . 17,194<br />
Other expenses . . . . . . . . . . . . . . . . . . . . . . . . . . . . . . . . 57,472<br />
Total expenses . . . . . . . . . . . . . . . . . . . . . . . . . . . . . . . . . . 4,312,710<br />
Less: Expenses waived . . . . . . . . . . . . . . . . . . . . . . . . . . . . . (9)<br />
Expenses paid indirectly. . . . . . . . . . . . . . . . . . . . . . . . . . (2,467)<br />
Net expenses . . . . . . . . . . . . . . . . . . . . . . . . . . . . . . . . . . . 4,310,234<br />
Net investment income (loss) . . . . . . . . . . . . . . . . . . . . . . . . . . 4,277,609<br />
Realized and Unrealized Gain (Loss) on Investments<br />
and Foreign Currency Transactions (Note 2):<br />
Net realized gain (loss) on:<br />
Investments . . . . . . . . . . . . . . . . . . . . . . . . . . . . . . . . . . 14,293,155<br />
Foreign currency transactions . . . . . . . . . . . . . . . . . . . . . . . . . —<br />
Net realized gain on investments and<br />
foreign currency transactions . . . . . . . . . . . . . . . . . . . . . . . . . 14,293,155<br />
Net unrealized appreciation (depreciation) of investments and<br />
foreign currency transactions . . . . . . . . . . . . . . . . . . . . . . . . . 29,675,855<br />
Net gain on investments and foreign currency transactions . . . . . . . . . . . . 43,969,010<br />
Net Increase in Net Assets Resulting from Operations . . . . . . . . . . . . . $ 48,246,619<br />
(a) Net of $1,746 foreign taxes withheld<br />
(b) Net of $14,506 foreign taxes withheld<br />
(c) Net of $7,419 foreign taxes withheld<br />
(d) Net of $13,753 foreign taxes withheld<br />
132<br />
See notes to financial statements
EQUITY<br />
INCOME<br />
GROWTH &<br />
INCOME<br />
GLOBAL<br />
$ 6,717,475(b) $ 16,721,037(c) $ 2,508,579(d)<br />
9,011 6,334 939<br />
6,726,486 16,727,371 2,509,518<br />
1,913,957 5,728,998 1,632,000<br />
758,425 2,463,689 504,231<br />
31,972 139,037 22,213<br />
351,053 1,106,089 324,760<br />
9,455 33,031 7,122<br />
13 13 12<br />
826 1,328 444<br />
34,023 90,260 23,675<br />
9,187 25,469 85,090<br />
37,960 43,996 35,000<br />
9,652 36,057 9,225<br />
12,407 40,486 8,119<br />
32,342 85,958 39,797<br />
3,201,272 9,794,411 2,691,688<br />
(9) (9) (85,440)<br />
(1,800) (5,789) —<br />
3,199,463 9,788,613 2,606,248<br />
3,527,023 6,938,758 (96,730)<br />
15,069,441 34,127,477 67,713,761<br />
— — (19,168)<br />
15,069,441 34,127,477 67,694,593<br />
31,106,907 126,524,621 (46,669,027)<br />
46,176,348 160,652,098 21,025,566<br />
$ 49,703,371 $ 167,590,856 $ 20,928,836<br />
133
Statements of Operations<br />
FIRST INVESTORS EQUITY FUNDS<br />
Six Months Ended March 31, 2014<br />
SELECT<br />
GROWTH<br />
Investment Income<br />
Dividends . . . . . . . . . . . . . . . . . . . . . . . . . . . . . . . . . . $ 2,250,158<br />
Interest. . . . . . . . . . . . . . . . . . . . . . . . . . . . . . . . . . . . 424<br />
Total income . . . . . . . . . . . . . . . . . . . . . . . . . . . . . . . . . . 2,250,582<br />
Expenses (Notes 1 and 3):<br />
Advisory fees . . . . . . . . . . . . . . . . . . . . . . . . . . . . . . . . 1,310,865<br />
Distribution plan expenses – Class A . . . . . . . . . . . . . . . . . . . . 515,239<br />
Distribution plan expenses – Class B . . . . . . . . . . . . . . . . . . . . 27,574<br />
Shareholder servicing costs – Class A . . . . . . . . . . . . . . . . . . . 300,561<br />
Shareholder servicing costs – Class B . . . . . . . . . . . . . . . . . . . 7,345<br />
Shareholder servicing costs – Advisor Class . . . . . . . . . . . . . . . . 12<br />
Shareholder servicing costs – Institutional Class . . . . . . . . . . . . . . 427<br />
Professional fees. . . . . . . . . . . . . . . . . . . . . . . . . . . . . . . 23,337<br />
Custodian fees . . . . . . . . . . . . . . . . . . . . . . . . . . . . . . . 5,139<br />
Registration fees. . . . . . . . . . . . . . . . . . . . . . . . . . . . . . . 36,002<br />
Reports to shareholders . . . . . . . . . . . . . . . . . . . . . . . . . . . 8,382<br />
Trustees’ fees . . . . . . . . . . . . . . . . . . . . . . . . . . . . . . . . 8,421<br />
Other expenses . . . . . . . . . . . . . . . . . . . . . . . . . . . . . . . 22,852<br />
Total expenses 2,266,156<br />
Less: Expenses waived . . . . . . . . . . . . . . . . . . . . . . . . . . . . (8)<br />
Expenses paid indirectly. . . . . . . . . . . . . . . . . . . . . . . . . —<br />
Net expenses . . . . . . . . . . . . . . . . . . . . . . . . . . . . . . . . . . 2,266,148<br />
Net investment income (loss) . . . . . . . . . . . . . . . . . . . . . . . . . (15,566)<br />
Realized and Unrealized Gain (Loss) on Investments<br />
and Foreign Currency Transactions (Note 2):<br />
Net realized gain on:<br />
Investments . . . . . . . . . . . . . . . . . . . . . . . . . . . . . . . . . 14,927,339<br />
Foreign currency transactions . . . . . . . . . . . . . . . . . . . . . . . . —<br />
Net realized gain on investments<br />
and foreign currency transactions . . . . . . . . . . . . . . . . . . . . . . 14,927,339<br />
Net unrealized appreciation of investments and<br />
foreign currency transactions . . . . . . . . . . . . . . . . . . . . . . . . 33,807,521<br />
Net gain on investments and foreign currency transactions . . . . . . . . . . . 48,734,860<br />
Net Increase in Net Assets Resulting from Operations . . . . . . . . . . . . $ 48,719,294<br />
(e) Net of $15,986 foreign taxes withheld<br />
(f) Net of $219,177 foreign taxes withheld<br />
134 See notes to financial statements
OPPORTUNITY<br />
SPECIAL<br />
SITUATIONS<br />
INTERNATIONAL<br />
$ 5,413,010(e) $ 3,105,591 $ 2,173,934 (f)<br />
5,819 3,739 961<br />
5,418,829 3,109,330 2,174,895<br />
2,873,448 1,904,019 1,121,065<br />
1,175,587 646,381 335,288<br />
67,916 24,805 15,749<br />
589,318 389,505 236,385<br />
16,366 8,121 5,807<br />
13 13 13<br />
511 859 345<br />
42,767 41,402 25,801<br />
14,458 11,952 78,745<br />
38,958 36,248 35,994<br />
18,292 11,311 7,445<br />
19,257 10,549 5,550<br />
46,948 33,217 30,703<br />
4,903,839 3,118,382 1,898,890<br />
(10) (138,633) (9)<br />
(2,728) (1,525) —<br />
4,901,101 2,978,224 1,898,881<br />
517,728 131,106 276,014<br />
35,954,549 13,615,520 533,531<br />
— — 12,972<br />
35,954,549 13,615,520 546,503<br />
47,154,456 34,030,376 11,852,350<br />
83,109,005 47,645,896 12,398,853<br />
$ 83,626,733 $ 47,777,002 $ 12,674,867<br />
135
Statements of Changes in Net Assets<br />
FIRST INVESTORS INCOME FUNDS<br />
CASH MANAGEMENT<br />
10/1/2013 to<br />
3/31/2014<br />
10/1/2012 to<br />
9/30/2013<br />
Increase (Decrease) in Net Assets From Operations<br />
Net investment income . . . . . . . . . . . . . . . . . . . . $ — $ —<br />
Net realized gain (loss) on investments . . . . . . . . . . . . . — —<br />
Capital gain distributions from affiliate . . . . . . . . . . . . .<br />
Net unrealized appreciation (depreciation) of investments . .<br />
—<br />
—<br />
—<br />
—<br />
Net increase (decrease) in net assets resulting<br />
from operations . . . . . . . . . . . . . . . . . . . . . — —<br />
Distributions to Shareholders<br />
Net investment income – Class A . . . . . . . . . . . . . . . — —<br />
Net investment income – Class B . . . . . . . . . . . . . . . — —<br />
Net investment income – Advisor Class . . . . . . . . . . . N/A N/A<br />
Net investment income – Institutional Class . . . . . . . . . — —<br />
Net realized gains – Class A . . . . . . . . . . . . . . . . . — —<br />
Net realized gains – Class B . . . . . . . . . . . . . . . . . — —<br />
Net realized gains – Advisor Class . . . . . . . . . . . . . . N/A N/A<br />
Net realized gains – Institutional Class . . . . . . . . . . . . — —<br />
Total distributions. . . . . . . . . . . . . . . . . . . . . . — —<br />
Share Transactions<br />
Class A:<br />
Proceeds from shares sold . . . . . . . . . . . . . . . . . 111,089,698 170,296,304<br />
Reinvestment of distributions. . . . . . . . . . . . . . . . — —<br />
Cost of shares redeemed . . . . . . . . . . . . . . . . . . (103,642,435) (175,051,743)<br />
7,447,263 (4,755,439)<br />
Class B:<br />
Proceeds from shares sold . . . . . . . . . . . . . . . . . 485,397 593,663<br />
Reinvestment of dividends . . . . . . . . . . . . . . . . . — —<br />
Cost of shares redeemed . . . . . . . . . . . . . . . . . . (354,891) (918,318)<br />
130,506 (324,655)<br />
Advisor Class:<br />
Proceeds from shares sold . . . . . . . . . . . . . . . . . N/A N/A<br />
Reinvestment of distributions. . . . . . . . . . . . . . . . N/A N/A<br />
Cost of shares redeemed . . . . . . . . . . . . . . . . . . N/A N/A<br />
N/A<br />
N/A<br />
Institutional Class:<br />
Proceeds from shares sold . . . . . . . . . . . . . . . . . 3,255,276 1,000<br />
Reinvestment of dividends . . . . . . . . . . . . . . . . .<br />
Cost of shares redeemed . . . . . . . . . . . . . . . . . .<br />
—<br />
(708,013)<br />
—<br />
—<br />
2,547,263 1,000<br />
Net increase (decrease) from share transactions . . . . . . 10,125,032 (5,079,094)<br />
Net increase (decrease) in net assets . . . . . . . . . . . . 10,125,032 (5,079,094)<br />
Net Assets<br />
Beginning of period . . . . . . . . . . . . . . . . . . . . . . 130,844,219 135,923,313<br />
End of period†. . . . . . . . . . . . . . . . . . . . . . . . . $ 140,969,251 $ 130,844,219<br />
†Includes undistributed net investment income (deficit) of. . . . $ — $ —<br />
* From April 3, 2013 (commencement of operations) to September 30, 2013.<br />
136<br />
See notes to financial statements
10/1/2013 to<br />
3/31/2014<br />
GOVERNMENT INVESTMENT GRADE STRATEGIC INCOME<br />
10/1/2012 to<br />
9/30/2013<br />
10/1/2013 to<br />
3/31/2014<br />
10/1/2012 to<br />
9/30/2013<br />
10/1/2013 to<br />
3/31/2014<br />
4/3/2013 to<br />
9/30/2013*<br />
$ 3,215,661 $ 5,897,172 $ 8,932,359 $ 17,781,707 $ 901,450 $ 344,830<br />
(1,140,157) (2,524,401) 3,356,786 6,707,102 44,972 20,787<br />
—<br />
(478,101)<br />
—<br />
(12,376,919)<br />
—<br />
5,500,409<br />
—<br />
(30,887,049)<br />
100,350<br />
1,240,005<br />
—<br />
(600,069)<br />
1,597,403 (9,004,148) 17,789,554 (6,398,240) 2,286,777 (234,452)<br />
(4,248,245) (10,605,675) (10,675,429) (20,739,540) (845,457) (321,799)<br />
(36,313) (119,679) (95,830) (222,878) N/A N/A<br />
(15) (13) (23) (19) (2,457) (15)<br />
(80,357) (29,051) (329,952) (110,770) N/A N/A<br />
— — — — (22,344) —<br />
— — — — N/A N/A<br />
— — — — (63) —<br />
— — — — N/A N/A<br />
(4,364,930) (10,754,418) (11,101,234) (21,073,207) (870,321) (321,814)<br />
32,121,939 71,815,747 49,394,388 133,038,106 30,721,233 48,792,921<br />
4,001,665 9,909,442 9,974,553 19,197,738 830,937 309,020<br />
(40,154,553) (89,063,124) (66,768,757) (113,252,520) (4,218,688) (1,201,230)<br />
(4,030,949) (7,337,935) (7,399,816) 38,983,324 27,333,482 47,900,711<br />
121,198 451,982 279,822 746,634 N/A N/A<br />
34,152 113,260 91,580 213,612 N/A N/A<br />
(1,009,607) (1,952,936) (1,128,145) (2,498,053) N/A N/A<br />
(854,257) (1,387,694) (756,743) (1,537,807) N/A N/A<br />
4,627 1,000 4,926 1,000 254,582 1,000<br />
13 14 23 19 2,520 15<br />
(4,362) — (4,931) — (20,253) —<br />
278 1,014 18 1,019 236,849 1,015<br />
6,442,102 4,663,814 10,589,305 11,445,833 N/A N/A<br />
8,681<br />
(3,056,840)<br />
20<br />
—<br />
34,931<br />
(3,400,549)<br />
20<br />
(1,909,933)<br />
N/A<br />
N/A<br />
N/A<br />
N/A<br />
3,393,943 4,663,834 7,223,687 9,535,920 N/A N/A<br />
(1,490,985) (4,060,781) (932,854) 46,982,456 27,570,331 47,901,726<br />
(4,258,512) (23,819,347) 5,755,466 19,511,009 28,986,787 47,345,460<br />
364,637,755 388,457,102 559,442,788 539,931,779 47,345,460 —<br />
$ 360,379,243 $ 364,637,755 $ 565,198,254 $ 559,442,788 $ 76,332,247 $ 47,345,460<br />
$ (1,093,971) $ 55,298 $ (8,560,347) $ (6,419,736) $ 76,552 $ 23,016<br />
137
Statements of Changes in Net Assets<br />
FIRST INVESTORS INCOME FUNDS<br />
CASH MANAGEMENT<br />
10/1/2013 to<br />
3/31/2014<br />
10/1/2012 to<br />
9/30/2013<br />
Shares Issued and Redeemed<br />
Class A:<br />
Sold . . . . . . . . . . . . . . . . . . . . . . . . . . . . . 111,089,698 170,296,304<br />
Issued for distributions reinvested . . . . . . . . . . . . .<br />
Redeemed. . . . . . . . . . . . . . . . . . . . . . . . . .<br />
—<br />
(103,642,435)<br />
—<br />
(175,051,743)<br />
Net increase (decrease) in Class A shares outstanding. . . 7,447,263 (4,755,439)<br />
Class B:<br />
Sold . . . . . . . . . . . . . . . . . . . . . . . . . . . . . 485,397 593,663<br />
Issued for dividends reinvested. . . . . . . . . . . . . . . — —<br />
Redeemed. . . . . . . . . . . . . . . . . . . . . . . . . . (354,891) (918,318)<br />
Net increase (decrease) in Class B shares outstanding . . . 130,506 (324,655)<br />
Advisor Class:<br />
Sold . . . . . . . . . . . . . . . . . . . . . . . . . . . . . N/A N/A<br />
Issued for distributions reinvested . . . . . . . . . . . . . N/A N/A<br />
Redeemed. . . . . . . . . . . . . . . . . . . . . . . . . . N/A N/A<br />
Net increase in Advisor Class shares outstanding . . . . . N/A N/A<br />
Institutional Class:<br />
Sold . . . . . . . . . . . . . . . . . . . . . . . . . . . . . 3,255,276 1,000<br />
Issued for dividends reinvested. . . . . . . . . . . . . . . — —<br />
Redeemed. . . . . . . . . . . . . . . . . . . . . . . . . . (708,013) —<br />
Net increase in Institutional Class shares outstanding . . . 2,547,263 1,000<br />
*From April 3, 2013 (commencement of operations) to September 30, 2013.<br />
138<br />
See notes to financial statements
10/1/2013 to<br />
3/31/2014<br />
GOVERNMENT INVESTMENT GRADE STRATEGIC INCOME<br />
10/1/2012 to<br />
9/30/2013<br />
10/1/2013 to<br />
3/31/2014<br />
10/1/2012 to<br />
9/30/2013<br />
10/1/2013 to<br />
3/31/2014<br />
4/3/2013 to<br />
9/30/2013*<br />
2,942,651 6,400,413 5,011,811 13,140,993 3,097,824 4,931,628<br />
366,796<br />
(3,678,670)<br />
885,161<br />
(7,966,458)<br />
1,009,901<br />
(6,775,327)<br />
1,903,029<br />
(11,224,653)<br />
83,507<br />
(425,352)<br />
31,663<br />
(122,993)<br />
(369,223) (680,884) (753,615) 3,819,369 2,755,979 4,840,298<br />
11,149 40,139 28,476 73,648 N/A N/A<br />
3,138 10,117 9,301 21,171 N/A N/A<br />
(92,758) (173,828) (114,895) (246,564) N/A N/A<br />
(78,471) (123,572) (77,118) (151,745) N/A N/A<br />
426 89 499 98 25,809 100<br />
1 1 2 2 253 2<br />
(402) — (499) — (2,041) —<br />
25 90 2 100 24,021 102<br />
588,837 424,709 1,076,198 1,148,312 N/A N/A<br />
794 2 3,531 2 N/A N/A<br />
(279,895) — (344,189) (196,092) N/A N/A<br />
309,736 424,711 735,540 952,222 N/A N/A<br />
139
Statements of Changes in Net Assets<br />
FIRST INVESTORS INCOME FUNDS<br />
INTERNATIONAL<br />
OPPORTUNITIES BOND<br />
10/1/2013 to<br />
3/31/2014<br />
10/1/2012 to<br />
9/30/2013<br />
Increase (Decrease) in Net Assets From Operations<br />
Net investment income . . . . . . . . . . . . . . . . . . . . $ 957,877 $ 443,170<br />
Net realized gain (loss) on investments and<br />
foreign currency transactions. . . . . . . . . . . . . . . .<br />
Net unrealized appreciation (depreciation) of investments and<br />
(1,382,904) 1,307,814<br />
foreign currency transactions. . . . . . . . . . . . . . . . . 3,290,229 (3,503,871)<br />
Net increase (decrease) in net assets resulting<br />
from operations . . . . . . . . . . . . . . . . . . . . . 2,865,202 (1,752,887)<br />
Distributions to Shareholders<br />
Net investment income – Class A . . . . . . . . . . . . . . . (1,270,132) (2,062,847)<br />
Net investment income – Class B . . . . . . . . . . . . . . . N/A N/A<br />
Net investment income – Advisor Class . . . . . . . . . . . (14) (15)<br />
Net investment income – Institutional Class . . . . . . . . . (118,398) (59,034)<br />
Net realized gains – Class A . . . . . . . . . . . . . . . . . — (64,140)<br />
Net realized gains – Class B . . . . . . . . . . . . . . . . . N/A N/A<br />
Net realized gains – Advisor Class . . . . . . . . . . . . . . — —<br />
Net realized gains – Institutional Class . . . . . . . . . . . . — —<br />
Total distributions. . . . . . . . . . . . . . . . . . . . . . (1,388,544) (2,186,036)<br />
Share Transactions<br />
Class A:<br />
Proceeds from shares sold . . . . . . . . . . . . . . . . . 13,680,260 88,008,741<br />
Reinvestment of distributions. . . . . . . . . . . . . . . . 1,230,629 2,062,264<br />
Cost of shares redeemed . . . . . . . . . . . . . . . . . . (17,015,584) (6,702,089)<br />
(2,104,695) 83,368,916<br />
Class B:<br />
Proceeds from shares sold . . . . . . . . . . . . . . . . . N/A N/A<br />
Reinvestment of dividends . . . . . . . . . . . . . . . . . N/A N/A<br />
Cost of shares redeemed . . . . . . . . . . . . . . . . . . N/A N/A<br />
N/A<br />
N/A<br />
Advisor Class:<br />
Proceeds from shares sold . . . . . . . . . . . . . . . . . 1,669 1,000<br />
Reinvestment of dividends . . . . . . . . . . . . . . . . . 13 15<br />
Cost of shares redeemed . . . . . . . . . . . . . . . . . . (1,679) —<br />
3 1,015<br />
Institutional Class:<br />
Proceeds from shares sold . . . . . . . . . . . . . . . . . 4,371,714 9,541,985<br />
Reinvestment of dividends . . . . . . . . . . . . . . . . . 6,695 15<br />
Cost of shares redeemed . . . . . . . . . . . . . . . . . . (3,399,083) (2,376,040)<br />
979,326 7,165,960<br />
Net increase (decrease) from share transactions . . . . . . (1,125,366) 90,535,891<br />
Net increase in net assets . . . . . . . . . . . . . . . . . . 351,292 86,596,968<br />
Net Assets<br />
Beginning of period . . . . . . . . . . . . . . . . . . . . . . 106,160,462 19,563,494<br />
End of period†. . . . . . . . . . . . . . . . . . . . . . . . . $ 106,511,754 $ 106,160,462<br />
†Includes undistributed net investment income (deficit) of. . . . $ (368,004) $ 62,663<br />
*From October 21, 2013 (commencement of operations) to March 31, 2014.<br />
140<br />
See notes to financial statements
FLOATING<br />
RATE<br />
10/21/2013 to<br />
3/31/2014*<br />
10/1/2013 to<br />
3/31/2014<br />
FUND FOR<br />
INCOME<br />
10/1/2012 to<br />
9/30/2013<br />
$ 457,288 $ 16,437,715 $ 33,007,680<br />
100 1,810,183 17,247,717<br />
152,796 20,426,507 (15,580,379)<br />
610,184 38,674,405 34,675,018<br />
(483,374) (17,337,531) (36,486,900)<br />
N/A (116,978) (268,095)<br />
(12) (31) (29)<br />
(30,917) (757,917) (276,219)<br />
— — —<br />
N/A — —<br />
— — —<br />
— — —<br />
(514,303) (18,212,457) (37,031,243)<br />
66,892,222 47,801,171 109,644,866<br />
473,339 14,917,229 31,001,180<br />
(1,330,839) (55,905,475) (93,323,531)<br />
66,034,722 6,812,925 47,322,515<br />
N/A 630,712 933,907<br />
N/A 93,834 214,951<br />
N/A (841,862) (1,797,374)<br />
N/A (117,316) (648,516)<br />
3,912 2,881 1,000<br />
12 27 29<br />
(2,902) (2,881) —<br />
1,022 27 1,029<br />
4,056,086 14,030,858 18,832,421<br />
1,829 78,077 30<br />
(12,733) (267,478) —<br />
4,045,182 13,841,457 18,832,451<br />
70,080,926 20,537,093 65,507,479<br />
70,176,807 40,999,041 63,151,254<br />
— 671,180,056 608,028,802<br />
$ 70,176,807 $ 712,179,097 $ 671,180,056<br />
$ (57,015) $ (4,642,072) $ (2,865,084)<br />
141
Statements of Changes in Net Assets<br />
FIRST INVESTORS INCOME FUNDS<br />
INTERNATIONAL<br />
OPPORTUNITIES BOND<br />
10/1/2013 to<br />
3/31/2014<br />
10/1/2012 to<br />
9/30/2013<br />
Shares Issued and Redeemed<br />
Class A:<br />
Sold . . . . . . . . . . . . . . . . . . . . . . . . . . . . . 1,402,496 8,628,619<br />
Issued for distributions reinvested . . . . . . . . . . . . . 125,963 205,187<br />
Redeemed. . . . . . . . . . . . . . . . . . . . . . . . . . (1,728,183) (669,057)<br />
Net increase (decrease) in Class A shares outstanding. . . (199,724) 8,164,749<br />
Class B:<br />
Proceeds from shares sold . . . . . . . . . . . . . . . . . N/A N/A<br />
Issued for dividends reinvested. . . . . . . . . . . . . . . N/A N/A<br />
Cost of shares redeemed . . . . . . . . . . . . . . . . . . N/A N/A<br />
Net decrease in Class B shares outstanding . . . . . . . . N/A N/A<br />
Advisor Class:<br />
Proceeds from shares sold . . . . . . . . . . . . . . . . . 169 98<br />
Issued for dividends reinvested. . . . . . . . . . . . . . . 1 1<br />
Cost of shares redeemed . . . . . . . . . . . . . . . . . . (168) —<br />
Net increase in Advisor Class shares outstanding . . . . . 2 99<br />
Institutional Class:<br />
Sold . . . . . . . . . . . . . . . . . . . . . . . . . . . . . 447,163 948,832<br />
Issued for dividends reinvested. . . . . . . . . . . . . . . 684 1<br />
Redeemed. . . . . . . . . . . . . . . . . . . . . . . . . . (352,788) (238,498)<br />
Net increase in Institutional Class shares outstanding . . . 95,059 710,335<br />
*From October 21, 2013 (commencement of operations) to March 31, 2014.<br />
142<br />
See notes to financial statements
FLOATING<br />
RATE<br />
10/21/2013 to<br />
3/31/2014*<br />
10/1/2013 to<br />
3/31/2014<br />
FUND FOR<br />
INCOME<br />
10/1/2012 to<br />
9/30/2013<br />
6,684,143 18,066,540 41,692,426<br />
47,220<br />
(132,777)<br />
5,622,022<br />
(21,159,444)<br />
11,809,665<br />
(35,531,467)<br />
6,598,586 2,529,118 17,970,624<br />
N/A 238,620 354,898<br />
N/A 35,387 81,867<br />
N/A (318,509) (683,943)<br />
N/A (44,502) (247,178)<br />
390 1,079 376<br />
1 10 11<br />
(289) (1,079) —<br />
102 10 387<br />
405,765 5,310,312 7,144,978<br />
182 29,333 11<br />
(1,270) (100,623) —<br />
404,677 5,239,022 7,144,989<br />
143
Statements of Changes in Net Assets<br />
FIRST INVESTORS EQUITY FUNDS<br />
10/1/2013 to<br />
3/31/2014<br />
TOTAL RETURN<br />
10/1/2012 to<br />
9/30/2013<br />
Increase (Decrease) in Net Assets From Operations<br />
Net investment income (loss) . . . . . . . . . . . . . . . . . $ 4,277,609 $ 8,737,825<br />
Net realized gain on investments and<br />
foreign currency transactions. . . . . . . . . . . . . . . . 14,293,155 15,481,867<br />
Net unrealized appreciation (depreciation) of investments and<br />
foreign currency transactions . . . . . . . . . . . . . . . . 29,675,855 54,506,102<br />
Net increase in net assets resulting<br />
from operations . . . . . . . . . . . . . . . . . . . . . 48,246,619 78,725,794<br />
Distributions to Shareholders<br />
Net investment income – Class A . . . . . . . . . . . . . . . (5,978,131) (11,460,204)<br />
Net investment income – Class B . . . . . . . . . . . . . . . (44,940) (129,605)<br />
Net investment income – Advisor Class . . . . . . . . . . . (9) (9)<br />
Net investment income – Institutional Class . . . . . . . . . (25,749) (10)<br />
Net realized gains – Class A . . . . . . . . . . . . . . . . . (15,149,081) (7,978,527)<br />
Net realized gains – Class B . . . . . . . . . . . . . . . . . (229,503) (154,041)<br />
Net realized gains – Advisor Class . . . . . . . . . . . . . . (24) —<br />
Net realized gains – Institutional Class . . . . . . . . . . . . (53,776) —<br />
Total distributions. . . . . . . . . . . . . . . . . . . . . . (21,481,213) (19,722,396)<br />
Share Transactions<br />
Class A:<br />
Proceeds from shares sold . . . . . . . . . . . . . . . . . 70,914,330 151,808,639<br />
Reinvestment of distributions. . . . . . . . . . . . . . . . 20,921,006 19,242,664<br />
Cost of shares redeemed . . . . . . . . . . . . . . . . . . (52,456,199) (96,571,663)<br />
39,379,137 74,479,640<br />
Class B:<br />
Proceeds from shares sold . . . . . . . . . . . . . . . . . 829,658 1,802,068<br />
Reinvestment of distributions. . . . . . . . . . . . . . . . 274,378 283,547<br />
Cost of shares redeemed . . . . . . . . . . . . . . . . . . (1,479,012) (3,729,618)<br />
(374,976) (1,644,003)<br />
Advisor Class:<br />
Proceeds from shares sold . . . . . . . . . . . . . . . . . — 1,000<br />
Reinvestment of distributions. . . . . . . . . . . . . . . . 33 9<br />
Cost of shares redeemed . . . . . . . . . . . . . . . . . . — —<br />
33 1,009<br />
Institutional Class:<br />
Proceeds from shares sold . . . . . . . . . . . . . . . . . 2,843,084 1,000<br />
Reinvestment of distributions. . . . . . . . . . . . . . . . 79,525 10<br />
Cost of shares redeemed . . . . . . . . . . . . . . . . . . (334,860) —<br />
2,587,749 1,010<br />
Net increase (decrease) from share transactions . . . . . . 41,591,943 72,837,656<br />
Net increase in net assets . . . . . . . . . . . . . . . . . . 68,357,349 131,841,054<br />
Net Assets<br />
Beginning of year . . . . . . . . . . . . . . . . . . . . . . . 674,263,252 542,422,198<br />
End of year†. . . . . . . . . . . . . . . . . . . . . . . . . . $ 742,620,601 $ 674,263,252<br />
†Includes undistributed net investment income (deficit) of . . . $ (4,045,653) $ (2,274,431)<br />
144<br />
See notes to financial statements
EQUITY INCOME GROWTH & INCOME GLOBAL<br />
10/1/2013 to<br />
3/31/2014<br />
10/1/2012 to<br />
9/30/2013<br />
10/1/2013 to<br />
3/31/2014<br />
10/1/2012 to<br />
9/30/2013<br />
10/1/2013 to<br />
3/31/2014<br />
10/1/2012 to<br />
9/30/2013<br />
$ 3,527,023 $ 7,276,941 $ 6,938,758 $ 15,233,797 $ (96,730) $ 1,977,912<br />
15,069,441 22,666,688 34,127,477 49,811,355 67,694,593 28,883,970<br />
31,106,907 46,472,134 126,524,621 245,762,325 (46,669,027) 20,625,048<br />
49,703,371 76,415,763 167,590,856 310,807,477 20,928,836 51,486,930<br />
(4,231,626) (7,018,270) (9,928,693) (16,526,451) (1,571,087) (1,424,622)<br />
(20,031) (60,686) — (183,967) — (18,090)<br />
(9) (8) (6) (4) — —<br />
(86,099) (21,919) (75,730) (5) — —<br />
(8,100,460) — (51,578,337) — (4,253,988) —<br />
(105,356) — (937,957) — (67,698) —<br />
(18) — (37) — (15) —<br />
(129,941) — (270,881) — (35,709) —<br />
(12,673,540) (7,100,883) (62,791,641) (16,710,427) (5,928,497) (1,442,712)<br />
47,895,293 80,787,524 137,939,850 225,005,030 70,197,359 26,527,993<br />
12,209,959 6,932,698 61,149,097 16,393,701 5,753,231 1,405,678<br />
(45,756,300) (72,530,693) (138,127,123) (216,966,800) (25,687,294) (43,281,094)<br />
14,348,952 15,189,529 60,961,824 24,431,931 50,263,296 (15,347,423)<br />
356,144 633,835 1,565,940 2,358,307 268,059 326,341<br />
125,387 60,686 936,712 183,800 67,599 18,090<br />
(945,531) (2,314,718) (4,716,205) (7,717,456) (659,423) (1,008,810)<br />
(464,000) (1,620,197) (2,213,553) (5,175,349) (323,765) (664,379)<br />
— 1,000 11,456 1,000 4,023 1,000<br />
28 8 43 4 15 —<br />
— — (11,498) — (4,033) —<br />
28 1,008 1 1,004 5 1,000<br />
4,893,216 4,650,735 8,832,131 1,000 2,836,152 1,000<br />
48,242 6 346,613 5 35,709 —<br />
(595,833) — (377,979) — (121,839) —<br />
4,345,625 4,650,741 8,800,765 1,005 2,750,022 1,000<br />
18,230,605 18,221,081 67,549,037 19,258,591 52,689,558 (16,009,802)<br />
55,260,436 87,535,961 172,348,252 313,355,641 67,689,897 34,034,416<br />
486,476,722 398,940,761 1,566,345,742 1,252,990,101 321,750,659 287,716,243<br />
$ 541,737,158 $ 486,476,722 $ 1,738,693,994 $ 1,566,345,742 $ 389,440,556 $ 321,750,659<br />
$ 1,857,799 $ 2,668,541 $ 2,499,251 $ 5,564,922 $ (525,229) $ 1,142,588<br />
145
Statements of Changes in Net Assets<br />
FIRST INVESTORS EQUITY FUNDS<br />
10/1/2013 to<br />
3/31/2014<br />
TOTAL RETURN<br />
10/1/2012 to<br />
9/30/2013<br />
Shares Issued and Redeemed<br />
Class A:<br />
Sold . . . . . . . . . . . . . . . . . . . . . . . . . . . . . 3,719,169 8,646,376<br />
Issued for distributions reinvested . . . . . . . . . . . . .<br />
Redeemed. . . . . . . . . . . . . . . . . . . . . . . . . .<br />
1,090,479<br />
(2,757,259)<br />
1,125,446<br />
(5,485,124)<br />
Net increase (decrease) in Class A shares outstanding. . . 2,052,389 4,286,698<br />
Class B:<br />
Sold . . . . . . . . . . . . . . . . . . . . . . . . . . . . . 44,362 104,561<br />
Issued for distributions reinvested . . . . . . . . . . . . . 14,561 17,051<br />
Redeemed. . . . . . . . . . . . . . . . . . . . . . . . . . (79,365) (217,312)<br />
Net decrease in Class B shares outstanding . . . . . . . . (20,442) (95,700)<br />
Advisor Class:<br />
Sold . . . . . . . . . . . . . . . . . . . . . . . . . . . . . — 56<br />
Issued for distributions reinvested . . . . . . . . . . . . . 2 1<br />
Redeemed. . . . . . . . . . . . . . . . . . . . . . . . . . — —<br />
Net increase in Advisor Class shares outstanding . . . . . 2 57<br />
Institutional Class:<br />
Sold . . . . . . . . . . . . . . . . . . . . . . . . . . . . . 152,349 56<br />
Issued for distributions reinvested . . . . . . . . . . . . . 4,145 1<br />
Redeemed. . . . . . . . . . . . . . . . . . . . . . . . . . (17,735) —<br />
Net increase in Institutional Class shares outstanding . . . 138,759 57<br />
146 See notes to financial statements
EQUITY INCOME GROWTH & INCOME GLOBAL<br />
10/1/2013 to<br />
3/31/2014<br />
10/1/2012 to<br />
9/30/2013<br />
10/1/2013 to<br />
3/31/2014<br />
10/1/2012 to<br />
9/30/2013<br />
10/1/2013 to<br />
3/31/2014<br />
10/1/2012 to<br />
9/30/2013<br />
5,075,483 9,628,589 6,408,380 12,146,401 8,278,387 3,616,109<br />
1,270,660<br />
(4,856,780)<br />
834,640<br />
(8,689,334)<br />
2,788,429<br />
(6,431,425)<br />
930,022<br />
(11,774,440)<br />
669,759<br />
(3,074,592)<br />
202,547<br />
(5,920,135)<br />
1,489,363 1,773,895 2,765,384 1,301,983 5,873,554 (2,101,479)<br />
38,387 75,670 77,735 135,778 37,155 51,787<br />
13,277 7,547 45,560 11,774 9,184 3,025<br />
(102,609) (285,676) (235,209) (451,729) (92,442) (159,896)<br />
(50,945) (202,459) (111,914) (304,177) (46,103) (105,084)<br />
— 119 529 54 481 137<br />
3 1 2 — 2 —<br />
— — (529) — (481) —<br />
3 120 2 54 2 137<br />
526,169 523,137 424,454 54 349,544 137<br />
5,009 1 15,812 — 4,128 —<br />
(62,694) — (17,789) — (14,365) —<br />
468,484 523,138 422,477 54 339,307 137<br />
147
Statements of Changes in Net Assets<br />
FIRST INVESTORS EQUITY FUNDS<br />
SELECT GROWTH<br />
10/1/2013 to<br />
3/31/2014<br />
10/1/2012 to<br />
9/30/2013<br />
Increase (Decrease) in Net Assets From Operations<br />
Net investment income (loss) . . . . . . . . . . . . . . . . . $ (15,566) $ 705,574<br />
Net realized gain on investments and<br />
foreign currency transactions. . . . . . . . . . . . . . . . 14,927,339 37,621,367<br />
Net unrealized appreciation (depreciation) of investments<br />
and foreign currency transactions . . . . . . . . . . . . . 33,807,521 5,639,836<br />
Net increase in net assets resulting<br />
from operations . . . . . . . . . . . . . . . . . . . . . 48,719,294 43,966,777<br />
Distributions to Shareholders<br />
Net investment income – Class A . . . . . . . . . . . . . . . (137,030) —<br />
Net investment income – Class B . . . . . . . . . . . . . . . — —<br />
Net investment income – Advisor Class . . . . . . . . . . . — —<br />
Net investment income – Institutional Class . . . . . . . . . — —<br />
Net realized gains – Class A . . . . . . . . . . . . . . . . . — —<br />
Net realized gains – Class B . . . . . . . . . . . . . . . . . — —<br />
Net realized gains – Advisor Class . . . . . . . . . . . . . .<br />
Net realized gains – Institutional Class . . . . . . . . . . . .<br />
—<br />
—<br />
—<br />
—<br />
Total distributions. . . . . . . . . . . . . . . . . . . . . . (137,030) —<br />
Share Transactions<br />
Class A:<br />
Proceeds from shares sold . . . . . . . . . . . . . . . . . 28,252,046 49,260,112<br />
Reinvestment of distributions. . . . . . . . . . . . . . . . 136,183 —<br />
Cost of shares redeemed . . . . . . . . . . . . . . . . . . (36,217,369) (47,680,903)<br />
(7,829,140) 1,579,209<br />
Class B:<br />
Proceeds from shares sold . . . . . . . . . . . . . . . . . 253,319 374,300<br />
Reinvestment of distributions. . . . . . . . . . . . . . . . — —<br />
Cost of shares redeemed . . . . . . . . . . . . . . . . . . (907,544) (1,650,653)<br />
(654,225) (1,276,353)<br />
Advisor Class:<br />
Proceeds from shares sold . . . . . . . . . . . . . . . . . — 1,000<br />
Reinvestment of distributions. . . . . . . . . . . . . . . .<br />
Cost of shares redeemed . . . . . . . . . . . . . . . . . .<br />
—<br />
—<br />
—<br />
—<br />
— 1,000<br />
Institutional Class:<br />
Proceeds from shares sold . . . . . . . . . . . . . . . . . 2,737,962 1,000<br />
Reinvestment of distributions. . . . . . . . . . . . . . . .<br />
Cost of shares redeemed . . . . . . . . . . . . . . . . . .<br />
—<br />
(255,577)<br />
—<br />
—<br />
2,482,385 1,000<br />
Net increase (decrease) from share transactions . . . . . . (6,000,980) 304,856<br />
Net increase in net assets . . . . . . . . . . . . . . . . . . 42,581,284 44,271,633<br />
Net Assets<br />
Beginning of year . . . . . . . . . . . . . . . . . . . . . . . 321,143,728 276,872,095<br />
End of year†. . . . . . . . . . . . . . . . . . . . . . . . . . $ 363,725,012 $ 321,143,728<br />
†Includes undistributed net investment income (deficit) of . . . $ (105,667) $ 46,929<br />
148<br />
See notes to financial statements
10/1/2013 to<br />
3/31/2014<br />
OPPORTUNITY SPECIAL SITUATIONS INTERNATIONAL<br />
10/1/2012 to<br />
9/30/2013<br />
10/1/2013 to<br />
3/31/2014<br />
10/1/2012 to<br />
9/30/2013<br />
10/1/2013 to<br />
3/31/2014<br />
10/1/2012 to<br />
9/30/2013<br />
$ 517,728 $ 3,453,410 $ 131,106 $ 1,557,781 $ 276,014 $ 645,888<br />
35,954,549 49,631,929 13,615,520 78,785,374 546,503 6,541,337<br />
47,154,456 134,682,038 34,030,376 (9,595,192) 11,852,350 5,511,859<br />
83,626,733 187,767,377 47,777,002 70,747,963 12,674,867 12,699,084<br />
(3,087,350) (4,707,638) — (1,635,146) (446,680) —<br />
— (106,969) — (19,139) — —<br />
— — — — — —<br />
(13,000) — — — — —<br />
(46,623,738) (14,500,437) (66,745,164) (14,034,907) — —<br />
(963,735) (394,685) (931,080) (232,335) — —<br />
(73)<br />
(184,762)<br />
—<br />
—<br />
(179)<br />
(841,692)<br />
—<br />
—<br />
—<br />
—<br />
—<br />
—<br />
(50,872,658) (19,709,729) (68,518,115) (15,921,527) (446,680) —<br />
64,864,885 109,567,095 32,116,627 55,016,522 36,114,928 65,131,798<br />
49,375,149 19,127,611 66,412,691 15,590,531 444,022 —<br />
(56,797,392) (96,351,212) (36,718,828) (55,639,919) (42,035,947) (27,541,316)<br />
57,442,642 32,343,494 61,810,490 14,967,134 (5,476,997) 37,590,482<br />
819,458 1,226,999 240,949 350,983 193,245 262,698<br />
960,343 500,972 930,706 251,359 — —<br />
(2,728,482) (4,525,679) (685,763) (1,385,228) (313,485) (604,520)<br />
(948,681) (2,797,708) 485,892 (782,886) (120,240) (341,822)<br />
8,163 1,000 2,063 1,000 2,044 1,000<br />
73<br />
(2,023)<br />
—<br />
—<br />
179<br />
(2,064)<br />
—<br />
—<br />
—<br />
(2,063)<br />
—<br />
—<br />
6,213 1,000 178 1,000 (19) 1,000<br />
3,449,736 1,000 5,758,704 1,000 2,361,833 1,000<br />
197,762<br />
(276,762)<br />
—<br />
—<br />
841,692<br />
(469,038)<br />
—<br />
—<br />
—<br />
(202,809)<br />
—<br />
—<br />
3,370,736 1,000 6,131,358 1,000 2,159,024 1,000<br />
59,870,910 29,547,786 68,427,918 14,186,248 (3,438,232) 37,250,660<br />
92,624,985 197,605,434 47,686,805 69,012,684 8,789,955 49,949,744<br />
740,620,859 543,015,425 417,036,473 348,023,789 219,075,031 169,125,287<br />
$ 833,245,844 $ 740,620,859 $ 464,723,278 $ 417,036,473 $ 227,864,986 $ 219,075,031<br />
$ 517,728 $ 3,100,350 $ 131,106 $ — $ 147,498 $ 318,164<br />
149
Statements of Changes in Net Assets<br />
FIRST INVESTORS EQUITY FUNDS<br />
SELECT GROWTH<br />
10/1/2013 to<br />
3/31/2014<br />
10/1/2012 to<br />
9/30/2013<br />
Shares Issued and Redeemed<br />
Class A:<br />
Sold . . . . . . . . . . . . . . . . . . . . . . . . . . . . . 2,782,882 5,861,743<br />
Issued for distributions reinvested . . . . . . . . . . . . . 13,057 —<br />
Redeemed. . . . . . . . . . . . . . . . . . . . . . . . . . (3,561,724) (5,668,289)<br />
Net increase (decrease) in Class A shares outstanding. . . (765,785) 193,454<br />
Class B:<br />
Proceeds from shares sold . . . . . . . . . . . . . . . . . 27,883 49,006<br />
Issued for distributions reinvested . . . . . . . . . . . . . — —<br />
Cost of shares redeemed . . . . . . . . . . . . . . . . . . (99,819) (219,786)<br />
Net increase (decrease) in Class B shares outstanding . . (71,936) (170,780)<br />
Advisor Class:<br />
Proceeds from shares sold . . . . . . . . . . . . . . . . . — 118<br />
Issued for distributions reinvested . . . . . . . . . . . . . — —<br />
Cost of shares redeemed . . . . . . . . . . . . . . . . . . — —<br />
Net increase in Advisor Class shares outstanding . . . . . — 118<br />
Institutional Class:<br />
Sold . . . . . . . . . . . . . . . . . . . . . . . . . . . . . 289,273 118<br />
Issued for distributions reinvested . . . . . . . . . . . . . — —<br />
Redeemed. . . . . . . . . . . . . . . . . . . . . . . . . . (24,852) —<br />
Net increase in Institutional Class shares outstanding . . . 264,421 118<br />
150 See notes to financial statements
10/1/2013 to<br />
3/31/2014<br />
OPPORTUNITY SPECIAL SITUATIONS INTERNATIONAL<br />
10/1/2012 to<br />
9/30/2013<br />
10/1/2013 to<br />
3/31/2014<br />
10/1/2012 to<br />
9/30/2013<br />
10/1/2013 to<br />
3/31/2014<br />
10/1/2012 to<br />
9/30/2013<br />
1,626,845 3,285,077 1,168,243 2,140,339 2,861,898 5,267,583<br />
1,233,145 645,331 2,538,712 658,662 34,907 —<br />
(1,433,259) (2,908,153) (1,329,165) (2,174,522) (3,297,661) (2,228,081)<br />
1,426,731 1,022,255 2,377,790 624,479 (400,856) 3,039,502<br />
24,481 43,411 10,678 16,135 16,020 22,103<br />
28,599 19,864 44,235 12,644 — —<br />
(76,480) (161,529) (31,097) (64,381) (25,958) (50,706)<br />
(23,400) (98,254) 23,816 (35,602) (9,938) (28,603)<br />
207 30 79 39 156 78<br />
2 — 7 — — —<br />
(51) — (79) — (156) —<br />
158 30 7 39 — 78<br />
88,937 30 203,221 39 187,940 78<br />
4,924 — 32,040 — — —<br />
(6,927) — (16,532) — (15,946) —<br />
86,934 30 218,729 39 171,994 78<br />
151
Notes to Financial Statements<br />
FIRST INVESTORS INCOME FUNDS<br />
FIRST INVESTORS EQUITY FUNDS<br />
March 31, 2014<br />
1. Significant Accounting Policies—<strong>First</strong> <strong>Investors</strong> Income Funds (“Income Funds”)<br />
and <strong>First</strong> <strong>Investors</strong> Equity Funds (“Equity Funds”), each a Delaware statutory trust<br />
(each a “Trust”, collectively, “the Trusts”), are registered under the Investment Company<br />
Act of 1940 (the “1940 Act”) as open-end management investment companies<br />
and operate as series funds. The Income Funds issue shares of beneficial interest in<br />
the Cash Management Fund, Government Fund, Investment Grade Fund, Strategic<br />
Income Fund, International Opportunities Bond Fund, Floating Rate Fund and Fund<br />
For Income. The Equity Funds issue shares of beneficial interest in the Total Return<br />
Fund, Equity Income Fund (formerly Value Fund), Growth & Income Fund, Global<br />
Fund, Select Growth Fund, Opportunity Fund, Special Situations Fund and International<br />
Fund (each a “Fund”, collectively, “the Funds”). The Trusts account separately<br />
for the assets, liabilities and operations of each Fund. The objective of each Fund as<br />
of March 31, 2014, is as follows:<br />
Cash Management Fund seeks to earn a high rate of current income consistent with<br />
the preservation of capital and maintenance of liquidity.<br />
Government Fund seeks to achieve a significant level of current income which is<br />
consistent with security and liquidity of principal.<br />
Investment Grade Fund seeks to generate a maximum level of income consistent<br />
with investment in investment grade debt securities.<br />
Strategic Income Fund seeks a high level of current income.<br />
International Opportunities Bond Fund seeks total return consisting of income<br />
and capital appreciation.<br />
Floating Rate Fund seeks a high level of current income.<br />
Fund For Income seeks high current income.<br />
Total Return Fund seeks high, long-term total investment return consistent with<br />
moderate investment risk.<br />
Equity Income Fund seeks total return.<br />
Growth & Income Fund seeks long-term growth of capital and current income.<br />
Global Fund seeks long-term capital growth.<br />
Select Growth Fund seeks long-term growth of capital.<br />
Opportunity Fund seeks long-term capital growth.<br />
152
Special Situations Fund seeks long-term growth of capital.<br />
International Fund primarily seeks long-term capital growth.<br />
A. Security Valuation—Except as provided below, a security listed or traded on an<br />
exchange or the Nasdaq Stock Market is valued at its last sale price on the exchange<br />
or market where the security is principally traded, and lacking any sales, the security<br />
is valued at the mean between the closing bid and asked prices. Securities traded in<br />
the over-the-counter (“OTC”) market (including securities listed on exchanges whose<br />
primary market is believed to be OTC) are valued at the mean between the last bid<br />
and asked prices based on quotes furnished by a market maker for such securities.<br />
Securities may also be priced by pricing services approved by the Trusts’ Board of<br />
Trustees (the “Board”). The pricing services consider security type, rating, market<br />
condition and yield data as well as market quotations, prices provided by market<br />
makers and other available information in determining value. Short-term debt securities<br />
that mature in 60 days or less are valued at amortized cost. The net asset value<br />
of the Strategic Income Fund is derived from the net asset values of the underlying<br />
Funds in which it invests.<br />
The Funds monitor for significant events occurring prior to the close of trading on<br />
the New York Stock Exchange that could have a material impact on the value of any<br />
securities that are held by the Funds. Examples of such events include trading halts,<br />
natural disasters, political events and issuer-specific developments. If the Valuation<br />
Committee of <strong>First</strong> <strong>Investors</strong> Management Company, Inc. (“FIMCO”) decides that<br />
such events warrant using fair value estimates, it will take such events into consideration<br />
in determining the fair values of such securities. If market quotations or prices<br />
are not readily available or determined to be unreliable, the securities will be valued<br />
at fair value as determined in good faith pursuant to procedures adopted by the<br />
Board. The Funds also use a pricing service to fair value foreign equity securities in<br />
the event that fluctuation in U.S. securities markets exceed a predetermined level or<br />
if a foreign market is closed. For valuation purposes, where applicable, quotations of<br />
foreign securities in foreign currency are translated to U.S. dollar equivalents using<br />
the foreign exchange quotation in effect. As of March 31, 2014, Fund For Income<br />
held four securities that were fair valued by FIMCO’s Valuation Committee with<br />
an aggregate value of $5,053,008, representing .7% of the Fund’s net assets. These<br />
securities were valued based on recent trades of such securities. International Fund<br />
held one security that was fair valued by FIMCO’s Valuation Committee with a value<br />
of $1,237,611, representing .5% of the Fund’s net assets.<br />
The Cash Management Fund values its portfolio securities in accordance with the<br />
amortized cost method of valuation under Rule 2a-7 of the 1940 Act. Amortized<br />
153
Notes to Financial Statements (continued)<br />
FIRST INVESTORS INCOME FUNDS<br />
FIRST INVESTORS EQUITY FUNDS<br />
March 31, 2014<br />
cost is an approximation of market value of an instrument, whereby the difference<br />
between its acquisition cost and market value at maturity is amortized on a straightline<br />
basis over the remaining life of the instrument. The effect of changes in the market<br />
value of a security as a result of fluctuating interest rates is not taken into account<br />
and thus the amortized cost method of valuation may result in the value of a security<br />
being higher or lower than its actual market value.<br />
In accordance with Accounting Standards Codification 820 “Fair Value Measurements<br />
and Disclosures” (“ASC 820”), investments held by the Funds are carried at “fair<br />
value”. As defined by ASC 820, fair value is the price that a fund would receive upon<br />
selling an investment in an orderly transaction to an independent buyer in the principal<br />
or most advantageous market for the investment under current market conditions.<br />
Various inputs are used in determining the value of the fund’s investments.<br />
In addition to defining fair value, ASC 820 established a three-tier hierarchy of inputs<br />
to establish a classification of fair value measurements for disclosure purposes. The<br />
three-tier hierarchy of inputs is summarized in the three broad Levels listed below:<br />
Level 1 — Unadjusted quoted prices in active markets for identical securities that the<br />
Fund has the ability to access.<br />
Level 2 — Observable inputs other than quoted prices included in Level 1 that are<br />
observable for the asset or liability, either directly or indirectly. These inputs may<br />
include quoted prices for the identical instrument on an inactive market, prices for<br />
similar instruments, interest rates, prepayment speeds, credit risk, yield curves,<br />
default rates and similar data.<br />
Level 3 — Unobservable inputs for the asset or liability, to the extent relevant observable<br />
inputs are not available, representing the Fund’s own assumption about the assumptions<br />
a market participant would use in valuing the asset or liability, and would<br />
be based on the best information available.<br />
Equity securities traded on an exchange or the Nasdaq Stock Market are categorized<br />
in Level 1 of the fair value hierarchy to the extent that they are actively traded<br />
and valuation adjustments are not applied. The underlying funds in which Strategic<br />
Income Fund invests are also categorized in Level 1. Foreign securities that are fair<br />
valued in the event that fluctuations in U.S. securities markets exceed a predetermined<br />
level or if a foreign market is closed are categorized in Level 2. Corporate,<br />
sovereign and municipal bonds, asset backed, U.S. Government and U.S. Government<br />
Agency securities and loan participations are categorized in Level 2 to the extent<br />
that the inputs are observable and timely, otherwise they would be categorized as<br />
Level 3. Short-term notes that are valued at amortized cost are categorized in Level 2.<br />
154
Foreign exchange contracts that are considered derivative instruments and are valued<br />
at the net unrealized appreciation or depreciation on the instruments are categorized<br />
in Level 2. Restricted securities and securities that are fair valued by the Valuation<br />
Committee may be categorized in either Level 2 or Level 3 of the fair value hierarchy<br />
depending on the relative significance of valuation inputs.<br />
The aggregate value by input level, as of March 31, 2014, for each Fund’s investments<br />
is included at the end of each Fund’s portfolio of investments.<br />
B. Federal Income Taxes—No provision has been made for federal income taxes on<br />
net income or capital gains since it is the policy of each Fund to continue to comply<br />
with the special provisions of the Internal Revenue Code applicable to investment<br />
companies, and to make sufficient distributions of income and capital gains (in excess<br />
of any available capital loss carryovers) to relieve it from all, or substantially all, such<br />
taxes. At September 30, 2013, capital loss carryovers were as follows:<br />
Not Subject to<br />
Year Capital Loss Carryovers Expire<br />
Expiration<br />
Fund Total 2014 2015 2016 2017 2018 2019<br />
Long<br />
Term<br />
Short<br />
Term<br />
Government . . . . $ 7,061,305 $ 646,760 $ 1,909,473 $ 1,063,550 $ — $ — $ 40,595 $ — $3,400,927<br />
Investment<br />
Grade. . . . . . . 13,584,806 — — — 13,584,806 — — — —<br />
Fund For<br />
Income . . . . . . 166,931,606 2,665,632 24,660,250 5,033,118 23,949,720 110,622,886 — — —<br />
Select Growth. . . 31,245,713 — — — — 31,245,713 — — —<br />
International . . . . 26,152,463 — — — 3,055,947 20,905,274 2,191,242 — —<br />
As a result of the passage of the Regulated Investment Company Modernization Act<br />
of 2010 (“the Modernization Act of 2010”), losses incurred in fiscal year 2010 and<br />
beyond retain their character as short-term or long-term, have no expiration date and<br />
are utilized prior to capital loss carryovers occurring prior to the enactment of the<br />
Modernization Act of 2010.<br />
The Funds recognize the tax benefits of uncertain tax positions only where the position<br />
is “more likely than not” to be sustained assuming examination by tax authorities.<br />
Management has analyzed the Funds’ tax positions and has concluded that no<br />
liability for unrecognized tax benefits should be recorded related to uncertain tax<br />
positions taken on returns filed for open tax years 2011–2013, or expected to be taken<br />
in the Funds’ 2014 tax returns. The Funds identify their major tax jurisdictions as<br />
U.S. Federal, New York State, New York City and foreign jurisdictions where the<br />
Funds make significant investments; however, the Funds are not aware of any tax<br />
position for which it is reasonably possible that the total amounts of unrecognized tax<br />
benefits will change materially in the next twelve months.<br />
155
Notes to Financial Statements (continued)<br />
FIRST INVESTORS INCOME FUNDS<br />
FIRST INVESTORS EQUITY FUNDS<br />
March 31, 2014<br />
C. Distributions to Shareholders—Dividends from net investment income of the<br />
Government Fund, Investment Grade Fund, Strategic Income Fund, International<br />
Opportunities Bond Fund, Floating Rate Fund and Fund For Income are generally<br />
declared daily and paid monthly. The Cash Management Fund declares distributions,<br />
if any, daily and pays distributions monthly. Distributions are declared from the total<br />
of net investment income plus or minus all realized short-term gains and losses on<br />
investments. Dividends from net investment income, if any, of Total Return Fund,<br />
Equity Income Fund and Growth & Income Fund are declared and paid quarterly.<br />
Dividends from net investment income, if any, of Global Fund, Select Growth Fund,<br />
Opportunity Fund, Special Situations Fund and International Fund are declared and<br />
paid annually. Distributions from net realized capital gains, if any, of each of the<br />
Funds are normally declared and paid annually. Income dividends and capital gain<br />
distributions are determined in accordance with income tax regulations which may<br />
differ from accounting principles generally accepted in the United States of America.<br />
These differences are primarily due to differing treatments for capital loss carryforwards,<br />
deferral of wash sales losses, post-October capital losses, late loss deferrals,<br />
net operating losses and foreign currency transactions.<br />
D. Expense Allocation—Expenses directly charged or attributable to a Fund are paid<br />
from the assets of that Fund. General expenses of the Trusts are allocated among<br />
and charged to the assets of each Fund on a fair and equitable basis, which may be<br />
based on the relative assets of each Fund or the nature of the services performed and<br />
relative applicability to each Fund.<br />
E. Use of Estimates—The preparation of the financial statements in conformity with<br />
accounting principles generally accepted in the United States of America requires<br />
management to make estimates and assumptions that affect the reported amounts of<br />
assets and liabilities at the date of the financial statements and the reported amounts<br />
of revenue and expense during the reporting period. Actual results could differ from<br />
those estimates.<br />
F. Foreign Currency Translations—The accounting records of International Opportunities<br />
Bond Fund, Global Fund and International Fund are maintained in U.S. dollars.<br />
Portfolio securities and other assets and liabilities denominated in foreign currencies<br />
are translated to U.S. dollars at the date of valuation. Purchases and sales of investment<br />
securities, dividend income and certain expenses are translated to U.S. dollars<br />
at the rates of exchange prevailing on the respective dates of such transactions.<br />
International Opportunities Bond Fund, Global Fund and International Fund do not<br />
isolate that portion of gains and losses on investments which is due to changes in<br />
foreign exchange rates from that which is due to changes in market prices of the<br />
156
investments. These changes are included with the net realized and unrealized gains<br />
and losses from investments.<br />
Net realized and unrealized gains and losses on foreign currency transactions include<br />
gains and losses from the sales of foreign currency and gains and losses on accrued<br />
foreign dividends and related withholding taxes.<br />
G. Other—Security transactions are generally accounted for on the first business day<br />
following the date the securities are purchased or sold, except for financial reporting<br />
purposes, which is trade date. Investments in securities issued on a when-issued or<br />
delayed delivery basis are generally reflected in the assets of the Funds on the first<br />
business day following the date the securities are purchased and the Funds segregate<br />
assets for these transactions. Cost of securities is determined and gains and losses<br />
are based on the identified cost basis for both financial statement and federal income<br />
tax purposes. Dividend income is recorded on the ex-dividend date or for certain<br />
foreign dividends, as soon as the Fund becomes aware of the dividends. Interest<br />
income and estimated expenses are accrued daily. Bond discounts and premiums<br />
are accreted or amortized using the interest method. Withholding taxes on foreign<br />
dividends have been provided in accordance with the Funds’ understanding of the<br />
applicable country’s tax rules and rates. The Bank of New York Mellon, custodian<br />
for the Cash Management Fund, Government Fund, Investment Grade Fund, Floating<br />
Rate Fund and Fund For Income, may provide credits against custodian charges<br />
based on uninvested cash balance of the Funds. For the six months ended March 31,<br />
2014, the Bank of New York Mellon did not provide any credits. Brown Brothers<br />
Harriman & Co. serves as custodian for the Strategic Income Fund, the International<br />
Opportunities Bond Fund and each Fund in the Equity Funds. Certain of the Equity<br />
Funds reduced expenses through brokerage service arrangements. For the six months<br />
ended March 31, 2014, expenses were reduced by a total of $14,309 for certain of the<br />
Equity Funds under these arrangements.<br />
2. Security Transactions—For the six months ended March 31, 2014, purchases<br />
and sales of securities and long-term U.S. Government obligations (excluding U.S.<br />
Treasury bills, short-term securities and foreign currencies) were as follows:<br />
157
Notes to Financial Statements (continued)<br />
FIRST INVESTORS INCOME FUNDS<br />
FIRST INVESTORS EQUITY FUNDS<br />
March 31, 2014<br />
Fund<br />
Cost of<br />
Purchases<br />
Securities<br />
Proceeds<br />
of Sales<br />
Long-Term U.S.<br />
Government Obligations<br />
Cost of<br />
Purchases<br />
Proceeds<br />
of Sales<br />
Government . . . . . . . . . . . . . . . . . . $147,386,239 $172,152,824 $91,196,479 $81,433,303<br />
Investment Grade . . . . . . . . . . . . . . 106,443,706 116,716,239 — —<br />
Strategic Income . . . . . . . . . . . . . . 35,790,442 9,687,822 — —<br />
International Opportunities Bond . . 49,192,800 46,494,521 — —<br />
Floating Rate . . . . . . . . . . . . . . . . . 68,559,766 2,121,718 — —<br />
Fund For Income . . . . . . . . . . . . . . 166,890,653 144,655,512 — —<br />
Total Return . . . . . . . . . . . . . . . . . . 148,860,011 171,392,786 22,822,892 11,068,674<br />
Equity Income . . . . . . . . . . . . . . . . 73,876,768 62,698,064 — —<br />
Growth & Income . . . . . . . . . . . . . 219,498,019 195,025,696 — —<br />
Global. . . . . . . . . . . . . . . . . . . . . . . 378,446,042 329,677,672 — —<br />
Select Growth. . . . . . . . . . . . . . . . . 72,819,582 78,927,309 — —<br />
Opportunity . . . . . . . . . . . . . . . . . . 164,805,332 154,765,511 — —<br />
Special Situations. . . . . . . . . . . . . . 169,317,150 149,173,341 — —<br />
International . . . . . . . . . . . . . . . . . . 42,050,319 41,620,737 — —<br />
At March 31, 2014, aggregate cost and net unrealized appreciation (depreciation) of<br />
securities for federal income tax purposes were as follows:<br />
Fund<br />
Aggregate<br />
Cost<br />
Gross<br />
Unrealized<br />
Appreciation<br />
Gross<br />
Unrealized<br />
Depreciation<br />
Net<br />
Unrealized<br />
Appreciation<br />
(Depreciation)<br />
Government . . . . . . . . . . . . $ 366,271,263 $ 7,824,986 $ 2,899,646 $ 4,925,340<br />
Investment Grade . . . . . . . . 522,393,440 25,743,198 3,268,221 22,474,977<br />
Strategic Income . . . . . . . . 74,764,037 904,276 266,283 637,993<br />
International<br />
Opportunities Bond . . . . . 99,237,577 2,280,379 2,838,072 (557,693)<br />
Floating Rate . . . . . . . . . . . 66,424,958 210,518 171,636 38,882<br />
Fund For Income . . . . . . . . 672,841,798 27,323,240 2,359,459 24,963,781<br />
Total Return . . . . . . . . . . . . 559,773,511 183,421,702 3,526,343 179,895,359<br />
Equity Income . . . . . . . . . . 396,446,024 149,865,581 2,906,933 146,958,648<br />
Growth & Income . . . . . . . 1,064,525,121 681,394,507 10,319,205 671,075,302<br />
Global. . . . . . . . . . . . . . . . . 365,785,854 32,968,311 7,684,463 25,283,848<br />
Select Growth. . . . . . . . . . . 249,680,976 115,985,311 2,534,397 113,450,914<br />
Opportunity . . . . . . . . . . . . 511,935,691 321,763,731 6,636,508 315,127,223<br />
Special Situations. . . . . . . . 379,367,491 97,021,143 6,214,469 90,806,674<br />
International . . . . . . . . . . . . 168,531,339 62,021,573 5,001,530 57,020,043<br />
158
The Strategic Income Fund may invest in the Institutional Class of Cash Management<br />
Fund, Government Fund, Investment Grade Fund, International Opportunities Bond<br />
Fund, Floating Rate Fund, Fund For Income, Equity Income Fund, Tax Exempt<br />
Income Fund and Tax Exempt Opportunities Fund. During the six months ended<br />
March 31, 2014, purchases and sales of shares, dividends, capital gains distributions<br />
received and realized gains (losses) recognized by Strategic Income Fund from<br />
investments in the Institutional Classes of the Funds were as follows:<br />
Fund<br />
Balance of<br />
Shares Held<br />
9/30/2013<br />
Purchases/<br />
Additions<br />
Sales/<br />
Reductions<br />
Balance of<br />
Shares Held<br />
3/31/2014<br />
Value<br />
3/31/2014<br />
Dividend<br />
Income<br />
Realized<br />
Capital Gain (Loss)<br />
Gains on Security<br />
Distributions Transactions<br />
Government . . . . . . . . . . 424,622 519,038 (264,866) 678,794 $ 7,385,283 $ 71,677 $ — $ 2,836<br />
Investment Grade . . . . . . 952,122 897,691 (328,805) 1,521,008 15,073,189 295,021 — 40,726<br />
International<br />
Opportunities Bond . . 710,236 379,654 (337,341) 752,549 7,517,965 111,706 — (22,910)<br />
Floating Rate . . . . . . . . . — 374,054 — 374,054 3,744,280 29,088 — —<br />
Fund For Income . . . . . . 7,144,602 4,169,569 (26,378) 11,287,793 30,251,285 679,841 — 2,374<br />
Equity Income . . . . . . . . 523,018 292,765 (24,017) 791,766 7,680,134 67,448 100,350 21,946<br />
9,754,600 6,632,771 (981,407) 15,405,964 $71,652,136 $1,254,781 $100,350 $ 44,972<br />
3. Advisory Fee and Other Transactions With Affiliates—Certain officers of the<br />
Trusts are officers of the Trusts’ investment adviser, FIMCO, their underwriter, <strong>First</strong><br />
<strong>Investors</strong> Corporation (“FIC”) and their transfer agent, Administrative Data Management<br />
Corp. (“ADM”). Trustees of the Trusts who are not officers or directors<br />
of FIMCO or its affiliates are remunerated by the Funds. For the six months ended<br />
March 31, 2014, total trustees fees accrued by the Income Funds and Equity Funds<br />
amounted to $45,999 and $121,983, respectively.<br />
The Investment Advisory Agreements provide as compensation to FIMCO for each<br />
Fund, an annual fee, payable monthly, at the following rates:<br />
Cash Management Fund—.50% of the Fund’s average daily net assets. For the<br />
six months ended March 31, 2014, FIMCO has voluntarily waived $235,607 in advisory<br />
fees to limit the Fund’s overall expense ratio to .60% on Class A shares, 1.35%<br />
on Class B shares and .60% on Institutional Class shares. Also, FIMCO has voluntarily<br />
waived an additional $101,493 in advisory fees and assumed $250,533 of other<br />
Fund expenses to prevent a negative yield on the Fund’s shares.<br />
Government and Investment Grade Funds—.66% on the first $500 million of each<br />
Fund’s average daily net assets, declining by .02% on each $500 million thereafter,<br />
down to .60% on average daily net assets over $1.5 billion. For the periods October 1,<br />
2013 through December 31, 2013 and January 1, 2014 through March 31, 2014,<br />
FIMCO has voluntarily waived $216,452 in advisory fees on Government Fund<br />
159
Notes to Financial Statements (continued)<br />
FIRST INVESTORS INCOME FUNDS<br />
FIRST INVESTORS EQUITY FUNDS<br />
March 31, 2014<br />
to limit the advisory fee to .53% and to .55%, respectively, of its average daily net<br />
assets. For the six months ended March 31, 2014, FIMCO has voluntarily waived<br />
$301,046 in advisory fees on Investment Grade Fund to limit the advisory fee to<br />
.55% of its average daily net assets.<br />
Strategic Income Fund—.05% of the Fund’s average daily net assets.<br />
Floating Rate Fund—.60% on the first $250 million of the Fund’s average daily net<br />
assets, .55% on the next $250 million, .50% on the next $500 million, .45% on the<br />
next $1 billion and .40% on average daily net assets over $2 billion. For the period<br />
October 21, 2013 (commencement of operations) through March 31, 2014, FIMCO has<br />
waived, pursuant to an expense limitation agreement, $136,881 in advisory fees and assumed<br />
$54,342 in other expenses to limit the Fund’s overall expense ratio (exclusive of<br />
certain expenses) to 1.10% on Class A shares, .90% on Advisory Class shares and .70%<br />
on Institutional Class shares.<br />
International Opportunities Bond Fund and Fund For Income—.75% on the first<br />
$250 million of each Fund’s average daily net assets, .72% on the next $250 million,<br />
.69% on the next $250 million, .66% on the next $500 million, declining by .02%<br />
on each $500 million thereafter, down to .60% on average daily net assets over<br />
$2.25 billion. For the six months ended March 31, 2014, FIMCO has waived,<br />
pursuant to an expense limitation agreement, $57,331 in advisory fees to limit the<br />
International Opportunities Bond Fund’s overall expense ratio (exclusive of certain<br />
expenses) to 1.30% on Class A shares. For the six months ended March 31, 2014,<br />
FIMCO has voluntarily waived $77,670 in advisory fees on Fund For Income to limit<br />
the advisory fee to .70% of its average daily net assets.<br />
Total Return Fund— .75% on the first $300 million of the Fund’s average daily net<br />
assets, .70% on the next $200 million, .65% on the next $500 million, .60% on the<br />
next $1 billion, .55% on the next $1 billion, down to .50% on average daily net assets<br />
over $3 billion.<br />
Equity Income, Growth & Income, Select Growth, and Opportunity Funds—.75%<br />
on the first $300 million of each Fund’s average daily net assets, .72% on the next<br />
$200 million, .69% on the next $250 million, .66% on the next $500 million, declining<br />
by .02% on each $500 million thereafter, down to .60% on average daily net assets over<br />
$2.25 billion.<br />
Global Fund—.95% on the first $600 million, .92% on the next $400 million, .90%<br />
on the next $500 million and .88% on average daily net assets over $1.5 billion. For<br />
the six months ended March 31, 2014, FIMCO has voluntarily waived $85,430 in<br />
advisory fees to limit the advisory fee to .90% of the Fund’s average daily net assets.<br />
160
Special Situations Fund—1% on the first $200 million of the Fund’s average daily<br />
net assets, .75% on the next $300 million, .72% on the next $250 million, .69% on<br />
the next $250 million, .66% on the next $500 million, and .64% on average daily<br />
net assets over $1.5 billion. For the six months ended March 31, 2014, FIMCO has<br />
voluntarily waived $138,624 in advisory fees to limit the advisory fee to .80% of the<br />
Fund’s average daily net assets.<br />
International Fund—.98% on the first $300 million of the Fund’s average daily net<br />
assets, .95% on the next $300 million, .92% on the next $400 million, .90% on the<br />
next $500 million and .88% on average daily net assets over $1.5 billion.<br />
For the six months ended March 31, 2014, total advisory fees accrued to FIMCO by<br />
the Income Funds and Equity Funds were $6,391,351 and $18,998,901, respectively,<br />
of which $1,126,480 and $224,054, respectively, was voluntarily waived by FIMCO<br />
as noted above.<br />
FIMCO has entered into an expense limitation agreement with the Strategic Income<br />
Fund (“SIF”) to limit SIF’s total annual fund operating expenses (exclusive of<br />
interest expenses, taxes, brokerage commissions, acquired fund fees and expenses,<br />
dividend costs related to short sales, and extraordinary expenses, such as litigation<br />
expenses, if any) to 1.30% of the average daily net assets on Class A shares and<br />
1.00% of the average daily net assets on Advisor Class shares. The agreement expires<br />
on January 31, 2015. For the period April 3, 2013 (commencement of operations)<br />
to September 30, 2013, FIMCO assumed $95,428 under the terms of the agreement.<br />
FIMCO and SIF have agreed that any expenses of SIF assumed by FIMCO pursuant<br />
to this agreement be repaid to FIMCO by SIF within three years after the date the fee<br />
limitation and/or expense reimbursement has been made by FIMCO, provided that<br />
such repayment does not cause the expenses of SIF’s Class A shares and Advisor<br />
Class shares to exceed the foregoing limits. During the period October 1, 2013 to<br />
March 31, 2014, SIF repaid FIMCO $95,428 pursuant to the terms of the agreement.<br />
The expense limitation agreement may be terminated or amended prior to January 31,<br />
2015, with the approval of the Board.<br />
FIMCO has entered into an expense limitation agreement with the International<br />
Opportunities Bond Fund (“IOBF”) to limit IOBF’s total annual fund operating expenses<br />
(exclusive of interest expenses, taxes, brokerage commissions, acquired fund<br />
fees and expenses, dividend costs related to short sales, and extraordinary expenses,<br />
such as litigation expenses, if any) to 1.30% of the average daily net assets on the<br />
Class A shares. The agreement expires on January 31, 2015. For the six months ended<br />
161
Notes to Financial Statements (continued)<br />
FIRST INVESTORS INCOME FUNDS<br />
FIRST INVESTORS EQUITY FUNDS<br />
March 31, 2014<br />
March 31, 2014, FIMCO assumed $57,332 under the terms of the agreement. FIMCO<br />
and IOBF have agreed that any expenses of IOBF assumed by FIMCO pursuant to<br />
this agreement be repaid to FIMCO by IOBF within three years after the date the fee<br />
limitation and/or expense reimbursement has been made by FIMCO, provided that such<br />
repayment does not cause the expenses of IOBF’s Class A shares to exceed the foregoing<br />
limits. For the period August 20, 2012 (commencement of operations) to March 31,<br />
2014, the total organizational expenses and expenses incurred in excess of the above<br />
stated limitation was $563,823. The expense limitation agreement may be terminated or<br />
amended prior to January 31, 2015, with the approval of the Board.<br />
FIMCO has entered into an expense limitation agreement with the Floating Rate<br />
Fund (“FRF”) to limit FRF’s total annual fund operating expenses (exclusive of<br />
interest expenses, taxes, brokerage commissions, acquired fund fees and expenses,<br />
dividend costs related to short sales, and extraordinary expenses, such as litigation<br />
expenses, if any) to 1.10% of the average daily net assets on the Class A shares, .90%<br />
of the average daily net assets on Advisor Class shares and .70% of the average daily<br />
net assets on Institutional Class shares. The agreement expires on January 31, 2015.<br />
For the period October 21, 2013 (commencement of operations) to March 31, 2014,<br />
FIMCO assumed $191,223 under the terms of the agreement. FIMCO and FRF have<br />
agreed that any expenses of FRF assumed by FIMCO pursuant to this agreement be<br />
repaid to FIMCO by FRF within three years after the date the fee limitation and/or<br />
expense reimbursement has been made by FIMCO, provided that such repayment<br />
does not cause the expenses of FRF’s Class A shares, Advisor Class shares and Institutional<br />
Class shares to exceed the foregoing limits. The expense limitation agreement<br />
may be terminated or amended prior to January 31, 2015, with the approval of<br />
the Board.<br />
For the six months ended March 31, 2014, FIC, as underwriter, received from the<br />
Income Funds and Equity Funds $3,509,361 and $10,608,666, respectively, in commissions<br />
in connection with the sale of shares of the Funds, after allowing $317,409<br />
and $402,379, respectively, to other dealers. For the six months ended March 31,<br />
2014, shareholder servicing costs for the Income Funds and Equity Funds included<br />
$1,253,067 and $3,644,903, respectively, in transfer agent fees accrued to ADM, of<br />
which $22,490 was voluntarily waived by ADM on the Cash Management Fund.<br />
ADM has entered into an agreement with the Funds to limit the transfer agency<br />
expenses for Advisor Class and Institutional Class shares (for those Funds with such<br />
classes) to 0.20% and 0.05%, of the Advisor Class and Institutional Class shares<br />
average daily net assets, respectively. The agreement expires on January 31, 2015.<br />
ADM can be reimbursed by each Class within three years after the date the expense<br />
162
limitation has been made by ADM, provided that such repayment does not cause<br />
the transfer agency expenses of Advisor Class and Institutional Class shares to<br />
exceed the foregoing limits. The expense limitation may be terminated or amended<br />
prior to January 31, 2015, with the approval of the Board. For the six months ended<br />
March 31, 2014, ADM assumed transfer agent fees for the Income Funds and Equity<br />
Funds of $54 and $73, respectively.<br />
Pursuant to Distribution Plans adopted under Rule 12b-1 of the 1940 Act, each Fund,<br />
other than the Cash Management Fund, is authorized to pay FIC a fee up to .30%<br />
of the average daily net assets of the Class A shares and 1% of the average daily net<br />
assets of the Class B shares on an annualized basis each fiscal year, payable monthly.<br />
The Cash Management Fund is authorized to pay FIC a fee up to 1% of the average<br />
daily net assets of the Class B shares. The fee consists of a distribution fee and<br />
a service fee. The service fee is paid for the ongoing servicing of clients who are<br />
shareholders of that Fund. For the six months ended March 31, 2014, total distribution<br />
plan fees accrued to FIC by the Income Funds and Equity Funds amounted to<br />
$2,693,882 and $7,828,348, respectively.<br />
Brandywine Global Investment Management, LLC, serves as investment subadviser<br />
to International Opportunities Bond Fund. Muzinich & Co., Inc., serves as investment<br />
subadviser to Floating Rate Fund and Fund For Income. Wellington Management<br />
Company, LLP serves as investment subadviser to Global Fund. Smith Asset<br />
Management Group, L.P. serves as investment subadviser to Select Growth Fund.<br />
Vontobel Asset Management, Inc. serves as investment subadviser to International<br />
Fund. The subadvisers are paid by FIMCO and not by the Funds.<br />
4. Restricted Securities—Certain restricted securities are exempt from the registration<br />
requirements under Rule 144A of the Securities Act of 1933 and may only be<br />
sold to qualified institutional investors. Unless otherwise noted, these 144A securities<br />
are deemed to be liquid. At March 31, 2014, Investment Grade Fund held twentyfour<br />
144A securities with an aggregate value of $82,370,976 representing 14.6% of<br />
the Fund’s net assets, International Opportunities Bond Fund held six 144A securities<br />
with an aggregate value of $4,845,378 representing 4.5% of the Fund’s net assets,<br />
Floating Rate Fund held three 144A securities with an aggregate value of $741,907<br />
representing 1.1% of the Fund’s net assets, Fund For Income held one hundred sixteen<br />
144A securities with an aggregate value of $245,378,689 representing 34.5% of<br />
the Fund’s net assets and Total Return Fund held twenty-one 144A securities with an<br />
aggregate value of $23,214,940 representing 3.1% of the Fund’s net assets. Certain<br />
restricted securities are exempt from the registration requirements under Section 4(2)<br />
of the Securities Act of 1933 and may only be sold to qualified investors. Unless<br />
163
Notes to Financial Statements (continued)<br />
FIRST INVESTORS INCOME FUNDS<br />
FIRST INVESTORS EQUITY FUNDS<br />
March 31, 2014<br />
otherwise noted, these Section 4(2) securities are deemed to be liquid. At March 31,<br />
2014, Cash Management Fund held eight Section 4(2) securities with an aggregate<br />
value of $31,643,502 representing 22.4% of the Fund’s net assets. These securities<br />
are valued as set forth in Note 1A.<br />
5. Derivatives—The Funds (other than the Cash Management and Strategic Income<br />
Funds) may invest in derivatives such as futures contracts and options on futures<br />
contracts (“options”), to increase income, hedge against changes in interest rates or<br />
enhance potential return.<br />
The Funds may enter into interest rate futures contracts on U.S. Treasury obligations<br />
and options thereon that are traded on a U.S. exchange. An interest rate futures<br />
contract provides for the future sale by one party and the purchase by another party<br />
of a specified amount of a particular financial instrument (debt security) at a specified<br />
price, date, time and place. Such investments may be used for the purpose of hedging<br />
against changes in the value of a Fund’s portfolio securities due to anticipated<br />
changes in interest rates and market conditions. A public market exists for interest<br />
rate futures contracts covering a number of debt securities, including long-term U.S.<br />
Treasury Bonds, 10-year U.S. Treasury Notes and three-month U.S. Treasury Bills.<br />
No price is paid upon entering into futures contracts. Instead, upon entering into a<br />
futures contract, the Funds are required to deposit with their custodian in a segregated<br />
account in the name of the futures broker through which the transaction is effected an<br />
amount of cash or U.S. Government securities generally equal to 3%-5% or less of<br />
the contract value. This amount is known as “initial margin.”<br />
An option on an interest rate futures contract generally gives the purchaser the right,<br />
in return for the premium paid, to assume a position in a futures contract at a specified<br />
exercise price at any time prior to the expiration date of the option. The Funds<br />
may purchase put and call options on interest rate futures contracts on U.S. Treasury<br />
obligations which are traded on a U.S. exchange as a hedge against changes in<br />
interest rates, and may enter into closing transactions with respect to such options to<br />
terminate existing positions. There is no guarantee such closing transactions can be<br />
effected. When writing a call or put option on a futures contract, margin also must<br />
be deposited in accordance with applicable exchange rules. Initial margin on futures<br />
contracts is in the nature of a performance bond or good-faith deposit that is returned<br />
to a Fund upon termination of the transaction, assuming all obligations have been<br />
satisfied. Under certain circumstances, such as periods of high volatility, a Fund<br />
may be required by an exchange to increase the level of its initial margin payment.<br />
Subsequent payments, called “variation margin,” to and from the broker, are made on<br />
a daily basis as the value of the futures position varies, a process known as “marking<br />
to market.” Variation margin does not involve borrowing to finance the futures<br />
164
transactions, but rather represents a daily settlement of a Fund’s obligation to or from<br />
a clearing organization. A Fund is also obligated to make initial and variation margin<br />
payments when it writes options on futures contracts.<br />
To the extent that a Fund participates in the futures or options markets, it will incur<br />
investment risks and transaction costs to which it would not be subject absent the<br />
use of these strategies. The use of these strategies involves certain special risks,<br />
including: (1) dependence on the ability of the Funds’ investment adviser, FIMCO<br />
to predict correctly movements in the direction of interest rates and securities prices;<br />
(2) imperfect correlation between the price of futures contracts and options thereon<br />
and movements in the prices of the securities or currencies being hedged; (3) the<br />
fact that skills needed to use these strategies are different from those needed to select<br />
portfolio securities; (4) the leverage (if any) that is created by investing in the option<br />
or futures contract; and (5) the possible absence of a liquid secondary market for any<br />
particular instrument at any time. If FIMCO’s prediction of movements in the direction<br />
of the securities and interest rate markets is inaccurate, the adverse consequences<br />
to that Fund may leave it in a worse position than if such strategies were not used.<br />
During the six months ended March 31, 2014, the Funds did not participate in<br />
interest rate futures contracts. At March 31, 2014, the Funds had no open investments<br />
in futures contracts or options.<br />
6. High Yield Credit Risk—The investments of Floating Rate Fund and Fund For<br />
Income in high yield securities, whether rated or unrated, may be considered speculative<br />
and subject to greater market fluctuations and risks of loss of income and<br />
principal than lower-yielding, higher-rated, fixed-income securities. The risk of loss<br />
due to default by the issuer may be significantly greater for holders of high-yielding<br />
securities, because such securities are generally unsecured and are often subordinated<br />
to other creditors of the issuer.<br />
7. Foreign Exchange Contracts—The International Opportunities Bond Fund may<br />
enter into foreign exchange contracts for the purchase or sale of foreign currencies at<br />
negotiated rates at future dates. These contracts are considered derivative instruments<br />
and are used to decrease exposure to foreign exchange risk associated with foreign<br />
currency denominated securities held by the Fund. The Fund could be exposed to risk<br />
if counterparties to the contracts are unable to meet the terms of their contracts or if<br />
the value of the foreign currency changes unfavorably. Foreign exchange contracts<br />
are “marked-to-market” daily at the applicable translation rate and the resulting<br />
unrealized gains and losses are reflected in the Fund’s assets.<br />
165
Notes to Financial Statements (continued)<br />
FIRST INVESTORS INCOME FUNDS<br />
FIRST INVESTORS EQUITY FUNDS<br />
March 31, 2014<br />
The International Opportunities Bond Fund had the following foreign exchange<br />
contracts open at March 31, 2014:<br />
Counterparty<br />
Settlement<br />
Date<br />
Foreign<br />
Currency<br />
Receive<br />
(Deliver) Asset Liability<br />
Unrealized<br />
Appreciation<br />
(Depreciation)<br />
J.P. Morgan 4/24/14 IDR 24,440,000,000 $2,151,409 $2,019,184 $132,225<br />
Citibank 4/25/14 PLN 13,030,000 4,312,570 4,278,078 34,492<br />
Citibank 4/25/14 PLN (13,030,000) 4,217,852 4,312,570 (94,718)<br />
HSBC 5/7/14 EUR 1,710,000 2,356,800 2,325,330 31,470<br />
Citibank 5/7/14 EUR (1,050,000) 1,418,550 1,447,158 (28,608)<br />
UBS 5/12/14 AUD 1,080,000 1,001,001 969,245 31,756<br />
Morgan Stanley 5/12/14 AUD 7,860,000 7,285,063 7,094,265 190,798<br />
HSBC 5/12/14 AUD 210,000 194,639 186,593 8,046<br />
Morgan Stanley 5/12/14 AUD (12,630,000) 11,257,119 11,706,151 (449,031)<br />
J.P. Morgan 6/4/14 IDR 23,390,000,000 2,058,979 1,987,762 71,216<br />
HSBC 6/6/14 CLP 539,000,000 978,683 952,802 25,881<br />
HSBC 6/13/14 CLP 653,000,000 1,185,677 1,163,267 22,410<br />
Citibank 6/17/14 NZD (4,630,000) 3,892,510 4,017,667 (125,157)<br />
Barclays 6/18/14 INR 322,000,000 5,391,603 5,173,106 218,497<br />
HSBC 6/19/14 HUF 276,000,000 1,237,365 1,216,502 20,863<br />
HSBC 7/11/14 CLP 1,705,600,000 3,096,924 3,004,062 92,862<br />
HSBC 7/28/14 CLP 662,000,000 1,202,019 1,182,163 19,856<br />
Net Unrealized gain on open foreign exchange contracts $202,858<br />
Fair Value of Derivative Instruments—The fair value of derivative instruments on<br />
the International Opportunities Bond Fund as of March 31, 2014, was as follows:<br />
Derivatives not accounted<br />
for as hedging instruments<br />
under ASC 815<br />
Foreign exchange<br />
contracts:<br />
Assets Derivatives<br />
Statements of<br />
Assets and<br />
Liabilities<br />
Location<br />
Value<br />
Unrealized<br />
appreciation<br />
of foreign<br />
exchange<br />
contracts $900,373<br />
Liability Derivatives<br />
Statements of<br />
Assets and<br />
Liabilities<br />
Location<br />
Unrealized<br />
depreciation of<br />
foreign exchange<br />
contracts<br />
Value<br />
$697,515<br />
166
The effect of International Opportunities Bond Fund’s derivative instruments on the<br />
Statement of Operations are as follows:<br />
Amount of Realized Gain or Loss Recognized on Derivatives<br />
Derivatives not accounted<br />
Net Realized Loss<br />
for as hedging instruments<br />
on Foreign Exchange<br />
under ASC 815<br />
Transactions<br />
Foreign exchange transactions<br />
International Opportunities Bond Fund $(1,074,573)<br />
Amount of Change in Unrealized Gain or Loss Recognized on Derivatives<br />
Derivatives not accounted<br />
Net Unrealized Appreciation<br />
for as hedging instruments<br />
on Foreign Exchange<br />
under ASC 815<br />
Transactions<br />
Foreign exchange transactions:<br />
International Opportunities Bond Fund $202,858<br />
8. Capital—The Trusts are authorized to issue an unlimited number of shares of beneficial<br />
interest without par value. The Trusts consist of the Funds listed on the cover<br />
page, each of which is a separate and distinct series of the Trusts. Each Fund has<br />
designated four classes of shares, Class A, Class B, Advisor Class and Institutional<br />
Class shares (each, a “Class”) except for Cash Management Fund which has designated<br />
only Class A, Class B and Institutional Class shares and Strategic Income Fund<br />
which has designated only Class A and Advisor Class shares and International Opportunities<br />
Bond Fund and Floating Rate Fund which have designated only Class A,<br />
Advisor Class and Institutional Class shares. Advisor Class and Institutional Class<br />
shares are new classes that have been added to the Trusts. Institutional Class and<br />
Advisor Class shares were available for sale to the public in May 2013 and October<br />
2013, respectively. Not all classes of shares of each Fund may be available in all<br />
jurisdictions. Each share of each Class has an equal beneficial interest in the assets,<br />
has identical voting, dividend, liquidation and other rights and is subject to the same<br />
terms and conditions except that expenses allocated to a Class may be borne solely by<br />
that Class as determined by the Board and a Class may have exclusive voting rights<br />
with respect to matters affecting only that Class. Cash Management Fund’s Class A,<br />
Class B and Institutional Class shares are sold without an initial sales charge; however,<br />
its Class B shares may only be acquired through an exchange of Class B shares<br />
from another <strong>First</strong> <strong>Investors</strong> eligible Fund or through the reinvestment of dividends<br />
on Class B shares and are generally subject to a contingent deferred sales charge at<br />
167
Notes to Financial Statements (continued)<br />
FIRST INVESTORS INCOME FUNDS<br />
FIRST INVESTORS EQUITY FUNDS<br />
March 31, 2014<br />
the rate of 4% in the first year and declining to 0% over a six-year period, which is<br />
payable to FIC as underwriter of the Trusts. The shares sold by the other Funds have<br />
a public offering price that reflects different sales charges and expense levels. Class A<br />
shares are sold with an initial sales charge of up to 5.75% of the amount invested and<br />
together with the Class B shares are subject to distribution plan fees as described in<br />
Note 3. Class B shares are sold without an initial sales charge, but are generally subject<br />
to a contingent deferred sales charge which declines in steps from 4% to 0% over<br />
a six-year period. Class B shares automatically convert into Class A shares after eight<br />
years. There are no sales charges associated with the purchase of Advisor Class and<br />
Institutional Class shares. Realized and unrealized gains or losses, investment income<br />
and expenses (other than distribution plan fees) are allocated daily to each class of<br />
shares based upon the relative proportion of net assets to each class.<br />
9. Litigation—The Equity Income and Blue Chip Funds have been named, and have<br />
received notice that they may be putative members of the proposed defendant class of<br />
shareholders, in a lawsuit filed in the United States Bankruptcy Court for the District<br />
of Delaware on November 1, 2010, by the Official Committee of Unsecured Creditors<br />
of Tribune Company (the “Committee”). The Committee is seeking to recover all<br />
payments made to beneficial owners of common stock in connection with a leveraged<br />
buyout of the Tribune Company (“LBO”), including payments made in connection<br />
with a 2007 tender offer into which the Blue Chip and Equity Income Funds tendered<br />
their shares of common stock of the Tribune Company. On December 9, 2011, the<br />
Blue Chip Fund was reorganized into the Growth & Income Fund pursuant to a Plan of<br />
Reorganization and Termination, whereby all of the assets of the Blue Chip Fund were<br />
transferred to the Growth & Income Fund, the Growth & Income Fund assumed all of<br />
the liabilities of the Blue Chip Fund, including any contingent liabilities with respect to<br />
pending or threatened litigation or actions, and shareholders of Blue Chip Fund became<br />
shareholders of Growth & Income Fund. The adversary proceeding brought by the<br />
Committee has been transferred to the Southern District of New York and consolidated<br />
with other similar suits as discussed below. In addition, on June 2, 2011, the Blue Chip<br />
and Equity Income Funds were named as defendants in a lawsuit brought in connection<br />
with the Tribune Company’s LBO by Deutsche Bank Trust Company Americas, in its<br />
capacity as successor indenture trustee for a certain series of Senior Notes, Law Debenture<br />
Trust Company of New York, in its capacity as successor indenture trustee for<br />
a certain series of Senior Notes, and Wilmington Trust Company, in its capacity as successor<br />
indenture trustee for the PHONES Notes (together, the “Bondholder Plaintiffs”)<br />
in the Supreme Court of the State of New York. The Blue Chip and Equity Income<br />
Funds have also been named in a similar suit filed on behalf of participants in Tribune<br />
168
defined-compensation plans (the “Retiree Plaintiffs”). That suit was also initially filed<br />
in the Supreme Court of New York but later removed and consolidated in the Southern<br />
District of New York with the other Tribune suits. As with the Bondholder Plaintiffs<br />
and the Committee, the Retiree Plaintiffs seek to recover payments of the proceeds of<br />
the LBO. These suits have been removed to the United States District Court for the<br />
Southern District of New York and administratively consolidated with other substantially<br />
similar suits against other former Tribune shareholders (the “MDL Proceeding”).<br />
On September 23, 2013, the Judge in the MDL Proceeding dismissed various state<br />
law constructive fraudulent transfer suits, resulting in the Funds being dismissed from<br />
the Bondholder and Retiree Plaintiffs’ actions. On September 30, 2013, counsel for<br />
the plaintiffs in those suits appealed the MDL Judge’s dismissal ruling to the Second<br />
Circuit. The extent of the Funds’ potential liability in any such actions has not been determined.<br />
The Funds have been advised by counsel that the Funds could be held liable<br />
to return all or part of the proceeds received in any of these actions, as well as interest<br />
and court costs, even though the Funds had no knowledge of, or participation in, any<br />
misconduct. The Equity Income Fund received proceeds of $1,526,566 in connection<br />
with the LBO, representing 0.28% of its net assets as of March 31, 2014. The Blue<br />
Chip Fund received proceeds of $790,772 in connection with the LBO, representing<br />
0.05% of the net assets of Growth & Income Fund as of March 31, 2014. The Equity<br />
Income and Growth & Income Funds cannot predict the outcomes of these proceedings,<br />
and thus have not accrued any of the amounts sought in the various actions in the<br />
accompanying financial statements.<br />
10. New Fund—On February 20, 2014, the Board approved the establishment of a<br />
new series of the <strong>First</strong> <strong>Investors</strong> Income Funds, <strong>First</strong> <strong>Investors</strong> Limited Duration High<br />
Quality Bond Fund (the “Limited Duration Fund”). The Limited Duration Fund is<br />
registered under the Investment Company Act of 1940 as a diversified fund and is<br />
authorized to issue an unlimited number of shares of beneficial interest of Class A,<br />
Advisor Class and Institutional Class. Under normal circumstances, the Fund will<br />
invest at least 80% of its net assets (plus any borrowings for investment purposes) in<br />
investment grade bonds. For purposes of the 80% test, investment grade bonds may<br />
also include other investment grade fixed-income securities. The investment objective<br />
of the Fund is to seek current income consistent with low volatility of principal. The<br />
Fund commenced operations on May 19, 2014.<br />
11. Subsequent Events—Subsequent events occurring after March 31, 2014 have<br />
been evaluated for potential impact to this report through the date the financial statements<br />
were issued. There were no subsequent events to report that would have a<br />
material impact on the Funds’ financial statements.<br />
169
Financial Highlights<br />
FIRST INVESTORS INCOME FUNDS<br />
The following table sets forth the per share operating performance data for a share outstanding,<br />
total return, ratios to average net assets and other supplemental data for each fiscal year ended<br />
September 30 unless otherwise indicated.<br />
P E R S H A R E D A T A<br />
Investment Operations<br />
Less Distributions<br />
from<br />
Net Asset<br />
Value,<br />
Beginning<br />
of Period<br />
Net<br />
Investment<br />
Income<br />
Net Realized<br />
and Unrealized<br />
Gain (Loss) on<br />
Investments<br />
Total from<br />
Investment<br />
Operations<br />
Net<br />
Investment<br />
Income<br />
Net<br />
Realized<br />
Gain<br />
Total<br />
Distributions<br />
Net Asset<br />
Value,<br />
End of<br />
Period<br />
CASH MANAGEMENT FUND<br />
Class A<br />
2009 . . . . . . $ 1.00 $.005 — $.005 $.005 — $.005 $ 1.00<br />
2010 . . . . . . 1.00 — — — — — — 1.00<br />
2011 . . . . . . 1.00 — — — — — — 1.00<br />
2012 . . . . . . 1.00 — — — — — — 1.00<br />
2013 . . . . . . 1.00 — — — — — — 1.00<br />
2014^ . . . . . 1.00 — — — — — — 1.00<br />
Class B<br />
2009 . . . . . . 1.00 .001 — .001 .001 — .001 1.00<br />
2010 . . . . . . 1.00 — — — — — — 1.00<br />
2011 . . . . . . 1.00 — — — — — — 1.00<br />
2012 . . . . . . 1.00 — — — — — — 1.00<br />
2013 . . . . . . 1.00 — — — — — — 1.00<br />
2014^ . . . . . 1.00 — — — — — — 1.00<br />
Institutional Class<br />
2013 ■ . . . . . 1.00 — — — — — — 1.00<br />
2014^ . . . . . 1.00 — — — — — — 1.00<br />
GOVERNMENT FUND<br />
Class A<br />
2009 . . . . . . $10.76 $ .47 $ .44 $ .91 $ .47 — $ .47 $11.20<br />
2010 . . . . . . 11.20 .43 .16 .59 .43 — .43 11.36<br />
2011 . . . . . . 11.36 .36 .28 .64 .41 — .41 11.59<br />
2012 . . . . . . 11.59 .27 .04 .31 .38 — .38 11.52<br />
2013 . . . . . . 11.52 .17 (.43) (.26) .32 — .32 10.94<br />
2014^ . . . . . 10.94 .10 (.05) .05 .13 — .13 10.86<br />
Class B<br />
2009 . . . . . . 10.76 .39 .43 .82 .39 — .39 11.19<br />
2010 . . . . . . 11.19 .35 .17 .52 .36 — .36 11.35<br />
2011 . . . . . . 11.35 .26 .29 .55 .33 — .33 11.57<br />
2012 . . . . . . 11.57 .17 .07 .24 .30 — .30 11.51<br />
2013 . . . . . . 11.51 .07 (.42) (.35) .24 — .24 10.92<br />
2014^ . . . . . 10.92 .05 (.05) — .09 — .09 10.83<br />
Advisor Class<br />
2013 ■ . . . . . 11.29 .10 (.30) (.20) .15 — .15 10.94<br />
2014^ . . . . . 10.94 .08 (.04) .04 .14 — .14 10.84<br />
Institutional Class<br />
2013 ■ . . . . . 11.29 .14 (.31) (.17) .16 — .16 10.96<br />
2014^ . . . . . 10.96 .13 (.06) .07 .15 — .15 10.88<br />
170
Total<br />
Return*<br />
Net Assets<br />
End of Period<br />
(in thousands)<br />
R A T I O S / S U P P L E M E N T A L D A T A<br />
Net Expenses<br />
After Fee<br />
Credits<br />
Ratio to Average<br />
Net Assets**<br />
Net Expenses<br />
Before Fee<br />
Credits(a)<br />
Net<br />
Investment<br />
Income<br />
Ratio to Average Net<br />
Assets Before Expenses<br />
Waived or Assumed<br />
Net<br />
Investment<br />
Expenses(a) Income (Loss)<br />
Portfolio<br />
Turnover<br />
Rate<br />
0.54% $172,336 .71% .71% .58% 1.03% .26% N/A<br />
0.00 134,103 .30 .30 .00 1.08 (.78) N/A<br />
0.00 148,171 .17 .17 .00 1.06 (.89) N/A<br />
0.00 135,028 .12 .12 .00 1.02 (.90) N/A<br />
0.00 130,272 .11 .11 .00 .97 (.86) N/A<br />
0.00† 137,719 .08†† .08†† .00†† .99†† (.91)†† N/A<br />
0.14 3,430 1.13 1.13 .16 1.78 (.49) N/A<br />
0.00 1,739 .30 .30 .00 1.83 (1.53) N/A<br />
0.00 1,519 .17 .17 .00 1.81 (1.64) N/A<br />
0.00 896 .12 .12 .00 1.77 (1.65) N/A<br />
0.00 571 .12 .12 .00 1.72 (1.60) N/A<br />
0.00† 702 .08†† .08†† .00†† 1.66†† (1.58)†† N/A<br />
0.00† 1 .15†† .15†† .00†† 2.60†† (2.45)†† N/A<br />
0.00† 2,548 .08†† .08†† .00†† .66†† (0.58)†† N/A<br />
8.59% $286,844 1.10% 1.10% 4.03% 1.26% 3.87% 43%<br />
5.39 325,979 1.13 1.13 3.44 1.24 3.33 42<br />
5.73 346,828 1.12 1.12 3.12 1.23 3.01 35<br />
2.71 382,064 1.10 1.10 2.28 1.21 2.17 36<br />
(2.29) 355,264 1.10 1.10 1.57 1.21 1.46 101<br />
0.48† 348,555 1.07†† 1.07†† 1.79†† 1.19†† 1.67†† 67†<br />
7.75 13,131 1.80 1.80 3.33 1.96 3.17 43<br />
4.70 10,860 1.83 1.83 2.74 1.94 2.63 42<br />
4.94 7,284 1.82 1.82 2.42 1.93 2.31 35<br />
2.11 6,393 1.80 1.80 1.59 1.91 1.47 36<br />
(3.06) 4,717 1.84 1.84 .82 1.95 .71 101<br />
0.03† 3,829 1.89†† 1.89†† .97†† 2.01†† .85†† 67†<br />
(1.75)† 1 .95†† .95†† 1.68†† 5.17†† (2.54)†† 101<br />
0.35† 1 .84†† .84†† 2.02†† 3.16†† (.30)†† 67†<br />
(1.54)† 4,656 .68†† .68†† 2.14†† .81†† 2.01†† 101<br />
0.61† 7,994 .64†† .64†† 2.19†† .76†† 2.07†† 67†<br />
171
Financial Highlights (continued)<br />
FIRST INVESTORS INCOME FUNDS<br />
P E R S H A R E D A T A<br />
Investment Operations<br />
Less Distributions<br />
from<br />
Net Asset<br />
Value,<br />
Beginning<br />
of Period<br />
Net<br />
Investment<br />
Income<br />
Net Realized<br />
and Unrealized<br />
Gain (Loss) on<br />
Investments<br />
Total from<br />
Investment<br />
Operations<br />
Net<br />
Investment<br />
Income<br />
Net<br />
Realized<br />
Gain<br />
Total<br />
Distributions<br />
Net Asset<br />
Value,<br />
End of<br />
Period<br />
INVESTMENT GRADE FUND<br />
Class A<br />
2009 . . . . . . $ 8.23 $.49 $ .85 $1.34 $.47 — $.47 $ 9.10<br />
2010 . . . . . . 9.10 .44 .72 1.16 .45 — .45 9.81<br />
2011 . . . . . . 9.81 .40 (.16) .24 .43 — .43 9.62<br />
2012 . . . . . . 9.62 .38 .68 1.06 .41 — .41 10.27<br />
2013 . . . . . . 10.27 .35 (.46) (.11) .38 — .38 9.78<br />
2014^ . . . . . 9.78 .16 .16 .32 .20 — .20 9.90<br />
Class B<br />
2009 . . . . . . 8.22 .44 .85 1.29 .40 — .40 9.11<br />
2010 . . . . . . 9.11 .39 .70 1.09 .39 — .39 9.81<br />
2011 . . . . . . 9.81 .33 (.16) .17 .36 — .36 9.62<br />
2012 . . . . . . 9.62 .32 .66 .98 .34 — .34 10.26<br />
2013 . . . . . . 10.26 .27 (.45) (.18) .32 — .32 9.76<br />
2014^ . . . . . 9.76 .12 .14 .26 .16 — .16 9.86<br />
Advisor Class<br />
2013 ■ . . . . . 10.23 .08 (.34) (.26) .19 — .19 9.78<br />
2014^ . . . . . 9.78 .11 .20 .31 .20 — .20 9.89<br />
Institutional Class<br />
2013 ■ . . . . . 10.23 .14 (.38) (.24) .20 — .20 9.79<br />
2014^ . . . . . 9.79 .14 .19 .33 .21 — .21 9.91<br />
STRATEGIC INCOME FUND<br />
Class A<br />
2013◆ . . . . . $10.00 $.14 $(.23) $(.09) $.13 — $.13 $ 9.78<br />
2014^ . . . . . 9.78 .14 .24 .38 .14 — .14 10.02<br />
Advisor Class<br />
2013◆ . . . . . 10.00 .14 (.22) (.08) .15 — .15 9.77<br />
2014^ . . . . . 9.77 .17 .21 .38 .15 — .15 10.00<br />
172
Total<br />
Return*<br />
Net Assets<br />
End of Period<br />
(in thousands)<br />
R A T I O S / S U P P L E M E N T A L D A T A<br />
Net Expenses<br />
After Fee<br />
Credits<br />
Ratio to Average<br />
Net Assets**<br />
Net Expenses<br />
Before Fee<br />
Credits(a)<br />
Net<br />
Investment<br />
Income<br />
Ratio to Average Net<br />
Assets Before Expenses<br />
Waived, Assumed<br />
or Reimbursed<br />
Net<br />
Investment<br />
Income<br />
Expenses(a) (Loss)<br />
Portfolio<br />
Turnover<br />
Rate<br />
17.06% $325,316 1.10% 1.10% 5.29% 1.27% 5.12% 79%<br />
13.09 404,841 1.12 1.12 4.75 1.23 4.64 56<br />
2.48 437,094 1.11 1.11 3.94 1.22 3.83 34<br />
11.22 531,896 1.08 1.08 3.54 1.19 3.43 40<br />
(1.10) 543,955 1.07 1.07 3.20 1.18 3.09 33<br />
3.24† 542,998 1.05†† 1.05†† 3.20†† 1.16†† 3.09†† 19†<br />
16.35 16,370 1.80 1.80 4.59 1.97 4.42 79<br />
12.20 13,855 1.82 1.82 4.05 1.93 3.94 56<br />
1.81 9,976 1.81 1.81 3.24 1.92 3.13 34<br />
10.41 8,036 1.78 1.78 2.84 1.89 2.74 40<br />
(1.82) 6,161 1.84 1.84 2.42 1.94 2.32 33<br />
2.71† 5,466 1.93†† 1.93†† 2.31†† 2.04†† 2.20†† 19†<br />
(2.53)† 1 .95†† .95†† 2.64†† 5.17†† (1.58)†† 33<br />
3.19† 1 .83†† .83†† 3.42†† 3.07†† 1.18†† 19†<br />
(2.37)† 9,326 .66†† .66†† 3.06†† .77†† 2.95†† 33<br />
3.43† 16,733 .63†† .63†† 3.62†† .74†† 3.51†† 19†<br />
(.87)%† $ 47,344 1.30%†† 1.30%†† 2.88%†† 2.10%†† 2.08%†† 19%<br />
3.89† 76,091 1.14†† 1.14†† 2.90†† .83†† 3.21†† 16†<br />
(.79)† 1 1.00†† 1.00†† 2.89†† 14.79†† (10.90)†† 19<br />
3.98† 241 .69†† .69†† 3.38†† .46†† 3.61†† 16†<br />
173
Financial Highlights (continued)<br />
FIRST INVESTORS INCOME FUNDS<br />
P E R S H A R E D A T A<br />
Investment Operations<br />
Less Distributions<br />
from<br />
Net Asset<br />
Value,<br />
Beginning<br />
of Period<br />
Net<br />
Investment<br />
Income<br />
Net Realized<br />
and Unrealized<br />
Gain (Loss) on<br />
Investments<br />
Total from<br />
Investment<br />
Operations<br />
Net<br />
Investment<br />
Income<br />
Net<br />
Realized<br />
Gain<br />
Total<br />
Distributions<br />
Net Asset<br />
Value,<br />
End of<br />
Period<br />
INTERNATIONAL OPPORTUNITIES BOND FUND<br />
Class A<br />
2012 ▲ . . . . . $10.00 $ .01 $ .23 $ .24 $.02 $ — $.02 $10.22<br />
2013 . . . . . . 10.22 .25 (.32) (.07) .30 .01 .31 9.84<br />
2014^ . . . . . 9.84 .09 .17 .26 .13 — .13 9.97<br />
Advisor Class<br />
2013 ■ . . . . . 10.23 .08 (.31) (.23) .15 — .15 9.85<br />
2014^ . . . . . 9.85 .11 .13 .24 .13 — .13 9.96<br />
Institutional Class<br />
2013 ■ . . . . . 10.23 .12 (.35) (.23) .15 — .15 9.85<br />
2014^ . . . . . 9.85 .08 .20 .28 .14 — .14 9.99<br />
FLOATING RATE FUND<br />
Class A<br />
2014 ❖ . . . . . $10.00 $ .09 $ .02 $ .11 $.09 — $.09 $10.02<br />
Advisor Class<br />
2014 ❖ . . . . . 10.00 .09 .04 .13 .11 — .11 10.02<br />
Institutional Class<br />
2014 ❖ . . . . . 10.00 .12 — .12 .11 — .11 10.01<br />
174
Total<br />
Return*<br />
Net Assets<br />
End of Period<br />
(in thousands)<br />
R A T I O S / S U P P L E M E N T A L D A T A<br />
Net Expenses<br />
After Fee<br />
Credits<br />
Ratio to Average<br />
Net Assets**<br />
Net Expenses<br />
Before Fee<br />
Credits(a)<br />
Net<br />
Investment<br />
Income<br />
(Loss)<br />
Ratio to Average Net<br />
Assets Before Expenses<br />
Waived or Assumed<br />
Net<br />
Investment<br />
Income<br />
Expenses(a) (Loss)<br />
Portfolio<br />
Turnover<br />
Rate<br />
2.35%† $ 19,563 1.30%†† 1.30%†† 1.10%†† 9.76%†† (6.12)%†† 5%<br />
(.72) 99,161 1.30 1.30 .68 1.83 .15 53<br />
2.70† 98,464 1.30†† 1.30†† 1.85†† 1.43†† 1.72†† 51†<br />
(2.26)† 1 1.07†† 1.07†† (1.43)†† 5.23†† (5.59)†† 53<br />
2.52† 1 1.14†† 1.14†† 2.01†† 3.40†† (.25)†† 51†<br />
(2.26)† 6,998 .96†† .96†† (1.31)†† .96†† (1.31)†† 53<br />
2.86† 8,047 .95†† .95†† 2.16†† .95†† 2.16†† 51†<br />
1.12%† $66,126 1.10%†† 1.10%†† 1.97%†† 1.93%†† 1.14%†† 5%†<br />
1.28† 1 .90†† .90†† 2.17†† 4.53†† 1.46†† 5†<br />
1.12† 4,050 .70†† .70†† 2.60†† 1.56†† 1.74†† 5†<br />
175
Financial Highlights (continued)<br />
FIRST INVESTORS INCOME FUNDS<br />
P E R S H A R E D A T A<br />
Investment Operations<br />
Less Distributions<br />
from<br />
Net Asset<br />
Value,<br />
Beginning<br />
of Period<br />
Net<br />
Investment<br />
Income<br />
Net Realized<br />
and Unrealized<br />
Gain (Loss) on<br />
Investments<br />
Total from<br />
Investment<br />
Operations<br />
Net<br />
Investment<br />
Income<br />
Net<br />
Realized<br />
Gain<br />
Total<br />
Distributions<br />
Net Asset<br />
Value,<br />
End of<br />
Period<br />
FUND FOR INCOME<br />
Class A<br />
2009 . . . . . . $2.45 $.20 $(.13) $.07 $.20 — $.20 $2.32<br />
2010 . . . . . . 2.32 .17 .18 .35 .18 — .18 2.49<br />
2011 . . . . . . 2.49 .17 (.14) .03 .17 — .17 2.35<br />
2012 . . . . . . 2.35 .16 .25 .41 .16 — .16 2.60<br />
2013 . . . . . . 2.60 .15 (.01) .14 .15 — .15 2.59<br />
2014^ . . . . . 2.59 .06 .09 .15 .07 — .07 2.67<br />
Class B<br />
2009 . . . . . . 2.45 .19 (.13) .06 .18 — .18 2.33<br />
2010 . . . . . . 2.33 .16 .16 .32 .16 — .16 2.49<br />
2011 . . . . . . 2.49 .15 (.13) .02 .16 — .16 2.35<br />
2012 . . . . . . 2.35 .13 .26 .39 .14 — .14 2.60<br />
2013 . . . . . . 2.60 .13 (.01) .12 .13 — .13 2.59<br />
2014^ . . . . . 2.59 .05 .09 .14 .06 — .06 2.67<br />
Advisor Class<br />
2013 ■ . . . . . 2.66 .06 (.05) .01 .08 — .08 2.59<br />
2014^ . . . . . 2.59 .06 .09 .15 .07 — .07 2.67<br />
Institutional Class<br />
2013 ■ . . . . . 2.66 .03 (.01) .02 .08 — .08 2.60<br />
2014^ . . . . . 2.60 .07 .08 .15 .07 — .07 2.68<br />
* Calculated without sales charges.<br />
** Net of expenses waived or assumed (Note 3).<br />
■<br />
For the period April 1, 2013 (commencement of operations) to September 30, 2013.<br />
◆ For the period April 3, 2013 (commencement of operations) to September 30, 2013.<br />
<br />
Recognition of net investment income by the Fund is affected by the timing of the declaration of<br />
dividends by the underlying investment companies in which the Fund invests. The ratio does not<br />
include net investment income of the investment companies in which the Fund invests.<br />
<br />
Does not include expenses of the investment companies in which the Fund invests.<br />
▲ For the period August 20, 2012 (commencemnet of operations) to September 30, 2012.<br />
❖ For the period October 21, 2013 (commencemnet of operations) to March 31, 2014.<br />
† Not annualized<br />
†† Annualized<br />
(a) The ratios do not include a reduction of expenses from cash balances maintained with the<br />
custodian or from brokerage service arrangements (Note 1G).<br />
^ For the period October 1, 2013 to March 31, 2014.<br />
Based on average shares during the period.<br />
176 See notes to financial statements
R A T I O S / S U P P L E M E N T A L D A T A<br />
Ratio to Average Net<br />
Ratio to Average<br />
Assets Before Expenses<br />
Net Assets**<br />
Waived or Assumed<br />
Total<br />
Return*<br />
Net Assets<br />
End of Period<br />
(in thousands)<br />
Net Expenses<br />
After Fee<br />
Credits<br />
Net Expenses<br />
Before Fee<br />
Credits(a)<br />
Net<br />
Investment<br />
Income<br />
Expenses(a)<br />
Net<br />
Investment<br />
Income<br />
Portfolio<br />
Turnover<br />
Rate<br />
4.28% $438,248 1.38% 1.38% 9.10% 1.42% 9.06 73%<br />
15.68 504,507 1.29 1.29 7.32 1.33 7.28 78<br />
1.00 504,839 1.27 1.27 6.43 1.30 6.40 75<br />
17.79 602,370 1.26 1.26 6.01 1.29 5.98 54<br />
5.55 647,603 1.23 1.23 5.17 1.25 5.15 60<br />
5.82† 673,948 1.21†† 1.21†† 4.75†† 1.23†† 4.73†† 22†<br />
3.75 11,699 2.08 2.08 8.40 2.12 8.36 73<br />
14.43 10,891 1.99 1.99 6.62 2.03 6.58 78<br />
.38 7,580 1.97 1.97 5.75 2.00 5.72 75<br />
17.01 5,659 1.96 1.96 5.31 1.99 5.28 54<br />
4.84 5,001 1.99 1.99 4.42 2.01 4.40 60<br />
5.47† 5,030 2.03†† 2.03†† 3.92†† 2.06†† 3.89†† 22†<br />
.23† 1 1.03†† 1.03†† 4.59†† 5.13†† .49†† 60<br />
5.85† 1 .98†† .98†† 4.98†† 2.75†† 3.21†† 22†<br />
.66† 18,575 .81†† .81†† 4.93†† .83†† 4.91†† 60<br />
5.92† 33,201 .78†† .78†† 5.17†† .80†† 5.15†† 22†<br />
177
Financial Highlights<br />
FIRST INVESTORS EQUITY FUNDS<br />
The following table sets forth the per share operating performance data for a share outstanding,<br />
total return, ratios to average net assets and other supplemental data for each fiscal year ended<br />
September 30, except as otherwise indicated.<br />
P E R S H A R E D A T A<br />
Investment Operations<br />
Less Distributions<br />
from<br />
Net Asset<br />
Value,<br />
Beginning<br />
of Period<br />
Net<br />
Investment<br />
Income<br />
Net Realized<br />
and Unrealized<br />
Gain (Loss) on<br />
Investments<br />
Total from<br />
Investment<br />
Operations<br />
Net<br />
Investment<br />
Income<br />
Net<br />
Realized<br />
Gain<br />
Total<br />
Distributions<br />
Net Asset<br />
Value,<br />
End of<br />
Period<br />
TOTAL RETURN FUND<br />
Class A<br />
2009 . . . . . . $13.24 $.30 $ .03 $ .33 $.32 $ — $.32 $13.25<br />
2010 . . . . . . 13.25 .28 .95 1.23 .29 — .29 14.19<br />
2011 . . . . . . 14.19 .31 (.06) .25 .34 — .34 14.10<br />
2012 . . . . . . 14.10 .30 2.71 3.01 .30 — .30 16.81<br />
2013 . . . . . . 16.81 .27 1.99 2.26 .34 .24 .58 18.49<br />
2014^ . . . . . 18.49 .12 1.19 1.31 .16 .42 .58 19.22<br />
Class B<br />
2009 . . . . . . 13.03 .21 .03 .24 .23 — .23 13.04<br />
2010 . . . . . . 13.04 .18 .94 1.12 .20 — .20 13.96<br />
2011 . . . . . . 13.96 .19 (.04) .15 .23 — .23 13.88<br />
2012 . . . . . . 13.88 .18 2.65 2.83 .18 — .18 16.53<br />
2013 . . . . . . 16.53 .15 1.95 2.10 .22 .24 .46 18.17<br />
2014^ . . . . . 18.17 .05 1.16 1.21 .08 .42 .50 18.88<br />
Advisor Class<br />
2013 ■ . . . . . 17.62 .09 .95 1.04 .17 — .17 18.49<br />
2014^ . . . . . 18.49 .11 1.19 1.30 .16 .42 .58 19.21<br />
Institutional Class<br />
2013 ■ . . . . . 17.62 .10 .95 1.05 .17 — .17 18.50<br />
2014^ . . . . . 18.50 .13 1.21 1.34 .19 .42 .61 19.23<br />
EQUITY INCOME FUND(b)<br />
Class A<br />
2009 . . . . . . $ 6.65 $.11 $(.64) $ (.53) $.11 $ — $.11 $ 6.01<br />
2010 . . . . . . 6.01 .09 .49 .58 .09 — .09 6.50<br />
2011 . . . . . . 6.50 .11 (.30) (.19) .11 — .11 6.20<br />
2012 . . . . . . 6.20 .13 1.44 1.57 .10 — .10 7.67<br />
2013 . . . . . . 7.67 .14 1.32 1.46 .14 — .14 8.99<br />
2014^ . . . . . 8.99 .06 .85 .91 .08 .15 .23 9.67<br />
Class B<br />
2009 . . . . . . 6.55 .08 (.64) (.56) .07 — .07 5.92<br />
2010 . . . . . . 5.92 .05 .48 .53 .05 — .05 6.40<br />
2011 . . . . . . 6.40 .06 (.30) (.24) .06 — .06 6.10<br />
2012 . . . . . . 6.10 .08 1.42 1.50 .05 — .05 7.55<br />
2013 . . . . . . 7.55 .09 1.28 1.37 .08 — .08 8.84<br />
2014^ . . . . . 8.84 .03 .82 .85 .03 .15 .18 9.51<br />
Advisor Class<br />
2013 ■ . . . . . 8.40 .08 .58 .66 .07 — .07 8.99<br />
2014^ . . . . . 8.99 .06 .85 .91 .08 .15 .23 9.67<br />
Institutional Class<br />
2013 ■ . . . . . 8.40 .04 .63 .67 .05 — .05 9.02<br />
2014^ . . . . . 9.02 .08 .85 .93 .10 .15 .25 9.70<br />
178
Total<br />
Return*<br />
Net Assets<br />
End of Period<br />
(in thousands)<br />
R A T I O S / S U P P L E M E N T A L D A T A<br />
Net Expenses<br />
After Fee<br />
Credits<br />
Ratio to Average<br />
Net Assets**<br />
Net Expenses<br />
Before Fee<br />
Credits(a)<br />
Net<br />
Investment<br />
Income<br />
Ratio to Average Net<br />
Assets Before Expenses<br />
Waived or Assumed<br />
Net<br />
Investment<br />
Income<br />
Expenses(a) (Loss)<br />
Portfolio<br />
Turnover<br />
Rate<br />
2.77% $315,612 1.43% 1.43% 2.35% N/A N/A 53%<br />
9.38 360,843 1.37 1.37 2.02 N/A N/A 40<br />
1.65 384,720 1.33 1.33 1.97 N/A N/A 36<br />
21.46 532,551 1.32 1.32 1.79 N/A N/A 32<br />
13.77 664,054 1.26 1.26 1.45 N/A N/A 32<br />
7.09† 729,729 1.20†† 1.20†† 1.21†† N/A N/A 25†<br />
2.10 20,575 2.13 2.13 1.65 N/A N/A 53<br />
8.62 16,982 2.07 2.07 1.32 N/A N/A 40<br />
1.01 12,961 2.03 2.03 1.30 N/A N/A 36<br />
20.49 10,872 2.02 2.02 1.09 N/A N/A 32<br />
12.98 10,207 2.01 2.01 .71 N/A N/A 32<br />
6.66† 10,221 1.99†† 1.99†† .42†† N/A N/A 25†<br />
5.89† 1 1.01†† 1.01†† 1.40†† 4.76%†† (2.35)%†† 32<br />
7.02† 1 .97†† .97†† 1.44†† 2.60†† (.19)†† 25†<br />
5.98† 1 .82†† .82†† 1.48†† 4.35†† (2.05)†† 32<br />
7.26† 2,669 .80†† .80†† 1.61†† N/A N/A 25†<br />
(7.81)% $308,402 1.48% 1.48% 2.14% N/A N/A 15%<br />
9.76 335,725 1.38 1.38 1.45 N/A N/A 21<br />
(3.12) 317,550 1.35 1.35 1.60 N/A N/A 29<br />
25.36 392,001 1.33 1.33 1.75 N/A N/A 38<br />
19.14 475,422 1.28 1.28 1.66 N/A N/A 32<br />
10.16† 525,780 1.23†† 1.23†† 1.36†† N/A N/A 13†<br />
(8.43) 12,419 2.18 2.18 1.44 N/A N/A 15<br />
8.97 11,133 2.08 2.08 .75 N/A N/A 21<br />
(3.87) 7,947 2.05 2.05 .90 N/A N/A 29<br />
24.56 6,939 2.03 2.03 1.02 N/A N/A 38<br />
18.21 6,337 2.05 2.05 .90 N/A N/A 32<br />
9.65† 6,335 2.08†† 2.08†† .50†† N/A N/A 13†<br />
7.87† 1 1.01†† 1.01†† 1.78†† 4.68%†† (1.89)%†† 32<br />
10.13† 1 1.00†† 1.00†† 1.59†† 2.58†† .01†† 13†<br />
7.95† 4,717 .86†† .86†† 1.74†† .86†† 1.74†† 32<br />
10.31† 9,621 .81†† .81†† 1.78†† N/A N/A 13†<br />
179
Financial Highlights (continued)<br />
FIRST INVESTORS EQUITY FUNDS<br />
180<br />
Net Asset<br />
Value,<br />
Beginning<br />
of Period<br />
Investment<br />
Income<br />
(Loss)<br />
Investment Operations<br />
Net Net Realized<br />
and Unrealized<br />
Gain (Loss) on<br />
Investments<br />
P E R S H A R E D A T A<br />
Total from<br />
Investment<br />
Operations<br />
Net<br />
Investment<br />
Income<br />
Less Distributions<br />
from<br />
Net<br />
Realized<br />
Gain<br />
Distributions<br />
in Excess of<br />
Net Investment<br />
Income<br />
Total<br />
Distributions<br />
GROWTH & INCOME FUND<br />
Class A<br />
2009 . . . . . . $13.00 $ .09 $(1.02) $ (.93) $.14 $.02 — $.16<br />
2010 . . . . . . 11.91 .09 .98 1.07 .07 — — .07<br />
2011 . . . . . . 12.91 .19 (.14) .05 .18 — — .18<br />
2012 . . . . . . 12.78 .21 3.81 4.02 .14 — — .14<br />
2013 . . . . . . 16.66 .20 3.90 4.10 .22 — — .22<br />
2014^ . . . . . 20.54 .09 2.10 2.19 .13 .68 — .81<br />
Class B<br />
2009 . . . . . . 12.30 .01 (.97) (.96) .10 .02 — .12<br />
2010 . . . . . . 11.22 (.03) .95 .92 — — — —<br />
2011 . . . . . . 12.14 .08 (.12) (.04) .09 — — .09<br />
2012 . . . . . . 12.01 .10 3.58 3.68 .05 — — .05<br />
2013 . . . . . . 15.64 .06 3.67 3.73 .11 — — .11<br />
2014^ . . . . . 19.26 — 1.96 1.96 — .68 — .68<br />
Advisor Class<br />
2013 ■ . . . . . 18.49 .13 2.00 2.13 .08 — — .08<br />
2014^ . . . . . 20.54 .10 2.12 2.22 .11 .68 — .79<br />
Institutional Class<br />
2013 ■ . . . . . 18.49 .15 2.00 2.15 .09 — — .09<br />
2014^ . . . . . 20.55 .13 2.11 2.24 .19 .68 — .87<br />
GLOBAL FUND<br />
Class A<br />
2009 . . . . . . $ 5.75 $ .02 $ — $ .02 $.02 $ — $.02 $.04<br />
2010 . . . . . . 5.73 — .42 .42 .01 — — .01<br />
2011 . . . . . . 6.14 .01 (.61) (.60) — — — —<br />
2012 . . . . . . 5.54 .03 1.24 1.27 .02 — — .02<br />
2013 . . . . . . 6.79 .05 1.20 1.25 .03 — — .03<br />
2014^ . . . . . 8.01 — .54 .54 .04 .11 — .15<br />
Class B<br />
2009 . . . . . . 5.09 (.03) — (.03) .01 — .02 .03<br />
2010 . . . . . . 5.03 (.06) .39 .33 — — — —<br />
2011 . . . . . . 5.36 (.09) (.46) (.55) — — — —<br />
2012 . . . . . . 4.81 (.09) 1.15 1.06 .01 — — .01<br />
2013 . . . . . . 5.86 (.07) 1.09 1.02 .02 — — .02<br />
2014^ . . . . . 6.86 (.07) .51 .44 — .11 — .11<br />
Advisor Class<br />
2013 ■ . . . . . 7.28 .06 .67 .73 — — — —<br />
2014^ . . . . . 8.01 .03 .51 .54 — .11 — .11<br />
Institutional Class<br />
2013 ■ . . . . . 7.28 .06 .68 .74 — — — —<br />
2014^ . . . . . 8.02 .02 .54 .56 — .11 — .11
Net Asset<br />
Value,<br />
End of<br />
Period<br />
Total<br />
Return*<br />
Net Assets<br />
End of Period<br />
(in thousands)<br />
R A T I O S / S U P P L E M E N T A L D A T A<br />
Net Expenses<br />
After Fee<br />
Credits<br />
Ratio to Average<br />
Net Assets**<br />
Net Expenses<br />
Before Fee<br />
Credits(a)<br />
Net<br />
Investment<br />
Income (Loss)<br />
Ratio to Average Net<br />
Assets Before Expenses<br />
Waived or Assumed<br />
Net<br />
Investment<br />
Expenses(a) Income (Loss)<br />
Portfolio<br />
Turnover<br />
Rate<br />
$11.91 (6.93)% $577,801 1.51% 1.51% .90% N/A N/A 26%<br />
12.91 9.01 626,370 1.39 1.39 .68 N/A N/A 25<br />
12.78 .25 625,562 1.34 1.34 1.33 N/A N/A 24<br />
16.66 31.60 1,225,684 1.29 1.29 1.35 N/A N/A 22<br />
20.54 24.86 1,538,582 1.22 1.22 1.11 N/A N/A 20<br />
21.92 10.69† 1,702,119 1.15†† 1.15†† .84†† N/A N/A 12†<br />
11.22 (7.59) 30,490 2.21 2.21 .20 N/A N/A 26<br />
12.14 8.23 26,160 2.09 2.09 (.02) N/A N/A 25<br />
12.01 (.44) 19,635 2.04 2.04 .66 N/A N/A 24<br />
15.64 30.71 27,306 1.99 1.99 .63 N/A N/A 22<br />
19.26 24.02 27,762 1.96 1.96 .37 N/A N/A 20<br />
20.54 10.19† 27,314 1.96†† 1.96†† .03†† N/A N/A 12†<br />
20.54 11.53† 1 .97†† .97†† 1.31†† 4.60%†† (2.32)%†† 20<br />
21.97 10.85† 1 .93†† .93†† 1.06†† 2.30†† (.31)†† 12†<br />
20.55 11.64† 1 .78†† .78†† 1.50†† 4.19†† (1.91)†† 20<br />
21.92 10.92† 9,260 .75†† .75†† 1.24†† N/A N/A 12†<br />
$ 5.73 .53% $249,206 1.90% 1.90% .38% 1.93% .35% 141%<br />
6.14 7.33 269,075 1.72 1.72 .04 1.75 .01 92<br />
5.54 (9.77) 241,494 1.67 1.67 .18 1.70 .15 103<br />
6.79 22.88 283,328 1.68 1.69 .44 1.70 .42 94<br />
8.01 18.56 317,329 1.60 1.61 .66 1.62 .65 92<br />
8.40 6.70† 382,266 1.51†† 1.51†† (.05)†† 1.56†† (.10)†† 98†<br />
5.03 (.37) 7,339 2.60 2.60 (.32) 2.63 (.35) 141<br />
5.36 6.56 6,551 2.42 2.42 (.66) 2.45 (.69) 92<br />
4.81 (10.26) 4,515 2.37 2.37 (.55) 2.40 (.58) 103<br />
5.86 21.99 4,388 2.38 2.39 (.27) 2.40 (.29) 94<br />
6.86 17.55 4,419 2.36 2.36 (.10) 2.38 (.12) 92<br />
7.19 6.37† 4,298 2.34†† 2.34†† (.90)†† 2.39†† (.95)†† 98†<br />
8.01 10.03† 1 1.27†† 1.27†† 1.46†† 4.88†† (2.15)†† 92<br />
8.44 6.70† 1 1.24†† 1.24†† .22†† 2.79†† (1.33)†† 98†<br />
8.02 10.17† 1 1.14†† 1.14†† 1.55†† 4.59†† (1.90)†† 92<br />
8.47 6.95† 2,875 1.05†† 1.05†† .39†† 1.10†† .34†† 98†<br />
181
Financial Highlights (continued)<br />
FIRST INVESTORS EQUITY FUNDS<br />
P E R S H A R E D A T A<br />
Investment Operations<br />
Less Distributions<br />
from<br />
Net Asset<br />
Value,<br />
Beginning<br />
of Period<br />
Net<br />
Investment<br />
Income<br />
(Loss)<br />
Net Realized<br />
and Unrealized<br />
Gain (Loss) on<br />
Investments<br />
Total from<br />
Investment<br />
Operations<br />
Net<br />
Investment<br />
Income<br />
Net<br />
Realized<br />
Gain<br />
Total<br />
Distributions<br />
Net Asset<br />
Value,<br />
End of<br />
Period<br />
SELECT GROWTH FUND<br />
Class A<br />
2009 . . . . . . $ 6.69 $(.02) $(1.34) $(1.36) $ — — $ — $ 5.33<br />
2010 . . . . . . 5.33 (.03) .49 .46 — — — 5.79<br />
2011 . . . . . . 5.79 (.02) .54 .52 — — — 6.31<br />
2012 . . . . . . 6.31 (.03) 1.70 1.67 — — — 7.98<br />
2013 . . . . . . 7.98 .02 1.24 1.26 — — — 9.24<br />
2014^ . . . . . 9.24 — 1.40 1.40 .00⇟ — .00⇟ 10.64<br />
Class B<br />
2009 . . . . . . 6.25 (.06) (1.25) (1.31) — — — 4.94<br />
2010 . . . . . . 4.94 (.07) .46 .39 — — — 5.33<br />
2011 . . . . . . 5.33 (.07) .51 .44 — — — 5.77<br />
2012 . . . . . . 5.77 (.09) 1.57 1.48 — — — 7.25<br />
2013 . . . . . . 7.25 (.06) 1.15 1.09 — — — 8.34<br />
2014^ . . . . . 8.34 (.06) 1.28 1.22 — — — 9.56<br />
Advisor Class<br />
2013 ■ . . . . . 8.46 .01 .79 .80 — — — 9.26<br />
2014^ . . . . . 9.26 — 1.40 1.40 — — — 10.66<br />
Institutional Class<br />
2013 ■ . . . . . 8.46 .02 .79 .81 — — — 9.27<br />
2014^ . . . . . 9.27 .02 1.41 1.43 — — — 10.70<br />
OPPORTUNITY FUND<br />
Class A<br />
2009 . . . . . . $22.99 $ .01 $(1.61) $(1.60) $ — $ .63 $ .63 $20.76<br />
2010 . . . . . . 20.76 .05 2.65 2.70 — — — 23.46<br />
2011 . . . . . . 23.46 .17 .49 .66 .05 — .05 24.07<br />
2012 . . . . . . 24.07 .26 6.10 6.36 .17 .89 1.06 29.37<br />
2013 . . . . . . 29.37 .18 9.64 9.82 .26 .80 1.06 38.13<br />
2014^ . . . . . 38.13 .03 4.27 4.30 .16 2.43 2.59 39.84<br />
Class B<br />
2009 . . . . . . 20.41 (.10) (1.47) (1.57) — .63 .63 18.21<br />
2010 . . . . . . 18.21 (.14) 2.37 2.23 — — — 20.44<br />
2011 . . . . . . 20.44 (.10) .52 .42 .01 — .01 20.85<br />
2012 . . . . . . 20.85 .01 5.31 5.32 .13 .89 1.02 25.15<br />
2013 . . . . . . 25.15 (.12) 8.26 8.14 .22 .80 1.02 32.27<br />
2014^ . . . . . 32.27 (.11) 3.61 3.50 — 2.43 2.43 33.34<br />
Advisor Class<br />
2013 ■ . . . . . 33.13 .16 4.89 5.05 — — — 38.18<br />
2014^ . . . . . 38.18 — 4.31 4.31 — 2.43 2.43 40.06<br />
Institutional Class<br />
2013 ■ . . . . . 33.13 .19 4.89 5.08 — — — 38.21<br />
2014^ . . . . . 38.21 .11 4.28 4.39 .17 2.43 2.60 40.00<br />
182
Total<br />
Return*<br />
Net Assets<br />
End of Period<br />
(in thousands)<br />
R A T I O S / S U P P L E M E N T A L D A T A<br />
Net Expenses<br />
After Fee<br />
Credits<br />
Ratio to Average<br />
Net Assets**<br />
Net Expenses<br />
Before Fee<br />
Credits(a)<br />
Net<br />
Investment<br />
Income<br />
(Loss)<br />
Ratio to Average Net<br />
Assets Before Expenses<br />
Waived or Assumed<br />
Net<br />
Investment<br />
Expenses(a) Income (Loss)<br />
Portfolio<br />
Turnover<br />
Rate<br />
(20.33)% $169,930 1.67% 1.67% (.51)% N/A N/A 120%<br />
8.63 183,556 1.56 1.56 (.48) N/A N/A 98<br />
8.98 203,243 1.45 1.45 (.28) N/A N/A 62<br />
26.47 271,019 1.42 1.42 (.35) N/A N/A 53<br />
15.79 315,833 1.35 1.35 .25 N/A N/A 71<br />
15.20† 355,490 1.28†† 1.28†† .00†† N/A N/A 21†<br />
(20.96) 10,495 2.37 2.37 (1.21) N/A N/A 120<br />
7.90 8,423 2.26 2.26 (1.18) N/A N/A 98<br />
8.26 6,692 2.15 2.15 (.98) N/A N/A 62<br />
25.65 5,853 2.12 2.12 (1.07) N/A N/A 53<br />
15.03 5,308 2.10 2.10 (.48) N/A N/A 71<br />
14.63† 5,402 2.06†† 2.06†† (.79)†† N/A N/A 21†<br />
9.46† 1 1.02†† 1.02†† .25†† 4.63%†† (3.36)%†† 71<br />
15.12† 1 1.02†† 1.02†† .26†† 2.35†† (1.07)†† 21†<br />
9.57† 1 .89†† .89†† .39†† 4.32†† (3.04)†† 71<br />
15.43† 2,832 .84†† .84†† .45†† N/A N/A 21†<br />
(6.24)% $355,324 1.58% 1.58% .09% N/A N/A 35%<br />
13.01 402,117 1.44 1.44 .24 N/A N/A 40<br />
2.77 415,392 1.36 1.36 .62 N/A N/A 37<br />
26.99 529,886 1.35 1.35 .94 N/A N/A 36<br />
34.47 726,942 1.28 1.28 .56 N/A N/A 40<br />
11.24† 816,407 1.21†† 1.21†† .14†† N/A N/A 20†<br />
(6.90) 23,121 2.28 2.28 (.61) N/A N/A 35<br />
12.25 20,130 2.14 2.14 (.52) N/A N/A 40<br />
2.04 15,025 2.06 2.06 (.04) N/A N/A 37<br />
26.12 13,129 2.05 2.05 .15 N/A N/A 36<br />
33.49 13,677 2.02 2.02 (.18) N/A N/A 40<br />
10.79† 13,352 2.00†† 2.00†† (.66)†† N/A N/A 20†<br />
15.24† 1 .98†† .98†† .91†† 4.48%†† (2.59)%†† 40<br />
11.26† 8 .98†† .98†† .37†† 2.41†† (1.06)†† 20†<br />
15.33† 1 .85†† .85†† 1.06†† 4.17†† (2.26)†† 40<br />
11.46† 3,479 .79†† .80†† .57†† N/A N/A 20†<br />
183
Financial Highlights (continued)<br />
FIRST INVESTORS EQUITY FUNDS<br />
P E R S H A R E D A T A<br />
Investment Operations<br />
Less Distributions<br />
from<br />
Net Asset<br />
Value,<br />
Beginning<br />
of Period<br />
Net<br />
Investment<br />
Income<br />
(Loss)<br />
Net Realized<br />
and Unrealized<br />
Gain (Loss) on<br />
Investments<br />
Total from<br />
Investment<br />
Operations<br />
Net<br />
Investment<br />
Income<br />
Net<br />
Realized<br />
Gain<br />
Total<br />
Distributions<br />
Net Asset<br />
Value,<br />
End of<br />
Period<br />
SPECIAL SITUATIONS FUND<br />
Class A<br />
2009 . . . . . . $20.15 $ .03 $(1.23) $(1.20) $.02 $ .53 $ .55 $18.40<br />
2010 . . . . . . 18.40 (.05) 2.31 2.26 — — — 20.66<br />
2011 . . . . . . 20.66 .03 1.03 1.06 — — — 21.72<br />
2012 . . . . . . 21.72 .01 4.46 4.47 .03 1.76 1.79 24.40<br />
2013 . . . . . . 24.40 .11 4.68 4.79 .12 1.00 1.12 28.07<br />
2014^ . . . . . 28.07 .01 3.13 3.14 — 4.60 4.60 26.61<br />
Class B<br />
2009 . . . . . . 17.81 (.10) (1.09) (1.19) — .53 .53 16.09<br />
2010 . . . . . . 16.09 (.25) 2.11 1.86 — — — 17.95<br />
2011 . . . . . . 17.95 (.13) .92 .79 — — — 18.74<br />
2012 . . . . . . 18.74 (.15) 3.84 3.69 — 1.76 1.76 20.67<br />
2013 . . . . . . 20.67 (.10) 3.96 3.86 .08 1.00 1.08 23.45<br />
2014^ . . . . . 23.45 (.08) 2.58 2.50 — 4.60 4.60 21.35<br />
Advisor Class<br />
2013 ■ . . . . . 25.71 .01 2.37 2.38 — — — 28.09<br />
2014^ . . . . . 28.09 (.01) 3.13 3.12 — 4.60 4.60 26.61<br />
Institutional Class<br />
2013 ■ . . . . . 25.71 .06 2.37 2.43 — — — 28.14<br />
2014^ . . . . . 28.14 .07 3.13 3.20 — 4.60 4.60 26.74<br />
INTERNATIONAL FUND<br />
Class A<br />
2009 . . . . . . $ 9.48 $ .29 $ (.74) $ (.45) $.13 — $ .13 $ 8.90<br />
2010 . . . . . . 8.90 .15 1.15 1.30 .02 — .02 10.18<br />
2011 . . . . . . 10.18 .12 (.59) (.47) .17 — .17 9.54<br />
2012 . . . . . . 9.54 .10 2.20 2.30 .16 — .16 11.68<br />
2013 . . . . . . 11.68 .04 .81 .85 — — — 12.53<br />
2014^ . . . . . 12.53 .02 .68 .70 .02 — .02 13.21<br />
Class B<br />
2009 . . . . . . 9.33 .22 (.72) (.50) .12 — .12 8.71<br />
2010 . . . . . . 8.71 .08 1.12 1.20 — — — 9.91<br />
2011 . . . . . . 9.91 .01 (.52) (.51) .16 — .16 9.24<br />
2012 . . . . . . 9.24 (.04) 2.19 2.15 .14 — .14 11.25<br />
2013 . . . . . . 11.25 (.11) .84 .73 — — — 11.98<br />
2014^ . . . . . 11.98 (.06) .68 .62 — — — 12.60<br />
Advisor Class<br />
2013 ■ . . . . . 12.79 .06 (.30) (.24) — — — 12.55<br />
2014^ . . . . . 12.55 .02 .68 .70 — — — 13.25<br />
Institutional Class<br />
2013 ■ . . . . . 12.79 .08 (.31) (.23) — — — 12.56<br />
2014^ . . . . . 12.56 .05 .70 .75 — — — 13.31<br />
184 See notes to financial statements
Total<br />
Return*<br />
Net Assets<br />
End of Period<br />
(in thousands)<br />
R A T I O S / S U P P L E M E N T A L D A T A<br />
Net Expenses<br />
After Fee<br />
Credits<br />
Ratio to Average<br />
Net Assets**<br />
Net Expenses<br />
Before Fee<br />
Credits(a)<br />
Net<br />
Investment<br />
Income<br />
(Loss)<br />
Ratio to Average Net<br />
Assets Before Expenses<br />
Waived or Assumed<br />
Net<br />
Investment<br />
Income<br />
Expenses(a) (Loss)<br />
Portfolio<br />
Turnover<br />
Rate<br />
(5.28)% $246,063 1.64% 1.64% .22% 1.82% .04% 55%<br />
12.28 274,074 1.52 1.52 (.28) 1.65 (.41) 64<br />
5.13 285,220 1.44 1.44 .13 1.54 .03 73<br />
21.19 342,939 1.43 1.43 .03 1.53 (.07) 41<br />
20.47 412,102 1.39 1.39 .42 1.47 .34 110<br />
11.48† 453,871 1.35†† 1.35†† .06†† 1.41†† .00†† 35†<br />
(5.99) 8,856 2.34 2.34 (.48) 2.52 (.66) 55<br />
11.56 7,577 2.22 2.22 (.94) 2.35 (1.07) 64<br />
4.40 5,884 2.14 2.14 (.55) 2.24 (.65) 73<br />
20.33 5,085 2.13 2.13 (.67) 2.23 (.77) 41<br />
19.62 4,932 2.13 2.13 (.29) 2.21 (.37) 110<br />
10.97† 5,000 2.19†† 2.19†† (.79)†† 2.26†† (.86)†† 35†<br />
9.26† 1 1.16†† 1.16†† .08†† 4.82†† (3.58)†† 110<br />
11.40† 1 1.08†† 1.08†† .32†† 2.68†† (1.28)†† 35†<br />
9.45† 1 .84†† .84†† .42†† 4.43†† (3.17)†† 110<br />
11.68† 5,851 .90†† .90†† .52†† .96†† .46†† 35†<br />
(4.52)% $107,645 2.20% 2.20% 1.16% N/A N/A 60%<br />
14.63 129,570 1.97 1.97 1.33 N/A N/A 32<br />
(4.70) 128,479 1.88 1.88 1.20 N/A N/A 30<br />
24.34 165,797 1.82 1.82 .86 N/A N/A 41<br />
7.28 215,873 1.71 1.71 .34 N/A N/A 31<br />
5.63† 222,333 1.65†† 1.65†† .25†† N/A N/A 19†<br />
(5.19) 3,401 2.90 2.90 .46 N/A N/A 60<br />
13.78 3,569 2.67 2.67 .59 N/A N/A 32<br />
(5.30) 2,983 2.58 2.58 .30 N/A N/A 30<br />
23.50 3,328 2.52 2.52 (.02) N/A N/A 41<br />
6.49 3,200 2.46 2.46 (.45) N/A N/A 31<br />
5.18† 3,241 2.51†† 2.51†† (.58)†† N/A N/A 19†<br />
(1.88)† 1 1.45†† 1.45†† .97†† 5.30%†† (2.88)%†† 31<br />
5.58† 1 1.36†† 1.36†† .54†† 3.14†† (1.24)†† 19†<br />
(1.80)† 1 1.19†† 1.19†† 1.23†† 4.84†† (2.42)†† 31<br />
5.97† 2,290 1.17†† 1.17†† .81†† 1.17†† .81†† 19†<br />
185
Financial Highlights (continued)<br />
FIRST INVESTORS EQUITY FUNDS<br />
* Calculated without sales charges.<br />
** Net of expenses waived or assumed (Note 3).<br />
† Not annualized<br />
†† Annualized<br />
^ For the period October 1, 2013 to March 31, 2014.<br />
■<br />
For the period April 1, 2013 (commencement of operations) to September 30, 2013.<br />
(a) The ratios do not include a reduction of expenses from cash balances maintained with the<br />
custodian or from brokerage service arrangements (Note 1G).<br />
(b) Prior to September 4, 2012, known as Value Fund.<br />
Based on average shares during the period.<br />
⇟ Due to rounding, amount is less than .005 per share.<br />
186
This page left intentionally blank.<br />
187
Report of Independent Registered Public<br />
Accounting Firm<br />
To the Shareholders and Board of Trustees of<br />
<strong>First</strong> <strong>Investors</strong> Income Funds and <strong>First</strong> <strong>Investors</strong> Equity Funds<br />
We have audited the accompanying statements of assets and liabilities, including the<br />
portfolios of investments of the Cash Management Fund, Government Fund, Investment<br />
Grade Fund, Strategic Income Fund, International Opportunities Bond Fund,<br />
Floating Rate Fund and Fund For Income (each a series of <strong>First</strong> <strong>Investors</strong> Income<br />
Funds), and the Total Return Fund, Equity Income Fund, Growth & Income Fund,<br />
Global Fund, Select Growth Fund, Opportunity Fund, Special Situations Fund, and<br />
International Fund (each a series of <strong>First</strong> <strong>Investors</strong> Equity Funds), as of March 31,<br />
2014, the related statements of operations, the statements of changes in net assets,<br />
and the financial highlights for each of the periods indicated thereon. These financial<br />
statements and financial highlights are the responsibility of the Funds’ management.<br />
Our responsibility is to express an opinion on these financial statements and financial<br />
highlights based on our audits.<br />
We conducted our audits in accordance with the standards of the Public Company<br />
Accounting Oversight Board (United States). Those standards require that we plan<br />
and perform the audit to obtain reasonable assurance about whether the financial<br />
statements and financial highlights are free of material misstatement. The Funds are<br />
not required to have, nor were we engaged to perform an audit of the Funds’ internal<br />
control over financial reporting. Our audits included consideration of internal control<br />
over financial reporting as a basis for designing audit procedures that are appropriate<br />
in the circumstances, but not for the purpose of expressing an opinion on the<br />
effectiveness of the Funds’ internal control over financial reporting. Accordingly,<br />
we express no such opinion. An audit includes examining, on a test basis, evidence<br />
supporting the amounts and disclosures in the financial statements. Our procedures<br />
included confirmation of securities owned as of March 31, 2014, by correspondence<br />
with the custodian and brokers. Where brokers have not replied to our confirmation<br />
requests, we have carried out other appropriate auditing procedures. An audit also<br />
includes assessing the accounting principles used and significant estimates made by<br />
management, as well as evaluating the overall financial statement presentation. We<br />
believe that our audits provide a reasonable basis for our opinion.<br />
188
In our opinion, the financial statements and financial highlights referred to above<br />
present fairly, in all material respects, the financial position of the Cash Management<br />
Fund, Government Fund, Investment Grade Fund, Strategic Income Fund,<br />
International Opportunities Bond Fund, Floating Rate Fund, Fund For Income, Total<br />
Return Fund, Equity Income Fund, Growth & Income Fund, Global Fund, Select<br />
Growth Fund, Opportunity Fund, Special Situations Fund and International Fund, as<br />
of March 31, 2014, and the results of their operations, changes in their net assets, and<br />
their financial highlights for the periods presented, in conformity with accounting<br />
principles generally accepted in the United States of America.<br />
Philadelphia, Pennsylvania<br />
May 28, 2014<br />
Tait, Weller & Baker LLP<br />
189
Board Considerations of Advisory Contracts and Fees<br />
(unaudited)<br />
LIMITED DURATION HIGH QUALITY BOND FUND<br />
Consideration of the Investment Advisory Agreement with respect to the <strong>First</strong><br />
<strong>Investors</strong> Limited Duration High Quality Bond Fund<br />
At the February 20, 2014 meeting (the “February Meeting”) of the Board of Trustees<br />
(the “Board”) of the <strong>First</strong> <strong>Investors</strong> Income Funds (the “Trust”), the Board, including a<br />
majority of the Independent Trustees, discussed and approved, for the new <strong>First</strong> <strong>Investors</strong><br />
Limited Duration High Quality Bond Fund (the “New Fund”), the investment advisory<br />
agreement (the “Advisory Agreement”) with <strong>First</strong> <strong>Investors</strong> Management Company,<br />
Inc. (“FIMCO”).<br />
The Trustees were provided with detailed materials relating to the New Fund and<br />
FIMCO in advance of and at the February Meeting. The material factors and conclusions<br />
that formed the basis for the approval of the Advisory Agreement are discussed<br />
below. In addition, the Trustees met in person with FIMCO, Trust counsel, independent<br />
legal counsel to the Independent Trustees (“Independent Legal Counsel”) and others to<br />
receive information on, and discuss the approval of, the Advisory Agreement.<br />
In making their determinations, the Trustees took into account management style,<br />
investment strategies, investment philosophy and process, FIMCO’s past performance,<br />
FIMCO’s personnel that would be serving the New Fund, and prevailing market conditions.<br />
In evaluating the Advisory Agreement, the Trustees also reviewed information<br />
provided by FIMCO, including the terms of the Advisory Agreement and information<br />
regarding fee arrangements, including the structure of the advisory fee, the method of<br />
computing fees, and the frequency of payment of fees. Among other things, the Trustees<br />
also reviewed information comparing the New Fund’s advisory fee and total expenses<br />
with a peer group of other similar funds compiled by Lipper, Inc., an independent<br />
provider of investment company data.<br />
After extensive discussion and consideration among themselves, and with FIMCO, Trust<br />
counsel and Independent Legal Counsel, including during an executive session with<br />
Independent Legal Counsel held the previous day, the Trustees concluded the following<br />
with respect to the New Fund:<br />
• The nature and extent of the investment advisory services to be provided to the New<br />
Fund by FIMCO were consistent with the terms of the Advisory Agreement.<br />
• The prospects for satisfactory investment performance of the New Fund<br />
were reasonable;<br />
• Shareholders of the New Fund may benefit from economies of scale in the<br />
future as assets grow due to breakpoints included in the fee schedule for the<br />
Advisory Agreement;<br />
190
• Total expenses of the New Fund would be capped under an expense limitation<br />
agreement pursuant to which FIMCO or the New Fund’s transfer agent, an affiliate<br />
of FIMCO, will limit total annual operating expenses to a certain level for each<br />
class of shares of the New Fund;<br />
• The cost of services to be provided by FIMCO to the New Fund and the profits to<br />
be realized by FIMCO and its affiliates from their relationship with the New Fund<br />
would be assessed after a reasonable period of New Fund operations; and<br />
• FIMCO may receive certain “fall out” or ancillary benefits by obtaining research<br />
and other services from broker-dealers that execute brokerage transactions for the<br />
New Fund.<br />
* * *<br />
Based on all relevant information and factors, none of which was individually determinative<br />
of the outcome, the Board, including a majority of the Independent Trustees, concluded<br />
that the approval of the New Fund’s Advisory Agreement was in the best interests of<br />
the New Fund and its shareholders and unanimously approved such Agreement.<br />
191
FIRST INVESTORS INCOME FUNDS<br />
FIRST INVESTORS EQUITY FUNDS<br />
Trustees<br />
Susan E. Artmann<br />
Mary J. Barneby<br />
Charles R. Barton, III<br />
Arthur M. Scutro, Jr.<br />
Mark R. Ward<br />
Officers<br />
Derek Burke<br />
President<br />
Marc S. Milgram<br />
Chief Compliance Officer<br />
Joseph I. Benedek<br />
Treasurer<br />
Mark S. Spencer<br />
Assistant Treasurer<br />
Mary C. Carty<br />
Secretary<br />
Carol Lerner Brown<br />
Assistant Secretary<br />
192
Shareholder Information<br />
Investment Adviser<br />
<strong>First</strong> <strong>Investors</strong> Management<br />
Company, Inc.<br />
40 Wall Street<br />
New York, NY 10005<br />
Subadviser<br />
(International Opportunities Bond Fund)<br />
Brandywine Global Investment<br />
Management, LLC<br />
2929 Arch Street<br />
Philadelphia, PA 19104<br />
Subadviser<br />
(Floating Rate Fund and Fund For Income)<br />
Muzinich & Co., Inc.<br />
450 Park Avenue<br />
New York, NY 10022<br />
Subadviser<br />
(Global Fund)<br />
Wellington Management Company, LLP<br />
280 Congress Street<br />
Boston, MA 02210<br />
Subadviser<br />
(Select Growth Fund)<br />
Smith Asset Management Group, L.P.<br />
100 Crescent Court<br />
Dallas, TX 75201<br />
Subadviser<br />
(International Fund)<br />
Vontobel Asset Management, Inc.<br />
1540 Broadway<br />
New York, NY 10036<br />
Underwriter<br />
<strong>First</strong> <strong>Investors</strong> Corporation<br />
40 Wall Street<br />
New York, NY 10005<br />
Custodian<br />
(Income Funds except Strategic Income<br />
Fund and International Opportunities<br />
Bond Fund)<br />
The Bank of New York Mellon<br />
One Wall Street<br />
New York, NY 10286<br />
Custodian<br />
(Strategic Income Fund, International<br />
Opportunities Bond Fund and the<br />
Equity Funds)<br />
Brown Brothers Harriman & Co.<br />
50 Post Office Square<br />
Boston, MA 02110<br />
Transfer Agent<br />
Administrative Data Management Corp.<br />
Raritan Plaza I – 8th Floor<br />
Edison, NJ 08837-3620<br />
Independent Registered Public<br />
Accounting Firm<br />
Tait, Weller & Baker LLP<br />
1818 Market Street<br />
Philadelphia, PA 19103<br />
Legal Counsel<br />
K&L Gates LLP<br />
1601 K Street, N.W.<br />
Washington, D.C. 20006<br />
193
A description of the policies and procedures that the Funds use to vote proxies relating<br />
to a portfolio’s securities is available, without charge, upon request by calling<br />
toll free 1-800-423-4026 or can be viewed online or downloaded from the EDGAR<br />
database on the Securities and Exchange Commission’s (“SEC”) internet website at<br />
http://www.sec.gov. In addition, information regarding how the Funds voted proxies<br />
relating to portfolio securities during the most recent 12-month period ended June 30,<br />
is available, without charge, upon request in writing or by calling 1-800-423-4026<br />
and on the SEC’s internet website at http://www.sec.gov.<br />
The Funds file their complete schedule of portfolio holdings with the SEC on Form<br />
N-Q for the first and third quarters of each fiscal year. The Funds’ Form N-Q is<br />
available on the SEC’s website at http://www.sec.gov; and may also be reviewed<br />
and copied at the SEC’s Public Reference Room in Washington D.C. Information<br />
on the operation of the Public Reference Room may be obtained by calling<br />
1-800-SEC-0330. The schedule of portfolio holdings is available, without charge,<br />
upon request in writing or by calling 1-800-423-4026.<br />
194
NOTES<br />
195
NOTES<br />
196
NOTES<br />
197
IESAR<br />
40 Wall Street<br />
New York, NY 10005