CoreModels - Maryland Virtual High School - Montgomery Blair High ...
CoreModels - Maryland Virtual High School - Montgomery Blair High ...
CoreModels - Maryland Virtual High School - Montgomery Blair High ...
- No tags were found...
Create successful ePaper yourself
Turn your PDF publications into a flip-book with our unique Google optimized e-Paper software.
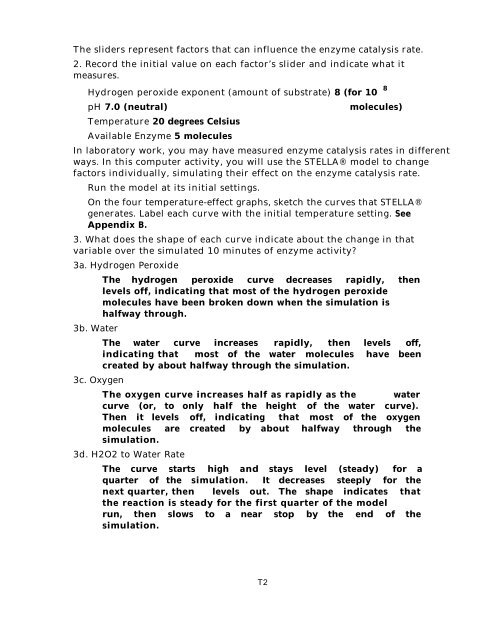
The sliders represent factors that can influence the enzyme catalysis rate.2. Record the initial value on each factor’s slider and indicate what itmeasures.Hydrogen peroxide exponent (amount of substrate) 8 (for 10 8pH 7.0 (neutral)Temperature 20 degrees CelsiusAvailable Enzyme 5 moleculesmolecules)In laboratory work, you may have measured enzyme catalysis rates in differentways. In this computer activity, you will use the STELLA® model to changefactors individually, simulating their effect on the enzyme catalysis rate.Run the model at its initial settings.On the four temperature-effect graphs, sketch the curves that STELLA®generates. Label each curve with the initial temperature setting. SeeAppendix B.3. What does the shape of each curve indicate about the change in thatvariable over the simulated 10 minutes of enzyme activity?3a. Hydrogen Peroxide3b. Water3c. OxygenThe hydrogen peroxide curve decreases rapidly, thenlevels off, indicating that most of the hydrogen peroxidemolecules have been broken down when the simulation ishalfway through.The water curve increases rapidly, then levels off,indicating that most of the water molecules have beencreated by about halfway through the simulation.The oxygen curve increases half as rapidly as the watercurve (or, to only half the height of the water curve).Then it levels off, indicating that most of the oxygenmolecules are created by about halfway through thesimulation.3d. H2O2 to Water RateThe curve starts high and stays level (steady) for aquarter of the simulation. It decreases steeply for thenext quarter, then levels out. The shape indicates thatthe reaction is steady for the first quarter of the modelrun, then slows to a near stop by the end of thesimulation.T2


