STUDENT EXCHANGE PROGRAMS Statistical Report ... - WICHE
STUDENT EXCHANGE PROGRAMS Statistical Report ... - WICHE
STUDENT EXCHANGE PROGRAMS Statistical Report ... - WICHE

You also want an ePaper? Increase the reach of your titles
YUMPU automatically turns print PDFs into web optimized ePapers that Google loves.
Table of Contents<strong>WICHE</strong>’s Student Exchange Program.................................................................................................................................................................... 1Figure 1. Percent Change in Public and Nonpublic High School Graduates, by State, 2008-2009 to 2019-2020..................................................................... 1Professional Student Exchange Program (PSEP).............................................................................................................................................. 2Table 1. Institution and Program Totals, 2012-2013............................................................................................................................................................... 2Table 2. Summary of Enrollments and Support Fees, by Profession......................................................................................................................................... 2Table 3. Student and Support Fee Totals, by State.................................................................................................................................................................. 3Table 4. Enrollment and Support Fees, by Profession.............................................................................................................................................................. 4Table 5. Student Distribution and Support Fee Payments, by Profession.................................................................................................................................. 5• Dentistry.................................................................................................................................................................................................................................5• Medicine ...............................................................................................................................................................................................................................5• Occupational Therapy.............................................................................................................................................................................................................6• Optometry..............................................................................................................................................................................................................................6• Osteopathic Medicine.............................................................................................................................................................................................................7• Pharmacy...............................................................................................................................................................................................................................7• Physical Therapy.....................................................................................................................................................................................................................7• Physician Assistant..................................................................................................................................................................................................................8• Podiatry..................................................................................................................................................................................................................................8• Veterinary Medicine................................................................................................................................................................................................................8Table 6. Receipt of Support Fees, by State and Institution.................................................................................................................................................................... 9Table 7. New and Continuing Students, by Gender and Race/Ethnicity.............................................................................................................................................. 12Return Rates of <strong>WICHE</strong> PSEP Graduates.......................................................................................................................................................................................13Table 8. Return Rates of <strong>WICHE</strong> PSEP Graduates, 2002-2011............................................................................................................................................................ 14Western Regional Graduate Program (WRGP)......................................................................................................................................................... 15Figure 2. Examples of Programs Available through WRGP................................................................................................................................................................. 16Table 9. Five-year Enrollment Summary, New and Continuing Students, 2008-2012.......................................................................................................................... 17Western Undergraduate Exchange (WUE)................................................................................................................................................................. 18Figure 3. WUE Enrollment and Savings (in millions), 2008-2012....................................................................................................................................................... 18Table 10. Fall 2012 Enrollment Summary, New and Continuing Students.......................................................................................................................................... 19Table 11. Five-year Enrollment Summary, New and Continuing Students, 2008-2012........................................................................................................................ 20<strong>WICHE</strong> Internet Course Exchange (ICE)....................................................................................................................................................................... 21Page<strong>WICHE</strong>’s Student Exchange Program
Professional Student Exchange ProgramTable 3. Student and Support Fee Totals, by State, 2012-13Total Fees ReceivedNumber of Total Fees Number of Students Received by Enrolling InstitutionsState Students Sent Paid Public Private Total Public Private TotalAlaska 17 $193,934 0 0 0 $0 $0 $0Arizona 190 4,052,800 3 142 145 90,600 2,439,867 2,530,467California 0 0 4 72 76 90,900 1,274,902 1,365,802Colorado 24 386,400 179 4 183 4,910,700 51,334 4,962,034Hawai’i 56 1,044,702 0 0 0 0 0 0Idaho 1 16,100 3 0 3 43,000 0 43,000Montana 84 2,202,600 4 0 4 35,967 0 35,967Nevada 41 753,836 3 21 24 90,600 254,436 345,036New Mexico 73 1,924,200 4 0 4 86,300 0 86,300North Dakota 42 825,300 15 0 15 281,935 0 281,935Oregon 0 0 36 70 106 781,600 1,035,500 1,817,100South Dakota 0 0 0 0 0 0 0 0Utah 33 694,400 4 0 4 51,334 0 51,334Washington 0 0 82 3 85 2,243,200 32,800 2,276,000Wyoming 117 2,286,803 0 0 0 0 0 0Out of Region n/a n/a 7 22 29 156,500 429,600 586,100TOTALS 678 $14,381,075 344 334 678 $8,862,636 $5,518,439 $14,381,075“Thanks to <strong>WICHE</strong>, I managed to graduate from optometry school debt-free. I was once just a kid from a public school inHawai‘i who had a dream of becoming a doctor, and <strong>WICHE</strong> helped make that dream came true. I am currently in privatepractice in my hometown, Kaimuki, and have the pleasure of providing much needed healthcare in my home state. I amforever grateful to the <strong>WICHE</strong> program. I encourage legislators to continue supporting students to reach their professionalgoals and to provide Hawai‘i with the healthcare services it needs for the future.”– Richard, Hawai‘i resident, Class of 2011,Southern California College of Optometrywww.wiche.edu/psep<strong>Statistical</strong> <strong>Report</strong>: 2012-13 3
DENTISTRYProfessional Student Exchange ProgramTable 5. Student Distribution and Support Fee Payments, by Profession, 2012-13Total FeesReceiving Schools*Total Paid byOut ofNumber SendingSending State ATSU MDWST LLU UCLA UCSF UOP USC WUHS COLO UNLV OHSU WASH Region Students StateAlaska 1 2 3 $46,800Arizona 9 9 1 1 5 1 14 2 3 45 1,068,600Hawai’i 1 2 3 2 8 187,200Montana 1 1 4 3 9 210,600New Mexico 6 3 1 16 1 11 38 889,200North Dakota 1 2 1 5 9 210,600Wyoming 1 3 4 2 10 187,200TOTALS 16 12 1 0 1 8 3 0 42 0 13 8 18 122 $2,800,200MEDICINEReceiving Schools*Total FeesTotal Paid bySending Number SendingState AZ-TUC AZ-PHX LLU STAN UCB/SF UCD UCI UCLA UCSD UCSF USC COLO HAW NEV UNM UND OHSU UTAH Students StateMontana 1 1 1 1 1 8 2 1 5 4 25 $724,800Wyoming 1 1 1 1 2 6 135,900TOTALS 2 1 1 0 0 0 0 0 1 1 0 9 0 3 2 5 6 0 31 $860,700* See Table 6, pp. 9-11, for full names of institutions.“<strong>WICHE</strong> gave me access to some of the top medical schools in the western U.S. I was an EMT in Fremont County beforeI went to medical school, and I’ve matched into an emergency medicine residency program! The support of the WyomingLegislature through <strong>WICHE</strong>’s PSEP made it possible for me to afford medical school and pursue a career that will help usbring our family back home for good. Thank you, Wyoming, for your support. And Erik, the baby, thanks you too!”– Alicia, Wyoming resident, Class of 2015,University of Arizona, College of Medicine – Phoenixwww.wiche.edu/psep<strong>Statistical</strong> <strong>Report</strong>: 2012-13 5
Professional Student Exchange ProgramTable 5. Student Distribution and Support Fee Payments, by Profession, 2012-13 (continued)OCCUPATIONAL THERAPYReceiving Schools*Total FeesTotal Paid byTOURO-Number SendingSending State ATSU MDWST LLU SMU USC ISU NV UNM WNMU UND PACU USD UTAH EWU UPS WASH Students StateAlaska 0 $0Arizona 10 8 1 19 172,200Hawai’i 1 1 3 1 6 65,600Montana 1 1 2 4 32,800Wyoming 2 1 2 2 1 1 1 10 98,400TOTALS 12 10 1 0 0 0 1 0 2 2 5 0 0 3 3 0 39 $369,000OPTOMETRYReceiving Schools*Total FeesTotal Paid byOut of Number SendingSending State MDWST SCCO WUHS PACU Region Students StateAlaska 1 1 2 $32,200Arizona 11 7 2 20 322,000Colorado 8 1 8 7 24 386,400Hawai’i 1 6 1 3 11 177,100Idaho 1 1 16,100Montana 4 4 64,400Nevada 1 5 6 96,600New Mexico 0 0North Dakota 3 22 2 27 434,700Utah 2 6 4 12 193,200Washington 0 0Wyoming 9 6 15 241,500TOTALS 22 35 1 55 9 122 $1,964,200* See Table 6, pp. 9-11, for full names of institutions.“<strong>WICHE</strong> gave me the financial means to attend veterinary school.It also gave me preferential admission, and I wasn’t requiredto travel for any interviews, which saved me time and expensein travel and lost wages. I would like to thank the taxpayers ofMontana for supporting me through <strong>WICHE</strong>. What I will bringback in veterinary service to my home state will be worth everypenny. <strong>WICHE</strong>’s PSEP is a good investment for the State ofMontana.”– Ryan, Montana resident, Class of 2016,Oregon State University, College of Veterinary Medicine“The cost of dental school is prohibitive for thoseof us without the benefit of in-state tuition. ThePSEP program has helped me to reach my goalsby easing the financial burden of attendingschool, and by giving me a leg up on the highlycompetitive application process. Thanks to PSEP, Iwill be able to return to the home I love in Alaskawith a world-class education and the chance toserve my community.”– Ray, Alaska resident, Class of 2015,Oregon Health and Science University, School of Dentistry6www.wiche.edu/psep<strong>WICHE</strong>’s Student Exchange Program
Professional Student Exchange ProgramTable 5. Student Distribution and Support Fee Payments, by Profession, 2012-13 (continued)OSTEOPATHIC MEDICINEReceiving Schools*Total FeesTotal Paid byATSU TOURO- TOURO- Out of Number SendingSending State MESA MDWST CA WUHS RVU NV PNWHS Region Students StateArizona 1 42 1 2 1 2 49 $920,000Montana 1 3 3 7 120,000Washington 0 0Wyoming 1 3 2 1 7 140,000TOTALS 3 48 1 4 0 5 0 2 63 $1,180,000“What a blessing <strong>WICHE</strong> has been for me andmy family as I pursue my medical training inpodiatric medicine. It also gave me the timeto volunteer in a homeless clinic setting. Thepeople I had the privilege to serve were warmand grateful and their kindness changed me.In addition, <strong>WICHE</strong> PSEP support has playeda critical role in helping me manage financialmatters in my home. I want to extend myappreciation to the State of Utah for offeringthis program to its residents.”– John, Utah resident, Class of 2014,Midwestern University, Podiatric MedicinePHARMACYReceiving Schools*Total FeesTotal Paid bySending UH Number SendingState ARIZ MDWST UCSF UOP USC WUHS COLO HILO ISU MONT RUHS UNM NDSU OSU PACU WASH WSU WYO Students StateAlaska 1 3 2 1 7 $49,700Hawai’i 1 1 1 3 21,300Nevada 10 3 13 111,236TOTALS 0 0 1 1 0 0 1 0 0 3 10 0 0 5 0 2 0 0 23 $182,236PHYSICAL THERAPYReceiving Schools*Total FeesTotal Paid bySending TOURO- Number SendingState ATSU CSF CHAP LLU MSMC SMU UOP USC WUHS COLO REGIS ISU MONT NV UNM UND PACU UTAH UPS EWU WASH Students StateAlaska 1 1 1 1 4 $51,334Hawai’i 4 3 1 1 1 5 15 203,502Wyoming 1 3 1 8 1 4 1 19 242,003TOTALS 1 0 4 0 0 0 3 2 1 1 4 1 1 0 0 8 7 4 0 1 0 38 $496,839* See Table 6, pp. 9-11, for full names of institutions.www.wiche.edu/psep<strong>Statistical</strong> <strong>Report</strong>: 2012-13 7
Professional Student Exchange ProgramTable 5. Student Distribution and Support Fee Payments, by Profession, 2012-13 (continued)PHYSICIAN ASSISTANTReceiving Schools*Total Total FeesTOURO- Number Paid bySending State ATSU MDWST LLU SMU USC WUHS COLO RRCC ISU NV PACU OHSU UTAH WASH Students Sending StateAlaska 0 $0Arizona 4 4 1 1 10 160,000Nevada 3 2 1 1 7 96,000Wyoming 2 1 2 3 2 2 1 2 15 224,000TOTALS 6 4 0 1 0 2 2 3 2 5 3 1 0 3 32 $480,000PODIATRYReceiving Schools*Total Total FeesNumber Paid bySending State MDWST SMU Students Sending StateAlaska 1 1 $13,900Montana 0 0Utah 6 2 8 111,200Wyoming 2 2 27,800TOTALS 8 3 11 $152,900VETERINARY MEDICINEReceiving Schools*Total Total FeesNumber Paid bySending State UCD CSU OSU WSU Students Sending StateArizona 32 3 12 47 $1,410,000Hawai’i 11 2 13 390,000Montana 18 2 15 35 1,050,000Nevada 8 2 5 15 450,000New Mexico 25 1 9 35 1,035,000North Dakota 5 1 6 180,000Utah 2 2 9 13 390,000Wyoming 20 1 12 33 990,000TOTALS 0 121 11 65 197 $5,895,000* See Table 6 or www.wiche.edu/psep for full names of institutions.8www.wiche.edu/psep“As a first-generation college student, it has alwaysbeen a constant struggle of what I can and cannotafford. With tuition costs increasing every year,taking on the burden of student loan debt is daunting.Thanks to the generosity of programs such as<strong>WICHE</strong>’s PSEP, I have the opportunity to pursue acareer in pharmacy. I encourage my home state ofNevada to continue supporting students through PSEP, so that futuregenerations can also follow their dreams without taking on excessivefinancial burden.”– Mikael, Nevada resident, Class of 2013,Roseman University of Health Sciences, Pharmacy“As an Arizona native and graduate of Arizona StateUniversity, I have an intangible love for my homestate. I worked full time throughout my undergraduatestudies in order to support myself. I’m elated to beable to continue my education in my home statethanks to the support I have through <strong>WICHE</strong>’s PSEP.It allows me to concentrate on my medical educationwithout having to worry about the incredible financial burden thatI might otherwise incur. I look forward to staying in the gloriousGrand Canyon State and taking care of my fellow Arizonans whilepracticing emergency medicine.”– Matthew, Arizona resident, Class of 2013,Midwestern University, College of Osteopathic Medicine<strong>WICHE</strong>’s Student Exchange Program
Professional Student Exchange ProgramTable 6. Receipt of Support Fees, by State and Institution, 2012-13ARIZONANumber Support FeesInstitution of Students by FieldPUBLICUniversity of Arizona, Phoenix (ARIZ-PHX)Medicine 1 $30,200Institution Total 1 $30,200University of Arizona, Tucson (ARIZ-TUC)Medicine 2 $60,400Pharmacy 0 0Institution Total 2 $60,400Public Institution Total 3 $90,600PRIVATEA.T. Still University Mesa Campus (ATSU MESA)Dentistry 16 $374,400Occupational Therapy 12 77,900Osteopathic Medicine 3 60,000Physical Therapy 1 14,667Physician Assistant 6 96,000Institution Total 38 $622,967Midwestern University (MDWST)Dentistry 12 $269,100Occupational Therapy 10 98,400Optometry 22 354,200Osteopathic Medicine 48 920,000Pharmacy 0 0Physician Assistant 4 64,000Podiatry 8 111,200Institution Total 104 $1,816,900Private Institution Total 142 $2,439,867ARIZONA TOTAL 145 $2,530,467CALIFORNIAPUBLICCalifornia State University, Fresno (CSF)Physical Therapy 0 $0Institution Total 0 $0CALIFORNIA (continued)Number Support FeesInstitution of Students by FieldUniversity of California, Davis (UCD)Medicine 0 $0Veterinary Medicine 0 0Institution Total 0 $0University of California, Irvine (UCI)Medicine 0 $0Institution Total 0 $0University of California, Los Angeles (UCLA)Dentistry 0 $0Medicine 0 0Institution Total 0 $0University of California, San Diego (UCSD)Medicine 1 $30,200Institution Total 1 $30,200University of California, San Francisco (UCSF)Dentistry 1 $23,400Medicine 1 30,200Pharmacy 1 7,100Institution Total 3 $60,700Public Institution Total 4 $90,900PRIVATEChapman University (CHAP)Physical Therapy 4 $55,001Institution Total 4 $55,001Loma Linda University (LLU)Dentistry 1 $23,400Medicine 1 30,200Occupational Therapy 1 0Physical Therapy 0 0Physician Assistant 0 0Institution Total 3 $53,600Mount St. Mary’s College (MSMC)Physical Therapy 0 $0Institution Total 0 $0CALIFORNIA (continued)Number Support FeesInstitution of Students by FieldSamuel Merritt University (SMU)Occupational Therapy 0 $0Physical Therapy 0 0Physician Assistant 1 16,000Podiatry 3 41,700Institution Total 4 $57,700Southern California College of Optometry (SCCO)Optometry 35 $563,500Institution Total 35 $563,500Stanford University (STAN)Medicine 0 $0Institution Total 0 $0Touro University - California (TOURO-CA)Osteopathic Medicine 1 $20,000Institution Total 1 $20,000University of the Pacific (UOP)Dentistry 8 $226,200Pharmacy 1 7,100Physical Therapy 3 49,500Institution Total 12 $282,800University of Southern California (USC)Dentistry 3 $70,200Medicine 0 0Occupational Therapy 0 0Pharmacy 0 0Physical Therapy 2 29,334Physician Assistant 0 0Institution Total 5 $99,534Western University of Health Sciences (WUHS)Dentistry 0 $0Optometry 1 16,100Osteopathic Medicine 4 80,000Pharmacy 0 0Physical Therapy 1 14,667Physician Assistant 2 32,000Institution Total 8 $142,767Private Institution Total 72 $1,274,902CALIFORNIA TOTAL 76 $1,365,802www.wiche.edu/psep<strong>Statistical</strong> <strong>Report</strong>: 2012-13 9
Professional Student Exchange ProgramTable 6. Receipt of Support Fees by State and Institution, 2012-13 (continued)10COLORADONumber Support FeesInstitution of Students by FieldPUBLICColorado State University (CSU)Veterinary Medicine 121 $3,615,000Institution Total 121 $3,615,000Red Rocks Community College (RRCC)Physician Assistant 3 $48,000Institution Total 3 $48,000University of Colorado Denver (COLO)Dentistry 42 $971,100Medicine 9 226,500Pharmacy 1 7,100Physical Therapy 1 11,000Physician Assistant 2 32,000Institution Total 55 $1,247,700Public Institution Total 179 $4,910,700PRIVATERegis University (REGIS)Physical Therapy 4 $51,334Institution Total 4 $51,334Rocky Vista UniversityOsteopathic Medicine 0 $0Institution Total 0 $0Private Institution Total 4 $51,334COLORADO TOTAL 183 $4,962,034HAWAI’IUniversity of Hawai’i at Manoa (HAW)Medicine 0 $0Institution Total 0 $0University of Hawai’i at Hilo (HI-HILO)Pharmacy 0 $0Institution Total 0 $0HAWAI’I TOTAL 0 $0IDAHONumber Support FeesInstitution of Students by FieldIdaho State University (ISU)Occupational Therapy 0 $0Pharmacy 0 0Physical Therapy 1 11,000Physician Assistant 2 32,000Institution Total 3 $43,000IDAHO TOTAL 3 $43,000MONTANAUniversity of Montana (MONT)Pharmacy 3 $21,300Physical Therapy 1 14,667Institution Total 4 $35,967MONTANA TOTAL 4 $35,967NEVADAPUBLICUniversity of Nevada, Reno (NEV)Medicine 3 $90,600Institution Total 3 $90,600University of Nevada, Las Vegas (UNLV)Dentistry 0 $0Institution Total 0 $0Public Institution Total 3 $90,600PRIVATETouro University, Nevada (TOURO-NV)Occupational Therapy 1 $20,500Osteopathic Medicine 5 80,000Physical Therapy 0 0Physician Assistant 5 64,000Institution Total 11 $164,500Roseman University of Health Sciences (RUHS)Pharmacy 10 $89,936Institution Total 10 $89,936Private Institution Total 21 $254,436NEVADA TOTAL 24 $345,036www.wiche.edu/psepNEW MEXICONumber Support FeesInstitution of Students by FieldUniversity of New Mexico (UNM)Medicine 2 $45,300Occupational Therapy 0 0Pharmacy 0 0Physical Therapy 0 0Institution Total 2 $45,300Western New Mexico University (WNMU)Occupational Therapy 2 41,000Institution Total 2 $41,000NEW MEXICO TOTAL 4 $86,300NORTH DAKOTANorth Dakota State University (NDSU)Pharmacy 0 $0Institution Total 0 $0University of North Dakota (UND)Medicine 5 $151,000Occupational Therapy 2 24,600Physical Therapy 8 106,335Institution Total 15 $281,935NORTH DAKOTA TOTAL 15 $281,935OREGONPUBLICOregon State University (OSU)Pharmacy 5 $35,500Veterinary Medicine 11 330,000Institution Total 16 $365,500Oregon Health & Science University (OHSU)Dentistry 13 $234,000Medicine 6 166,100Physician Assistant 1 16,000Institution Total 20 $416,100Public Institution Total 36 $781,600<strong>WICHE</strong>’s Student Exchange Program
Professional Student Exchange ProgramTable 7. New and Continuing Students,by Gender and Race/Ethnicity, 2012-13GenderRace/EthnicityState Total Male Female AA BL LA NA WH UKAlaska 17 8 9 17Arizona 190 82 108 25 2 13 1 147 2Colorado 24 11 13 4 1 16 3Hawai’i 56 15 41 50 4 2Idaho 1 1 1Montana 84 28 56 1 80 3Nevada 41 13 28 1 11 29New Mexico 73 32 41 2 17 1 46 7North Dakota 42 13 29 39 3Utah 33 23 10 1 1 25 6Washington 0Wyoming 117 52 65 1 1 109 6TOTAL 678 278 400 83 2 34 3 478 78NOTE: Abbreviations: AA = Asian American; BL = black; LA = Latino/a; NA = Native American; WH = white;UK = unknown. Race/ethnicity information is self-reported by applicants for state certification.“<strong>WICHE</strong>’s PSEP has been a great blessing to my optometrycareer. My home state doesn’t have an optometry program,so <strong>WICHE</strong> was the only affordable option. The financial reliefit has provided will also enable me to serve Third Worldcountries on missions earlier in my career. I encourage ourlegislature to continue to support this incredible program.North Dakota’s participation in <strong>WICHE</strong>’s PSEP has not onlyeducated one more optometrist to serve the state, but it willalso provide eye care to many underserved people aroundthe world with the service trips I will be able to take. Thankyou, North Dakota, for investing in your future healthcareprofessionals!”– Chantel, North Dakota resident, Class of 2014,Pacific University, College of Optometry“For many years <strong>WICHE</strong>’s PSEP has supportedover 10 percent of our graduate occupationaltherapy students to gain their OT degrees andpractice credentials. The program has enabledstudents who may otherwise not been able toafford graduate study to advance their careersand address society’s health needs for higherquality and more independent living. <strong>WICHE</strong> PSEP studentshave enhanced the diversity of our student body and thusstrengthened our program and profession to provideeffective services to a wider variety of clients.”– John White, Program Director,School of Occupational Therapy, Pacific University“I am from New Mexico and am enrolled in ATSU’s dental program through <strong>WICHE</strong>’s PSEP. In addition to being one of the states that does not havea dental school, New Mexico is ranked 49th in the nation for the number of dentists per capita. New Mexico needs dentists who are willing to workin underserved areas to provide optimal patient care. ATSU graduates culturally competent and community-responsive dentists – exactly what NewMexico needs. <strong>WICHE</strong>’s PSEP is essential to making it affordable for New Mexican students to attend dental school and return to serve fellow NewMexicans. I am grateful to <strong>WICHE</strong> for helping make dental school possible.”– Elizabeth, New Mexico resident, Class of 2015,A. T. Still University, Arizona School of Dentistry and Oral Health12www.wiche.edu/psep<strong>WICHE</strong>’s Student Exchange Program
Professional Student Exchange ProgramReturn Rates of <strong>WICHE</strong> PSEP Graduates, 2002-2011Are states still getting a good return on their PSEP investment dollar? Yes! Infact, states’ return rates have improved considerably since last measured fiveyears ago.In fall 2012, states that supported students through the Professional StudentExchange Program collected return rate data on their PSEP graduates. Theaverage return rate for all reporting <strong>WICHE</strong> states is now 68 percent (up from59 percent in 2006). Return rates for payback states are still the highest, nowaveraging 85 percent and ranging as high as 89 percent, depending on thestate and the profession; five years ago, 74 percent of graduates from paybackstates returned home. Return rates for honor system states have improved too.They now average 52 percent, compared to only 39 percent five years ago.During the period for which data was collected, five states contractually requiredtheir PSEP graduates to return and serve their home state residents: Arizona,Colorado, New Mexico, Nevada, and Washington (these are the “contractualpayback states” listed in Table 8. Alaska, Idaho, Montana, North Dakota,Utah, and Wyoming are listed as “honor system states”:they encourage their graduates to return to their homestate but do not contractually require them to do so. In2011, the Wyoming Legislature approved a service paybackrequirement that will be implemented for new studentsin all healthcare professions (except veterinary medicine)enrolling in fall 2013. The State of Hawai’i has also approvedlegislation for a payback obligation for its future PSEPgraduates, but the exact terms and implementation timelineare still being determined. Alaska’s participation in PSEPremains distinctive: to make the benefits of PSEP available toits residents in the absence of state funding, Alaska treats thesupport fee as a loan to each PSEP student. Graduates mustrepay the loan, whether or not they return to Alaska.Given the increased reliability of data, <strong>WICHE</strong> asked statesto collect the return rate data over a 10-year period forthe majority of the healthcare professions. Table 8 gives a“snapshot” in time of PSEP alumni who graduated between2002 and 2011 and who were licensed or practicing intheir home state as of 2012. Graduates who had fulfilledtheir practice obligations in their home state earlier werealso counted as returned. Our return rates are conservative;payback states that measure return rates over a longertimeframe will demonstrate higher return rates thanshown in our calculations. This is especially true for fields where graduatesmay be completing a residency, internship, or clinical experience, or may beon deferment for other reasons, though they will ultimately return to servetheir state at a later date. A few dentistry or veterinary medicine graduateshad notified their home state that they were still in residency; these were notcounted in the 2012 pool of graduates but will be counted in future years oncethey complete their training.All allopathic and osteopathic medicine graduates are required to completethree- to four-year residencies. Some new physicians complete their residenciesin state, while others go elsewhere, though the latter may plan to return totheir home state at a later date. For these professions <strong>WICHE</strong> counted PSEPalumni who graduated between 2002 and 2006, in order to allow time forthem to complete their residencies and set up practice in their home state.We hope this information will prompt our member states to consider:• Establishing a service payback requirement if your statedoes not currently require one. Although there is anadministrative cost to tracking graduates, it may be in thestate residents’ best interest to stimulate higher return rates.• Creating or increasing rural or underserved incentives, suchas loan repayment programs that will encourage graduatesin the healthcare fields to return to their home state andwill make it affordable for them to live andwork in these areas.• Using repayment monies paid bynonreturning graduates to fund loanrepayment incentives for graduates whoreturn to their home state to practice inrural and underserved areas (for states withservice payback requirements).Policies for student eligibility and graduateservice payback requirements vary by <strong>WICHE</strong>state. To learn more, see the appendices inour updated PSEP Administrative Manual, available online atwww.wiche.edu/info/publications/PSEP_adminManual.pdf.For any questions you might have about <strong>WICHE</strong> PSEP returnrate data, please call <strong>WICHE</strong>’s Student Exchange Programdirector at 303.541.0214.www.wiche.edu/psep<strong>Statistical</strong> <strong>Report</strong>: 2012-13 13
Professional Student Exchange ProgramTable 8. Return Rates of PSEP Graduates, by State and Profession5-year D.O. and M.D. Rates (2002-06) and 10-year Rates for All Other Professions (2002-11)Total NumberNumber Returning PercentStudents to State ReturningAlaskaDentistry 16 13 81%Occupational Therapy 5 3 60Optometry 3 0 0Pharmacy 10 5 50Physical Therapy 19 10 53Physician Assistant 3 2 67Podiatry 0 0 0Alaska TOTAL 56 33 59%Arizona*Dentistry 115 88 77%Occupational Therapy 49 44 90Optometry 52 43 83Osteopathic Medicine ** 20 12 60Physician Assistant 83 77 93Veterinary Medicine 157 132 84Arizona TOTAL 496 396 83%Colorado*Optometry 62 54 87%Colorado TOTAL 62 54 87%Hawai’iDentistry 30 20 67%Occupational Therapy 23 18 78Optometry 23 19 83Pharmacy 60 42 70Physical Therapy 55 37 67Veterinary Medicine 27 11 41Hawaii TOTAL 218 147 67%IdahoOptometry 22 9 41%Idaho TOTAL 22 9 41%Total NumberNumber Returning PercentStudents to State ReturningMontanaDentistry 17 11 65%Medicine ** 31 12 39Occupational Therapy 9 4 44Optometry 12 7 58Osteopathic Medicine ** 4 2 50Podiatry 0 0 0Veterinary Medicine 86 60 70Montana TOTAL 159 96 60%Nevada*Optometry 22 18 82%Pharmacy 39 33 85Physician Assistant 24 22 92Veterinary Medicine 38 36 95Nevada TOTAL 123 109 89%New Mexico*Dentistry 78 72 92%Veterinary Medicine 90 75 83New Mexico TOTAL 168 147 88%North DakotaDentistry 29 12 41%Optometry 59 12 20Veterinary Medicine 13 7 54North Dakota TOTAL 101 31 31%UtahOptometry 30 20 67%Podiatry 9 7 78Veterinary Medicine 57 39 68Utah TOTAL 96 66 69%Washington*Optometry 27 23 85%Osteopathic Medicine ** 5 3 60Washington TOTAL 32 26 81%Total NumberNumber Returning PercentStudents to State ReturningWyomingDentistry 44 27 61%Medicine ** 27 2 7Occupational Therapy 11 1 9Optometry 54 17 31Osteopathic Medicine ** 5 2 40Physical Therapy 65 21 32Physician Assistant 14 6 43Podiatry 4 0 0Veterinary Medicine 67 30 45Wyoming TOTAL 291 106 36%<strong>WICHE</strong> Return Rates by FieldDentistry 329 243 74%Medicine ** 58 14 24Occupational Therapy 97 70 72Optometry 366 222 61Osteopathic Medicine ** 34 19 56Pharmacy 109 80 73Physical Therapy 139 68 49Physician Assistant 124 107 86Podiatry 13 7 54Veterinary Medicine 535 390 73TOTAL for all <strong>Report</strong>ing<strong>WICHE</strong> PSEP States 1,804 1,220 68%TOTAL for ContractualPayback States 861 732 85%TOTAL for Honor SystemStates 943 488 52%IMPORTANT: Return rates reported by state offices may vary from <strong>WICHE</strong> calculations, due todifferent timeframes over which the return is measured.* Contractual payback states during time periods measured.** Graduates of allopathic and osteopathic medical programs are required to do residenciesof three years or more after graduation. Residencies can be located outside of the graduate’shome state. In order to give residents time to return to their home state to practice, we areusing return data for 2002-2006 for graduates of allopathic and osteopathic medicine.14www.wiche.edu/psep<strong>WICHE</strong>’s Student Exchange Program
Western Regional Graduate ProgramThe Western Regional Graduate Program (www.wiche.edu/wrgp) is anexceptional educational resource for the West, allowing master’s, graduatecertificate, and Ph.D. students who are residents of the 15 participating statesto enroll in 276 high-quality programs at 52 institutions and pay residenttuition. In fall 2012 more than 1,000 students enrolled through WRGP andsaved an estimated $15.2 million in tuition overall – more than $15,000 perstudent, on average. This spring approximately 40 new graduate programswill be added, creating more opportunities for students from our Westernstates.WRGP is a tuition-reciprocity arrangement; students pay resident tuition andcan enroll directly in the program through WRGP. They are not dependentupon the approval of their home state to participate because the home statedoes not provide funding for each student. This represents a tremendousopportunity for <strong>WICHE</strong> states to share distinctive programs (and the facultywho teach them) and build their workforce in a variety of disciplines,particularly healthcare.If you know of a particular program that would be a good candidatefor the WRGP network, have them contact the director of the StudentExchange Program, so that we can contact them directly when the nextrequest for proposals is released in fall 2013. Graduate deans, provosts,and chief academic officers at all public institutions and systems inthe <strong>WICHE</strong> region will be notified of the deadline and the process forsubmitting new programs.To be eligible for WRGP, programs that aren’t related to health mustbe “distinctive” or respond to a significant workforce need. Healthcarerelatedprograms are not subject to the distinctiveness criteria, butmust be of high quality. <strong>WICHE</strong> is particularly interested in reviewingnominations for high-need and programs and those in emerging fields.These include professional science master’s degrees and graduate certificateprograms, as well as graduate degrees in fields such as microtechnology andnanotechnology; green building and building energy conservation; new mediaand communications; biotechnology and bioinformatics; computer and cybersecurity; alternative energy technology; and homeland security. Visitwww.wiche.edu/wrpg for more information.“A DNP program is not available in my home state of Nevada, whichhas been one of the hardest hit by the economic crisis. The Universityof Utah’s ‘distance option’ and the resident WRGP tuition rate allowedme to consider furthering my education. Now I’m pursuing my dream ofbecoming a pediatric nurse practitioner and making a difference in thelives of the kids of Nevada. I am a first-generation college graduate inmy family, so years ago I never would have dreamed that I would now bepreparing to receive a doctorate. Thank you!”– Angela, Nevada resident, Class of 2015,University of Utah, Doctorate of Nursing Practicewww.wiche.edu/wrgp<strong>Statistical</strong> <strong>Report</strong>: 2012-13 15
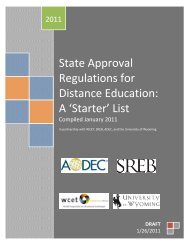
Western Regional Graduate ProgramIf a healthcare profession is not offered through PSEP, WRGP is an excellentoption, offering some 95 healthcare-related programs, including those ingraduate nursing, public health, mental health and psychology, audiology andspeech pathology, and biomedical informatics. WRGP even offers advanceddegrees to train future faculty members, including a doctorate in occupationaltherapy and a master’s in dental hygiene.GlobalSupply ChainManagement(M.S.)University of AlaskaAnchorageOceanography(M.S./Ph.D.)University of Hawai’i at ManoaWRGP is also an incredible resource for graduateslooking for distinctive, highly specialized programsin business, education, liberal arts, and the sciences –Dental Hygiene (M.S.)Eastern WashingtonUniversityEducation - VisuallyImpaired Learner (M.S.)Portland State University Deaf Education(M.S.)Idaho State UniversityCoastal andWatershedScienceandPolicy (M.S.)California StateUniversity,Monterey BayHotel Administration(M.S.)University of Nevada,Las VegasFigure 2. Examples of ProgramsAvailable through WRGPImmunology and InfectiousDiseases (M.S./Ph.D.)Montana State University, BozemanFood Safetyand Quality(M.F.S.Q.)Utah State UniversityHuman LanguageTechnology (M.S.)University ofArizonaInfrared Astrophysics(M.S./Ph.D.)University of WyomingAnimal Reproduction andBiotechnology Laboratory(M.S./Ph.D.)Colorado State UniversityOptical Science andEngineering (M.A./Ph.D.)University of New MexicoClinical LaboratoryScience (M.S.)University ofNorth DakotaHealth Informatics (M.S.)Dakota State Universityprograms that may not be available in the student’s home state. The mapbelow shows some examples of programs offered through WRGP.Check our website in spring 2013 and see the 40 new programs thatwill be available through the WRGP network, effective for fall 2013enrollment.“Living in a semirural area in NorthernUtah, there are few options for graduatenursing education. The University ofArizona and <strong>WICHE</strong>’s WRGP have allowedme to study in my home state and doclinical rotations in the area where I hopeto serve. There is no better way to assist my communitythan to learn from their clinical needs and put them atthe forefront of my future practice. I’d like to thank WRGPand the U of A for making my studies affordable. WithoutWRGP, I wouldn’t be able to pursue my career dreams. I lookforward to giving back by serving my home community!”– Elizabeth, Utah resident, Class of 2013,University of Arizona, Doctor of Nursing Practice (DNP) -Family Nurse Practitioner“As a first-year partner program in <strong>WICHE</strong>’sWRGP, we have been pleasantly surprisedby the number of inquiries and subsequentapplicants we have received to our master ofscience in communication disorders program.WRGP has enhanced our recruitment ofoutstanding applicants. The first recipientsremarked that the award has enabled them to continue withtheir graduate education at their institution of choice.”– Robbie Jackson, Graduate Program Director,Communications Disorders Department,Eastern Washington University16www.wiche.edu/wrgp<strong>WICHE</strong>’s Student Exchange Program
Western Regional Graduate ProgramTable 9. Five-year Enrollment Summary, New and Continuing Students, 2008-20122008 2009 2010 2011 2012State (Number of Programs) Received Sent Received Sent Received Sent Received Sent Received SentAlaska (7) 13 22 17 23 10 25 14 19 15 27Arizona (40) 33 32 56 41 121 46 199 53 235 57California (8) 0 0 0 67 1 153 2 224 5 269Colorado (73) 107 47 134 45 199 56 210 67 330 60Hawai’i (12) 24 10 36 13 41 16 49 17 47 24Idaho (12) 8 36 8 37 7 48 21 56 35 72Montana (13) 8 22 13 25 22 31 45 35 26 47Nevada (7) 7 16 20 19 21 24 23 31 18 35New Mexico (23) 36 24 38 34 41 44 62 46 31 55North Dakota (8) 6 9 22 8 7 11 9 15 4 14Oregon (10) 51 37 35 43 66 53 24 84 79 78South Dakota (8) 5 6 5 8 4 9 10 20 8 19Utah (34) 39 31 56 35 91 42 118 58 119 49Washington (16) 44 79 57 84 44 97 71 92 54 154Wyoming (5) 13 23 5 20 6 26 2 42 2 48TOTAL (276) 394 394 502 502 681 681 859 859 1,008 1,008“Washington State does not have a professional program for teachers of children with visual impairments. Because this is a unique educational niche, there areonly a handful of programs in the nation. Not every university or every state can afford to support teacher preparation programs in sensory disabilities because theprograms are typically small and don’t always draw enough students to be broadly cost-effective. Most students who embark on their master’s or doctoral studiesin the field of visual impairments and blindness are actually doing so as a second career. As a full-time teacher with a family and a mortgage, I would not havebeen able to return to school to pursue either my master’s or my doctoral studies without WRGP’s support. WRGP is a critical and cost-effective way of sharingresources and ensuring potential teachers have access to high-quality training and education. That, in turn, ensures that schools, parents, and students in the Westhave access to teachers of children with visual impairments.”– Kathryn, Washington resident, Class of 2014,University of Northern Colorado, Special Education-Low Prevalence Disabilitieswww.wiche.edu/wrgp<strong>Statistical</strong> <strong>Report</strong>: 2012-13 17
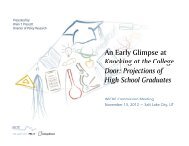
Western Undergraduate ExchangeThe Western Undergraduate Exchange (www.wiche.edu/wue), based ona regional tuition-reciprocity agreement forged in 1987, enables studentsfrom <strong>WICHE</strong> states to enroll in participating two- and four-year publicinstitutions at 150 percent of the enrolling institutions’ resident tuition. WUEis the largest program of its kind in the nation. Since the first exchangesbegan in 1988, WUE has provided <strong>WICHE</strong> students and their parents withdiscounts on some 360,000 annual tuition bills – saving them, overall,almost $2 billion.The program continues to grow. In 2012-13 more than 31,000 WUEstudents saved $235.8 million: an average of almost $7,600 each. Figure 3below shows the continued growth of the program over the past five years.Table 11 shows the number of WUE students received and sent from eachstate over the last five years.Students can choose from 146 participating WUE institutions. NorthlandPioneer College (AZ), University of Hawai‘i Maui College, and GreatFalls College (MT) are WUE’s newest members. <strong>WICHE</strong> encouragesnonparticipating institutions to consider joining the WUE network as a toolto meet their recruitment and enrollment goals.In spring 2012 <strong>WICHE</strong> staff surveyed WUE institutions; approximately 80percent responded. The majority of institutions (72 percent) planned tomaintain approximately the same number of WUE seats in academic year2012. Twenty-seven institutions planned to increase their participation, andthree planned to decrease it. California, Colorado, Oregon, and Washingtonare the most popular states for WUE recruitment. The majority of institutions(72 percent) make all their majors available at the WUE rate, and 24 percentmake most of their majors available. Two of the most commonly excludedprograms are nursing and dental hygiene, due to high demand by in-stateresidents. Twenty-one percent of institutions use WUE as a merit scholarshipand 56 percent automatically award the discounted rate to applicants froma <strong>WICHE</strong> state. Most WUE institutions (89 percent) offer the WUE rate totransfer students.Institutions like WUE because they can attract high-caliber students,maximize their student housing capacity, increase student diversity, andgive students an affordable education in their major (which, for students, isespecially important if the program is not offered in their home state).“Being from Alaska, I’ve been around boats and the water my whole life. Ilooked into Cal Maritime for maritime studies and didn’t think my family couldafford it, until we found out about the WUE scholarship. It was the decidingfactor in making my education at Cal Maritime possible. Thanks to WUE, I’llget to fulfill my dream of working on the water anywhere in the world.”– Sanford, Alaska resident, Class of 2016,California Maritime Academy, Maritime StudiesEnrollmentFigure 3. WUE Enrollment and Savings (in millions), 2008-201235,000$250$221 31,058 $235.830,000$210.829,07726,711$20025,000 23,63224,670 $173.520,00015,00010,000$151.1$150$100$505,000Savings (in millions)“One of my top priorities was to experience a newliving environment, meet a more diverse group ofpeople, and gain exposure to a variety of educationalopportunities not available in my home state.With college costs almost doubling in the past fewyears, I faced financial constraints which limitedmy choices. WUE made it possible for me to follow my dreamswithin my budget. I wake up every day excited – and grateful –to be working towards my scholastic goals. It is a competitiveprogram but worth every effort. I am proud to be a participant,and I will always value the opportunity WUE provided me.”– Alex, Idaho resident, Class of 2016,Western Washington University, Biology and Anthropology02008 2009 2010 20112012$018www.wiche.edu/wue<strong>WICHE</strong>’s Student Exchange Program
Western Undergraduate ExchangeTable 10. Fall 2012 Enrollment Summary, New and Continuing StudentsState of AttendanceState of Residence(Number of WUEAttendanceInstitutions) AK AZ CA CO HI ID MT NV NM ND OR SD UT WA WY TotalsAlaska (4) – 32 176 47 26 23 28 16 6 4 62 4 21 135 8 588Arizona (26) 201 – 3,547 466 277 93 49 411 164 7 174 17 183 311 46 5,946California (11) 60 62 – 100 128 35 17 62 23 2 135 7 28 232 16 907Colorado (22) 177 344 1,061 – 343 99 72 138 295 42 151 72 185 193 247 3,419Hawai’i (3) 59 69 1,509 190 – 28 17 40 22 7 106 12 17 346 9 2,431Idaho (6) 123 42 368 63 28 – 177 126 11 3 242 6 42 1,011 30 2,272Montana (13) 147 38 287 261 31 289 – 60 10 43 189 53 56 511 183 2,158Nevada (7) 82 87 2,080 75 303 44 24 – 13 2 90 7 47 108 12 2,974New Mexico (10) 28 196 548 82 29 14 7 42 – 0 32 6 8 66 11 1,069North Dakota (11) 102 123 562 202 29 57 148 84 23 – 71 184 66 227 196 2,074Oregon (6) 189 48 897 57 306 86 24 93 15 2 – 4 24 483 11 2,239South Dakota (6) 37 111 199 246 11 27 95 30 13 208 33 – 22 77 445 1,554Utah (9) 26 40 133 58 26 105 22 94 14 2 35 1 – 39 34 629Washington (4) 163 25 233 72 89 201 73 35 18 5 192 2 13 – 15 1,136Wyoming (9) 27 39 77 455 8 88 477 35 16 39 24 130 186 61 – 1,662Two-Year (65) 137 180 919 643 214 218 620 274 152 67 194 152 505 622 142 5,039Four-Year (81) 1,284 1,076 10,758 1,731 1,420 971 610 992 491 299 1,342 353 393 3,178 1,121 26,019Grand Total (146) 1,421 1,256 11,677 2,374 1,634 1,189 1,230 1,266 643 366 1,536 505 898 3,800 1,263 31,058For answers to all your questions about WUE, visit www.wiche.edu/ask<strong>WICHE</strong>www.wiche.edu/wue<strong>Statistical</strong> <strong>Report</strong>: 2012-13 19
Western Undergraduate ExchangeTable 11. Five-year Enrollment Summary, New and Continuing Students, 2008-20122008 2009 2010 2011 2012State Received Sent Received Sent Received Sent Received Sent Received SentAlaska 499 1,680 534 1,631 546 1,534 562 1,496 588 1,421Arizona 3,292 865 3,480 1,032 4,321 1,045 5,208 1,173 5,946 1,256California 553 5,082 916 5,698 1,026 7,667 987 9,717 907 11,677Colorado 1,562 2,491 1,734 2,457 2,074 2,345 2,912 2,312 3,419 2,374Hawai’i 1,998 1,442 1,968 1,455 1,838 1,508 2,253 1,596 2,431 1,634Idaho 2,550 1,130 2,756 1,215 2,807 1,175 2,380 1,235 2,272 1,189Montana 1,637 1,168 1,754 1,257 2,012 1,130 2,097 1,273 2,158 1,230Nevada 2,737 944 2,955 1,084 2,625 1,104 2,795 1,256 2,974 1,266New Mexico 460 668 581 610 715 624 942 630 1,069 643North Dakota 1,437 357 1,466 361 1,604 367 1,876 394 2,074 366Oregon 1,939 1,506 1,626 1,614 2,238 1,586 2,147 1,490 2,239 1,536South Dakota 1,289 695 1,303 596 1,407 594 1,435 546 1,554 505Utah 715 795 757 780 682 867 661 885 629 898Washington 818 3,656 890 3,721 1,028 3,986 1,124 3,848 1,136 3,800Wyoming 2,146 1,153 1,950 1,159 1,788 1,179 1,698 1,226 1,662 1,263TOTAL 23,632 23,632 24,670 24,670 26,711 26,711 29,077 29,077 31,058 31,058NOTE: University of Wyoming’s WUE enrollment numbers are based on end-of-fall data from the previous year.“I’m originally from South Dakota, and the WUE program gave me the opportunity to experience life outside the Midwest, while making itaffordable to do so. It also allowed me to expand my horizons and get comfortable with my surroundings in all places or situations. The WUEprogram gave me the confidence to later pursue an M.B.A. in New York City, which I completed last May. Thank you for the opportunity, and Ihope many others will continue to benefit from this program, just as I have.”– Ross, South Dakota resident, Class of 2010,Northern Arizona University, Finance20www.wiche.edu/wue<strong>WICHE</strong>’s Student Exchange Program
Internet Course Exchange<strong>WICHE</strong> Internet Course Exchange (ICE): The Next Generation of Student ExchangeThe <strong>WICHE</strong> Internet Course Exchange (ICE, www.wiche.edu/ice) is a robust administrative tool institutions canleverage to operate more efficiently and to advancestrategic initiatives during these tight financial times.Through ICE member institutions exchange seatsin online courses to provide more selection to theirstudents and give faculty the opportunity to collaboratewith their colleagues at other institutions. Considerthese scenarios:• Your institution has a strong online program in a specialty area. But itis underenrolled and you do not know if you can justify the expense.ICE allows you to export empty seats to other institutions and generaterevenue.• A vacancy on your faculty leaves you with a course that no one oncampus is qualified to teach. ICE allows you to see if other institutionshave vacant seats in online versions of the same course that you canimport and make available to your students.• There is pressing need in your region to develop and deliver a programto help professionals meet certification requirements. But new resourcesare scarce. ICE allows you to identify other institutions in the samesituation, to pool faculty expertise and to share the work and expenseof developing a new online program. The resulting program is morerobust because it garners enrollments across multiple institutions.• Your institution’s new strategic plan calls for creating an organizationthat is responsive to change and that better utilizes technology toexpand and enhance its academic offerings. Rather than watchingthis vision fade while waiting for “a better day,” you can tap ICE foraffordable opportunities to push forward.• Your budget constraints necessitate cutting low-enrollment programs.ICE allows you to import seats in courses from other institutions to meetyour teach-out requirements.While the possibilities for academic collaborations are infinite, thebehind-the-scenes work necessary to make a consortium function aretime-consuming. Institutions that have launched such programs withoututilizing ICE can attest to the countless hours spent wrangling the detailsof admission, registration, financial aid, fee payment, credit transfer, andother issues. If not managed correctly, such details can be the undoing ofan otherwise good academic collaboration. Oftentimes, students sufferbecause institutions cannot get their processes to align. Fortunately, ICEoffers a robust administrative solution.ICE is a comprehensive model and set of tools for institutions lookingto expand online offerings through collaboration. <strong>WICHE</strong> has alreadynegotiated the necessary framework to facilitate exchanges and handlesthe financial transactions between institutions. ICE includes:• A database that displays detailed information about individual onlinecourses and the number of seats in them available for exchange.• Support for entire academic programs that are jointly developed anddelivered by institutions to fulfill common curricular needs.• Detailed policies that ensure smooth handling of importantadministrative issues (admission, registration, financial aid, and student feecollection).• Contacts at each participating institution who facilitate the exchange ofcourse seats, answer questions, and act as liaisons.• A forum for jointly addressing common educational needs.All participating institutions must be regionally accreditedand can be either two-year or four-year schools. Systemsand consortia whose member institutions meet the samecriteria may also belong. As members, all pay annual dues.ICE offers three types of exchanges:seat exchange, course exchange, andprogram exchange. Institutions canparticipate in one or more. In addition,they can be a teaching institution (TI)or an enrolling institution (EI), or both.As colleges and universities offercourses and programs to studentsat <strong>WICHE</strong> ICE member institutions,students benefit from richer, more specialized, and relevant course andprogram options. Faculty members enjoy teaching more courses in theirareas of specialization. Advisors are able to counsel students and articulatecourses for quality and transferability before students enroll in them. Andinstitutions can make wiser uses of their limited resources.www.wiche.edu/ice<strong>Statistical</strong> <strong>Report</strong>: 2012-13 21
“I graduated from a California high school and wanted to go to universitythere, but tuition costs have been skyrocketing and I couldn’t afford it.Fortunately, I enrolled at Northern Arizona University and was awardedWUE. WUE has allowed me to stay in school. I’m putting the tuitionsavings towards other school-related necessities, like books and rent.It’s helped me reduce the amount of student loans and reduce financialpressures. WUE has brought me one step closer to my career goals and Iam greatly appreciative. If it weren’t for WUE, I wouldn’t be graduatingin six months!”– Khaxil, California resident, Class of 2013,Northern Arizona University, Psychology and Sociology“WUE has helped me achieve my academic goals bymaking it easier to attend Idaho State University. Iam from Montana and none of the colleges had theprogram I was looking for. Idaho State Universitydid, but without WUE the financial burden wouldhave been heavy, and that alone would have madeit difficult for me to complete my education. WUEhas helped me get one step closer to my professionalgoal of becoming a speech pathologist.”– Paige, Montana resident, Class of 2016,Idaho State University, Speech PathologyThe <strong>WICHE</strong> Commission’s 16 members includerepresentatives from 15 states – Alaska, Arizona,California, Colorado, Hawai’i, Idaho, Montana,Nevada, New Mexico, North Dakota, Oregon,South Dakota, Utah, Washington, and Wyoming –and the Pacific island U.S. territories and freestandingstates (The Commonwealth of theNorthern Mariana Islands is the first to join).By promoting innovation, cooperation, resourcesharing, and sound public policy among statesand institutions, <strong>WICHE</strong> strengthens highereducation’s contributions to the region’s social,economic, and civic life.Western Interstate Commission for Higher Education3035 Center Green Drive, Suite 200Boulder, Colorado 80301-2204Tel.: 303.541.0214www.wiche.eduJanuary 201301-02-00-5400:PP:1.2M:2A371E“One of the biggest worries for prospective and enrolled graduate students is funding.WRGP opens doors by providing out-of-state-students with in-state tuition. This makesgraduate studies far more affordable and gives students from the West some level ofpreferential admission. The money I’ve saved by enrolling through WRGP has been puttowards research, attending conferences, and networking. Taking advantage of theseopportunities is imperative if I’m going to become a successful professional. I’m sure I speakfor many in expressing my appreciation for this program. WRGP has allowed me to pursuemy goals of providing mental health services to combat veterans, many of whom I servedwith in the Iraq War.”– Christian, Sergeant, U.S. Marine Corps (Combat Veteran), California resident, Class of 2017,University of Colorado Denver, Clinical Health Psychology, Ph.D.“WUE changed my life. I gotaccepted into an acceleratedhonors program called ITECat CSU, Chico. It’s for liberalstudy majors who aspire to beelementary school teachers. I’mfrom Washington, and the priceof out-of-state tuition wouldhave been too high for my family and me to afford.However thanks to WUE, I am now at Chico Statepursuing my dream to change children’s lives. Mygratitude is endless, and words cannot express howblessed I am to be a part of the WUE program.”– Valerie, Washington resident, Class of 2016,California State University, Chico, Liberal Studies“With the help of the <strong>WICHE</strong>PSEP program and the generosityof the State of Hawai‘i, I amable to pursue my dream ofbecoming a physical therapist.<strong>WICHE</strong> made it possible for meto attend a nationally rankedprogram without excessivefinancial burden. Thanks to PSEP I’ve been able todevote my time to becoming the best healthcareprofessional I can be without worrying aboutmoney. It’s been a blessing to discover what lifeis like miles away from home, but I look forwardto returning to Hawai‘i and serving the islandcommunity. I greatly appreciate Hawai‘i’s supportand will continue to make the most of thisopportunity.”– Nicole, Hawai‘i resident, Class of 2014,Regis University, School of Physical Therapy