Thesis - Teknisk Design
Thesis - Teknisk Design
Thesis - Teknisk Design
- No tags were found...

You also want an ePaper? Increase the reach of your titles
YUMPU automatically turns print PDFs into web optimized ePapers that Google loves.
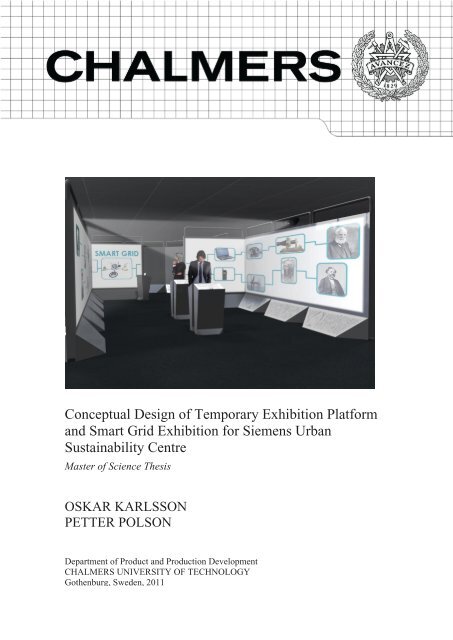
Conceptual <strong>Design</strong> of Temporary Exhibition Platformand Smart Grid Exhibition for Siemens UrbanSustainability CentreMaster of Science <strong>Thesis</strong>OSKAR KARLSSONPETTER POLSONDepartment of Product and Production DevelopmentCHALMERS UNIVERSITY OF TECHNOLOGYGothenburg, Sweden, 2011
Table of Contents1. Background and aim. .........................................................11.1 SIEMENS Urban Sustainability Centre ....................................... 21.2 The project ............................................................... 31.2.1 The project scope. .....................................................31.2.2 Limitations ............................................................41.3 Aim ...................................................................... 41.3.1 Platform for temporary exhibitions ..................................41.3.2 Temporary exhibition on Smart Grid ...................................41.3.3 Outdoor exhibit .......................................................42. Theory .......................................................................52.1 Introduction to the Smart Grid ........................................... 62.1.1 Defining the Smart Grid ...............................................62.1.2 Drivers for smart grid development ...................................72.1.3 Steps towards a smart grid ............................................82.1.4 The road forward .....................................................92.2 <strong>Design</strong> theory ........................................................... 102.2.1 Experience design ....................................................102.2.2 <strong>Design</strong>ing emotions ..................................................113. Method and execution. ......................................................133.1 Project planning ........................................................ 143.1.1 MECE analysis ........................................................143.1.2 Gantt chart. .........................................................143.1.3 Stakeholder overview ................................................153.1.4 Weekly report ........................................................153.1.5 Project log book .....................................................153.2 Data collection .......................................................... 153.2.1 Literature studies and seminars ......................................163.2.2 User studies ..........................................................163.2.3 Observation studies ..................................................173.2.4 Market studies .......................................................203.3 Data analysis ............................................................ 203.3.1 KJ-analysis ...........................................................203.4 List of requirements ..................................................... 203.4.1 KR-matrix ............................................................203.5 Idea generation .......................................................... 203.5.1 Brainstorming .......................................................213.5.2 Morphological matrix ........................................................22IV
3.5.3 Concept generation ..................................................223.6 Concept evaluation ...................................................... 233.6.1 PUGH Matrix .........................................................233.6.2 Stakeholder feedback ................................................233.7 Concept development .................................................... 234. Results and analysis. ........................................................254.1 Data collection .......................................................... 264.1.1 Literature studies ....................................................264.1.2 Seminars .............................................................264.1.3 User studies ..........................................................274.1.4 Observation studies ..................................................324.1.5 Market study. ........................................................354.2 Data analysis ............................................................ 374.2.1 Exhibition Content Description .......................................374.2.2 List of requirements .................................................384.2.3 Communication strategy .............................................394.3 Idea generation .......................................................... 414.3.1 Temporary exhibition concepts .......................................414.3.2 Outdoor exhibit concepts ............................................434.4 Concept evaluation ...................................................... 435. Final result .................................................................455.1 Temporary exhibition platform .......................................... 465.1.1 Placement in the Urban Sustainability Centre .........................465.1.2 Modular concept ....................................................475.1.3 Check-in desk .........................................................505.2 Exhibition <strong>Design</strong> Strategies for Successful Communication .............. 515.2.1 General exhibition guidelines. ........................................515.2.2 <strong>Design</strong> strategies. ....................................................515.3 Smart grid exhibition .................................................... 535.3.1 Exhibition structure and route .......................................535.3.2 Station 1 – Smart grid background. ...................................545.3.3 Station 2 – Historical timeline and definition .........................555.3.4 Station 3 – Benefits and challenges ...................................565.3.5 Station 4 – Actors and Markets, the SimGrid challenge ................575.3.6 Station 5 – Cases and solutions .......................................605.4 Outdoor exhibit ......................................................... 625.4.1 Outdoor requirements ...............................................62V
5.4.2 Concept description ..................................................636. Discussion. ..................................................................656.1 Method discussion ....................................................... 666.2 Result discussion ........................................................ 676.2.1 Temporary exhibition platform .......................................676.2.2 Temporary exhibition on smart grid ..................................676.2.3 Outdoor exhibit ......................................................686.3 Next step for Siemens .................................................... 686.3.1 Budget ...............................................................686.3.2 Case studies and products. ...........................................696.3.3 Software development ...............................................696.4 Conclusion .............................................................. 697. Bibliography ................................................................71AppendicesAppendix I - Exhibition Content Description ......................................74Appendix II - MECE Analysis - Facts & TARGET USER ..................................85Appendix III - MECE Analysis - Presentation. .......................................86Appendix IV - Weekly report (Example) ...........................................87Appendix V - Seminar transcripts ................................................88Appendix VI - Interview transcripts ..............................................92Appendix VII - Qualitative Observation studies. ...................................98Appendix VIII - Quantitative observation study ..................................102Appendix IX - Media Technology toolbox .......................................104Appendix X - Questionnaire. ....................................................105Appendix XI - BOCI Analysis .....................................................108Appendix XII - Kr-Matrices ......................................................109Appendix XIII - List of requirements .............................................110Appendix XIV - Stakeholder overview ...........................................112Appendix XV - Image board. .....................................................113Appendix XVI - Persona .........................................................114Appendix XVII - Brainstorming workshop results. ...............................115Appendix XVIII - PUGH-Matrices ..................................................119Appendix XIX - Concept survey ..................................................120Appendix XX - Concept survey Results. ..........................................128VI
Figure 5.3 Modular concept with projection . . . . . . . . . . . . . . . . . . . . . . . . . . . . . . . . . . . . . . . . . . . . . . . . . . . . 47Figure 5.4 Screen module - exploded view .....................................................47Figure 5.5 Base module placed in storage box ..................................................48Figure 5.6 Modular concept - Corner brace enables flexible placement ..............................48Figure 5.7 Wheels underneath screen module and racks on top. ...................................48Figure 5.8 Control module with hidden computer inside. .........................................49Figure 5.9 Speakers fitted into the base module. Cables are completely hidden underneath. ............49Figure 5.10 Projector mounted on screen rack . . . . . . . . . . . . . . . . . . . . . . . . . . . . . . . . . . . . . . . . . . . . . . . . . . . 49Figure 5.11 Smart-CARD. ....................................................................50Figure 5.12 USC first floor office space - Exhibition layout .........................................53Figure 5.13 Station 1 - Smart grid background ..................................................54Figure 5.14 Station 2 - Timeline and smart grid definition .........................................55Figure 5.15 Station 3 - BOCI analysis. ..........................................................56Figure 5.16 SimGrid Challenge ...............................................................57Figure 5.17 SimGrid - Screen view .............................................................58Figure 5.18 SimGrid - Close-up ...............................................................59Figure 5.19 Breakout space setting with solution display module ...................................60Figure 5.20 Breakout space - Exhibition layout ..................................................60Figure 5.21 Solution display module with cases displayed on globe .................................61Figure 5.22 Solution display module with Virtual City software .....................................61Figure 5.23 Icons representing cases and products ...............................................61Figure 5.24 Urban sustainability centre with outdoor area. ........................................62Figure 5.25 Outdoor exhibit attractor ..........................................................63Figure 5.26 Outdoor exhibit with augmented reality visuals. .......................................64VIII
Conceptual <strong>Design</strong> of Temporary Exhibition Platformand Smart Grid Exhibitionfor Siemens Urban Sustainability Centre1. Backgroundand aimThis section gives an introduction to the project, presentsits scope and aim, and describes Siemens Urban SustainabilityCentre where the project was carried out.1
Conceptual <strong>Design</strong> of Temporary Exhibition Platform and Smart Grid Exhibitionfor Siemens Urban Sustainability CentreBackground and Aim1.1 SIEMENS UrbanSustainability CentreMore people are moving into cities and both the globalpopulation and demand for resources grow. This makesthe urban environment increasingly important toconsider and due to dense populations, cities can becomea problem as well as provide opportunities for the future.Innovative technological solutions are essential to ensurea sustainable future and Siemens wishes to take a leadingrole in this development. Therefore, Siemens is buildingan Urban Sustainability Centre on the Docklands in EastLondon. The centre will open in the summer of 2012 andwill serve as an arena to showcase sustainable technologyand solutions for urban environments. The Urban SustainabilityCentre will be a new landmark in London’s GreenEnterprise District and will both showcase sustainabletechnology to the general public, and work as a meetingplace for city planners, decision makers, architects andindustry representatives from around the world. TheUrban Sustainability Centre will consist of two parts: theExhibition Crystal and the Corporate Crystal.Figure 1.3 Exhibition crystalFigure 1.1 Petter at the USC construction site in LondonFigure 1.4 Centre by nightFigure 1.2 Centre from the Royal Victoria docks2
Oskar Karlsson, Petter PolsonMaster <strong>Thesis</strong> 2011 at Chalmers University of TechnologyBackground and AimThe Exhibition Crystal will hold a permanent exhibitionon sustainable technology that targets the general publicand aims at creating interest and informing about sustainability.The exhibition design company EVENT hasthe overall responsibility for the design of the permanentexhibition which will consist of 2000 square meters ofinteractive installations. EVENT will also design installationsto be placed in the outdoor area around theUrban Sustainability Centre. The building itself will alsoshowcase sustainable technologies with solar photovoltaiccells on the roof, thermal storage facilities in the ground,and efficient ventilation and building managementsystem.The Corporate Crystal will contain conference facilities,office spaces, meeting rooms, and an auditorium thatwill both be used by Siemens and rented out to externalusers. One suggestion that has been addressed is toinclude temporary exhibitions into the Urban SustainabilityCentre and place them in the Corporate Crystal. Byplacing the temporary exhibition in a higher security areait can target a more specific audience, such as Siemenscustomers from industry, politicians and city planners.The content of the temporary exhibition can be presentedon a deeper and more advanced level and be more Siemens-relatedthan the permanent exhibition. This makesthe temporary exhibition a complement to the permanentone and allows for more targeted product display, whichcan be beneficial for Siemens.Topics for the temporary exhibition can be e.g. electromobility,energy efficient buildings, offshore powergeneration, or smart grid technology. Each temporaryexhibition is suggested to run for three months at atime on a rolling schedule and can be supported byconferences, meetings, music events and art exhibitionsrelating to the topic. There is also space available in theoutdoor area around the Urban Sustainability Centre foran exhibit which can relate to the temporary exhibition.1.2 The projectWhen the Urban Sustainability project started, onesuggestion was to include temporary exhibitions tocomplement the permanent one. Siemens wanted toanalyze if it was feasible to include temporary exhibitionsinto the Urban Sustainability Centre, and develop aconcept for a temporary exhibition platform. To illustratethe potential of including temporary exhibitions Siemensalso needed a concept for an exhibition on one of thesuggested topics. Different topics were discussed and thetopic of smart grid (See 2.1 Introduction to the SmartGrid on page 6) was chosen.1.2.1 The project scopeThe scope of the project was threefold and each part ispresented separately below.Platform for temporary exhibitionsThe first scope of the project was to develop a concept foran exhibition platform that can be used for temporarySustainabilitySustainability means capacity to endure.Sustainable development refers to environmental,social, and economic development that enablesfuture generations to have the same opportunityfor quality of life as today.3
Conceptual <strong>Design</strong> of Temporary Exhibition Platform and Smart Grid Exhibitionfor Siemens Urban Sustainability CentreBackground and Aimexhibitions in the Urban Sustainability Centre. Part ofthe task was to find a suitable location for a temporaryexhibition in the Corporate Crystal and design a layoutthat can be used for different exhibition topics. Includedin the platform concept was to present design strategiesthat can be used when developing the exhibition.Concept for temporary exhibition on the topicof smart gridThe second scope of the project was to present a conceptfor one of the temporary exhibitions on the topic ofsmart grid. The exhibition concept should include boththe information content and a design solution for how tocommunicate the content to the right target audience.Concept for outdoor exhibitThe third scope of the project was to develop a conceptfor an outdoor exhibit which relates to the temporaryexhibition and to the Urban Sustainability Centre.1.2.2 Limitations••The concepts needed to be realisable with respectto both technology and cost, but no detailed costcalculations were delivered.••Some technical aspects of the installations wereconsidered but no detailed information on constructionand maintenance was presented.••Actual construction of the exhibition was notincluded in the project scope.1.3 AimThe aim of the project follows the scope and was thusdivided into three parts that are treated separately.1.3.1 Platform for temporary exhibitionsThe overall purpose of the Urban Sustainability Centre isto present sustainable technology solutions to the public.The temporary exhibition aims to extend the informationalready given in the permanent exhibition and give thevisitors the opportunity to make a deep dive into certaintopics. The platform concept must be flexible enoughto be able to host different topics in order to enablethat the same platform can be used for other temporaryexhibitions in the Urban Sustainability Centre. Context,such as the building design and permanent exhibitioncontent, should be considered in the platform conceptdesign in order to make the temporary exhibition fit intothe building and complement the permanent exhibition.Besides presenting information, the temporary exhibitionshould work as a platform where different actors can meetand discuss challenges and solutions.1.3.2 Temporary exhibition on Smart GridThe concept for the temporary exhibition on the topicof smart grid aims to give the visitors an interactiveexperience and a better understanding of smart gridtechnology and its part in the energy system. Theexhibition should present Siemens’ view on the topicof smart grid and promote Siemens as the best partnerand supplier of smart grid products. The concept furtheraims to present the topic in an interactive, inspiring andinformative way that appeals to the right target group.The project should answer the following questions:••What information on smart grid should be communicatedto the targeted audience?••How should this information be presented?By answering these questions this project aims toincrease awareness and interest in smart grid andits role in a sustainable future. This facilitates thetransition into a smart grid infrastructure and moresustainable user behaviour and Siemens is promoted as atrustworthy, competent and reliable partner in smart griddevelopment.1.3.3 Outdoor exhibitThe outdoor exhibit aims to attract people’s attentionand induce interest in the Urban Sustainability Centre.The concept for the outdoor exhibit will be an installationdirected to the broad public and it needs to fulfilspecific requirements in the outdoor area. The outdoorexhibit concept aims to give the audience an interactiveexperience that will raise questions and make theminterested in sustainability and the Urban SustainabilityCentre.4
Conceptual <strong>Design</strong> of Temporary Exhibition Platformand Smart Grid Exhibitionfor Siemens Urban Sustainability Centre2. TheoryThe theory section of this report consists of two parts - an introductionto the concept of smart grid and one part regardingdesign theory. The smart grid theory is the basis for definingthe Exhibition Content Description document (see appendix)and the design theory outlines how content can be successfullycommunicated to the target group.5
Conceptual <strong>Design</strong> of Temporary Exhibition Platform and Smart Grid Exhibitionfor Siemens Urban Sustainability CentreTheory2.1 Introduction to theSmart GridThe world’s energy demand is increasing rapidly,especially in the developing countries, and the globalpopulation is growing. At the same timeit is becoming more and more obviousthat the world’s resources are finiteand that the way energy is producedand consumed need to change into amore sustainable usage. On the onehand, there is climate change due to“Think of thesmart grid asinternet broughtto our electricitysystem.greenhouse gas emissions from theenergy and transport sector. On the otherhand, the fossil resources that today stand forabout 85% of the world’s total energy supply willeventually run out (International Energy Agency, 2010).Great transitions need to be done in order to change theenergy mix into renewable sources and to use energymore efficiently.Today’s grid is characterized by centralised, large scaleproduction and hierarchical distribution from the powergenerator to the consumer through high voltage transmissionnetworks and low voltage distribution networks.In the future, both supply and demand will be lesspredictable and more complex. On the supply side, therewill be more intermittent sources e.g. wind,solar and wave power plants. There will alsobe more small-scale decentralised powerproduction that needs to be handled aswell as large scale renewable energyplants. On the consumer side of theelectricity chain there will be a higherdemand from new electric vehicles andmore electronic equipment in houses andindustries that need a stable supply ofelectricity. To meet this future demand, theelectric grid has to develop into a smart grid that can bothsecure the balance between production and consumptionand guarantee the availability of high quality electricity.“The most clean and sophisticated way of utilizingenergy is in the form of electricity, a high quality energycarrier that can be transformed into all other sources ina controlled way. Today we stand before an electricityrevolution where large parts of the energy systemsworldwide will use electricity as the predominant energycarrier, e.g. by transforming the transport sector intoelectrical vehicles. However, this electrification of oursocieties is not possible with today’s electrical grids.2.1.1 Defining the Smart GridDue to the complexity of the concept, there are manydefinitions of a smart grid. The definition dependson what the driver is for developing a smart grid indifferent countries and what part different actors playin the development. One definition that summarises theconcept is to say that a smart grid is an electricity networkthat can intelligently integrate the behaviour and actionsof all users connected to it in order to efficiently deliverSmart meteringElectricity metering that communicateswith both the consumerand the grid. Smart metering helps theconsumer to monitor and optimise their energyconsumption based upon their demand andthe energy price (which can be set in real-time). At thesame time the smart metering enables utilities tocollect the necessary information to be ableto balance the supply and demand inthe grid by analysing consumer behaviourand projected electricitygeneration.6
Oskar Karlsson, Petter PolsonMaster <strong>Thesis</strong> 2011 at Chalmers University of TechnologyTheorysustainable, economic, and secure electricity supplies(European Technology Platform, 2011). A shorter way tosummarise it would be to say “Think of the smart grid asinternet brought to our electric system” (Litos StrategicCommunication, 2008).Another approach to describe the smart grid would beto take the technology perspective and define it throughthe products that build it. Communication technology iscentral in a smart grid and the information is used foroptimising the electricity transmission and distributionfrom suppliers to consumers. Smart metering that keepstrack of production and consumption is therefore animportant part of a smart grid. Other examples of technologiesthat will be part of a smart grid are buildingmanagement systems which optimise the energy usein homes and smart consumer products that use theinformation from metering to shift the electricityconsumption to off peak hours when it is cheaper for theuser (Flick & Morehouse, 2010).2.1.2 Drivers for smart grid developmentThe drivers for developing a smart grid are many andvary between different locations and situations. Researchand development of smart grid is carried out all overthe world so its development can be discussed from aglobal perspective. However, the deployment of smartgrid solutions is much dependant on the region due todifferences in the infrastructure age, growth in electricitydemand, changes in the energy mix, and market structure.Drivers worldwideIn Europe the main driver for smart grid development isthe political will to change the energy mix so that moreenergy is produced from renewable sources. The EuropeanUnion has set up targets for the year of 2020 that includemore renewable energy and better energy efficiency(European Commission, 2011). In order to reach thisthere is a need for smart grid technology that can balancesupply and demand without the need for excess power. InUSA the situation is different due to an old and unreliablegrid, especially the transmission grid. The country hashad some costly blackouts and brownouts in the past andwants to secure its supply. New investments are beingmade into the electricity system and through smart griddevelopment necessary investments can be postponedor minimised. China on the other hand is the region thatgrows the fastest at the moment and needs to build a lot ofnew grid to supply the energy demanding east part of thecountry with energy from sources in the west part of thecountry. To optimise the investments needed, a new gridwill include smart technology (Larsson & Ståhl, 2011).Sustainability, climate and renewable energyTo deal with climate change and other environmentalissues related to an unsustainable use of fossil energyin the world, a global transition of the energy mix intorenewable sources needs to take place.The sun supplies the world with its total annual energyneed in little more than an hour. Hence, the potential forusing solar power to meet the world’s energy demand ishuge. Solar power can either be harvested directly or inBlackouts and brownoutsDisturbances in an electricity grid can be of differentkinds. A blackout means a power outage inthe grid which shuts down the supply. A brownout isa voltage drop which can cause flickering lightsand damage sensitive equipment.7
Conceptual <strong>Design</strong> of Temporary Exhibition Platform and Smart Grid Exhibitionfor Siemens Urban Sustainability CentreTheorythe form of wind and hydro power. Wind power is growingfast today with a growth rate of about 25% per year (TheWindpower, 2011) and will become a large contributorto the world’s electricity supply in the near future. Directsolar power can be turned into electricity from eitherphotovoltaic cells, or from thermal solar power plants.The problem with integrating more renewable powergeneration into an energy system is that those sourcesare highly fluctuating (except for hydropower with dams).Electricity supply today is adapted to the demand of theusers and needs to be more reliable than renewable intermittentenergy sources. To allow for the expansion ofrenewable energy, the supply and demand relation mustbe balanced. Storage capacity is needed in the grid whenthere is excess power and the demand for electricity mustbe managed to match the supply. This calls for a flexibleelectricity price in combination with a grid that cancommunicate with smart home products (World EnergyCouncil, 2010).Energy security and efficiencyIn many places around the world there is already a problemwith old grids not being able to supply the electricityaccording to demand. Blackouts and brownouts in theelectricity grid are costly and this problem grows as theworld’s energy demand increases and the fossil sourcesare running out. Power quality also becomes moreproblematic when more and more disturbing objects andsensitive equipment are connected to the grid. This callsfor a smarter control of the electricity system to assure asafe and reliable supply of electricity of the right quality(International Energy Agency, 2011).Today’s electricity infrastructure is designed to meetthe highest level of demand and during non-peak hoursthe system is underutilised. If demand was levelled, thisexcess power capacity would not be needed. Smart gridtechnology can manage this by providing incentives forconsumers to shift consumption from peak hours to offpeak hours. This is achieved by providing consumerswith information about supply and electricity price, aswell as through smart automated solutions which helpsconsumers make the most profitable choices (Larsson& Ståhl, 2011). This will open up a new era of consumerchoice and enable household equipment, such as washingmachines, to be programmed to start when the electricityprice is low, normally during night time (Vattenfall R&D,2010). Similarly an electric car battery can work as powerstorage and provide a household with energy when theelectricity price is high. Such development will requiretechnical equipment and the grid to communicate, aswell as smart software solutions to make the consumerdecisions as easy as possible (European TechnologyPlatform, 2011 ).2.1.3 Steps towards a smart gridSteps that need to be taken towards a smart grid differa lot between regions. What steps that need to be takenare generally depending on the current situation in theDemand responseIn the traditional electricity grid,balance is kept by adapting the supplyto the projected demand. In a future gridwith more fluctuating renewable energy sourcesthis relation will change into a Demand Responsesystem, where the consumption is controlled by pricingsignals to adapt the demand to the currentsupply. A demand response system will requiresmart technology that meters andoptimises consumptions to evenout the demand.8
Oskar Karlsson, Petter PolsonMaster <strong>Thesis</strong> 2011 at Chalmers University of TechnologyTheoryregion and what the main drivers are for the smart griddevelopment.Technology developmentStorage is said to be the biggest technological challengefor smart grid development and new and better solutionfor energy storage is needed in the future grid to level thesupply from intermittent sources. The level of integrationof renewable capacity depends on storage capabilities.Electricity storage will therefore play an important part inachieving self-sustaining areas on local or regional level.Another application for improved energy storage is withinthe demand response system, where securing the supplyof electricity to the consumers is a crucial issue. Differentstorage technologies are needed for different applicationsand options to consider are batteries, pump power plants,flywheels and super-condensers (Larsson & Ståhl, 2011).Market developmentA smart grid development will lead to new market opportunitiesand the possibility for new actors to enter theenergy sector. Examples of new actors are the aggregatorsthat collect small scale power production and sell it onthe existing energy market and the “prosumer” that bothgenerates and consumes electricity.One area that is important to develop is a demandresponse system that shifts and balances the load anddecreases peak demand in the energy system. Demandresponse is one of the enabler of large scale expansionof intermittent power production and will need smartmetering infrastructure, distribution management andnew price signals, as well as smart customer products andinterfaces (Larsson & Ståhl, 2011).Setting new standardsSmart grid technology will bring together many industrysectors that previously have not worked together and consequentlycombine different products into one solution.At the same time, large investments are necessary tospeed up the smart grid development. This calls for goodinteroperability between companies and products todecreases the risks with the investments. Standards aretherefore crucial for a variety of products and services inthe smart grid field (International Energy agency, 2011),(International Electrotechnical Commission, 2010).2.1.4 The road forwardCommercial scale demonstration projects are neededto capture real-world data in order to find out how thetechnology works with the market and regulation systems,as well as with the end-user. Large scale demonstrationswill provide shared learning among the participatingactors, decreased risk when investing in new technology,and best practice methods for smart grid deployment.Since the road to a smart grid is unclear and can takedifferent turns, and a lot of the development is new andgroundbreaking, there is a need for different actors tomeet and discuss problems and solutions. An exhibitionon the topic can provide a meeting platform and therebyfacilitate smart grid development.Prosumers andVirtual PowerPlantsConsumers can also generate electricityand use it, store it or sell it to the grid andthus acting as so called “prosumers”. Many smallelectricity generators can get together to produceelectricity as a virtual power plant. A virtual utilityis a cluster of power plants and storage facilitiescontrolled by one Energy Management System.Coming together in a virtual powerplant can be a way for small producersto get market shares.9
Conceptual <strong>Design</strong> of Temporary Exhibition Platform and Smart Grid Exhibitionfor Siemens Urban Sustainability CentreTheory2.2 <strong>Design</strong> theoryAll structured product design work is based on scientifictheories, methods and models. In this project the theoriesof product design was applied to exhibition design. Thefollowing section discusses the main ones that wereapplied.2.2.1 Experience designinteraction (fantasising about, remembering or anticipatingusage of a product e.g. “I expect this handle to breakif I push it to hard”). The experience is also shaped bythe characteristics of the user engaged in the interaction(e.g. personality, skills, background etc.) and those ofthe product (e.g. shape, colour, behaviour etc.). Finally,besides the type of interaction and characteristics ofthe user and product, the third element that affects theproduct experience is the context of the human-productinteraction (Desmet & Hekkert, 2007).The paradigm shift from technology-centred designto user-centred design has in recent years developedone step even further. According to certain theories(Desmet & Hekkert, 2007), all interaction between usersand in-animate objects result in an experience, and theconcept of “Product experience” is nowadays consideredan important aspect of product design. Instead ofdesigning products or services, one can shift the focus toactually designing experiences. The experience visitorsare exposed to when visiting an exhibition was consideredcrucial for the effectiveness of the final design result andfurther investigations in the field of experience designwere considered necessary for this project.USERAestheticexperienceEmotionalexperienceExperienceof meaninguser-product interactionPRODUCTProduct experience refers to all possible affectiveexperiences involved in human-product interaction. Human-productinteraction include instrumental interaction(e.g. using, operating managing products), non-instrumentalinteraction (this refers to interaction that doesnot directly serve a function in operating a product e.g.touching the soft seat in a premium car), and non-physicalFigure 2.1 Product experienceProduct experience can be divided into three maincomponents: aesthetic experience, attribution ofmeaning, and emotional response, which together shapethe total experience.User-centred andproduct-centreddesignUser-centred design is a design philosophyin which the needs, wants, and limitations ofend users of a product are given extensive attention.Its predecessor, the product-centred designphilosophy, had a heavy focus on innovation,sometimes forcing the users to change theirbehaviour to accommodate new productsrather than letting the needs ofthe users shape the product.10
Oskar Karlsson, Petter PolsonMaster <strong>Thesis</strong> 2011 at Chalmers University of TechnologyTheoryAesthetic experience denotes a products capacity toaffect our sensory modalities. For example, an objectcan be pleasant to look at, have a nice texture, or evensmell enjoyable. The degree to which the perceptualsystem manages to detect structure, order, or coherenceand assess the feature’s novelty or familiarity typicallydetermines the affect that is generated from this sensorystimulus.Attribution of meaning is closely connected to cognitiveprocesses within the user. Interpretations, memoryretrieval, and association are all important proceduresthat shape the meaning that is assigned to a certainproduct. This aspect is clearly very individual and thusvulnerable to e.g. cultural differences; a person from awestern culture might attribute different meanings tocolours, shapes and symbols than an individual from anAsian culture.As shown in the illustration above, the aestheticexperience and the attribution of meaning both affectthe emotional response. Emotions in this case refer to theactive phenomena typically considered in psychology andeveryday life, e.g. love, desire, fear, disgust, etc. and arecritical for the product experience. Contrary to popularbelief, emotions are not arbitrary but rather the result of acognitive but often unconscious process and thus, in thissense, quite rational (Desmet & Hekkert, 2007).might find it important to include emotion in theintentions of their design efforts. Emotional responsescan also effect customers’ preferences when it comes topurchase decisions and might therefore have a considerableinfluence on a product’s success. Because of thisreason, designing for emotions is an important viewpointwhen developing products, services or experiences thatultimately aim to sell; in this case Siemens solutions.Desmet (2002) claims that because emotions are not asintangible as they seem, designers can influence theemotional impact of their designs.When discussing designing emotions it is important totry and define the concept of emotions, this field is closelylinked to psychological affect. The term affect, or affectivestate, is generally used to refer to all types of subjectiveexperiences that are valenced, i.e. good or bad, pleasantor unpleasant etc. Russel (2003) improved this one-dimensionalmodel by introducing the state of physiologicalarousal into the assessment. This resulted in a twodimensionalcircumplex model of core affect.This model illustrates the entire span of different coreaffects, from calm and unpleasant, to activated andpleasant. The core affect’s position in the model movesaround throughout the day when interaction is made withdifferent products and it responds to our experienceswith these products.2.2.2 <strong>Design</strong>ing emotionsAccording to the section above, all encounters within-animate objects and products create experienceswhich in turn induce emotions. Given this, designersPRODUCTirritationdisgustalarmastonishmenteagernesscuriosityactivatedinspirelovedesiredisappointmentcontemptjealousyunpleasantpleasantfascinationadmirationjoyfulnesserienceeaningractionboredomsadnessisolationcalmawaitingdeferentcalmFigure 2.2 Circumplex model of core affectsatisfactionsoftenedrelaxed11
Conceptual <strong>Design</strong> of Temporary Exhibition Platformand Smart Grid Exhibitionfor Siemens Urban Sustainability Centre3. Method andexecutionIn this section the methods used in the projectare described, both in theory and how they areused. Analysed results of the different studies arepresented in the next section. The project process isillustrated in the figure below and the different partsare described further.13
Conceptual <strong>Design</strong> of Temporary Exhibition Platform and Smart Grid Exhibitionfor Siemens Urban Sustainability CentreMethod and Execution3.1 Project planningInitial planning part of this project consisted of making a MECE analysis, a Gantt chart and a stakeholder overview.During the project process weekly reports were sent to the project owners and a project log book was written. Thesemethods are described below.Project planningConceptevaluationDevelopconceptData collectionIdea generationVisualisation &DocumentationData analysisSpecification ofdemandsPresentationFigure 3.1 Project process3.1.1 MECE analysisMECE stands for Mutually Exclusive and CollectivelyExhaustive and is a general grouping principle. It isgenerally used for dividing a complex problem intosolvable sub-problems. The result of the MECE analysisis visualized with e.g. a tree diagram structure. Theprocedure includes breaking down the core problemof the project into sub-problems that are, on each andevery level of the tree diagram, mutually exclusive andcollectively exhaustive. Mutually exclusive implies thatno sub-problem should represent or overlap any othersub-problem and collectively exhaustive denotes that theset of all sub-problems, taken together, should fully characterizethe total core problem (Tom Spencer, 2011).The MECE analysis carried out in this project helped toform an initial proposal of what the main questions ofthe project were, what information that was alreadyavailable, what information that needed to be collected,and what activities that should be undertaken to collectthis information. This proposal was then used to generatethe first Gantt chart.3.1.2 Gantt chartA Gantt chart is a type of flow chart used in projectplanning to graphically illustrate a projects differentphases and the relationship between them. The chartconsists of horizontally oriented bars on a timeline. Eachbar represents a process or activity and the length of thebar and where it starts and stops illustrates at what timethat particular phase should start, the amount of timeset aside for it, and when it terminates. The differentbars’ sizes and positions present a graphical overview ofthe workload and project planning for the entire project(Pinto, 2007).14
Oskar Karlsson, Petter PolsonMaster <strong>Thesis</strong> 2011 at Chalmers University of TechnologyMethod and ExecutionIn this project a Gantt chart was produced at the startof the project time period to get an estimation of howmuch time the different processes were allowed to take.This gave a useful overview of what activities that shouldbe processed during each week. The Gantt chart wasalso attached to the weekly report to communicate theprogress in the project process to the project owners.3.1.3 Stakeholder overviewThe stakeholders of a project are the individuals orgroups that are likely to be affected by the project and/or its result. The stakeholders can be certain individualpersons, specific target groups, general culturegroupings, commercial companies, governmental entitiesetc. A stakeholder analysis is the process of identifyingthese and sorting them according to their impact on theproject and the impact the project will have on them.This information is then the basis for assessing how theinterests of those stakeholders should be addressed for asuccessful project result (Olsson & Skärvad, 2007).The stakeholders of this project were illustrated on amind map where the size of each bubble represented theimpact that particular stakeholder had on the project.This overview helped to summarize the different requirementsand define how conflicting demands from differentactors related to each other.3.1.4 Weekly reportsecure progress and useful results. Project owners needto know the status and progress of the project to knowthat it is on the right track or if any further resourcesneed to be put in place to take the project forward.For this purpose, a Weekly Report template was producedfor this project. The report was sent out on a weeklybasis and in a brief and concise manner discussed thefollowing: project outline, recent activities, results, nextstep, identified problems, solutions, and assistanceneeded for the project. The whole report fitted on an A4sheet and gave the project owners a quick overview of theproject, its current status, and whether their assistancewas needed at the moment.3.1.5 Project log bookA project of this size and time span covers a lot of differentprocesses, studies and activities and to keep track, a logbook was written. This was mainly for internal use, tokeep track of events and results and to be able to backtrack at any time in the process.3.2 Data collectionBased on the MECE- and stake holder analysis, and inputfrom the project owners extensive data collection wascarried out. Literature studies, user studies, observationstudies, and market studies were performed to collect thedata necessary for the project progress.Continuous communication between the projectexecution team and the project owners is important toProjectstartDatacollectionDataanalysisList ofreq.IdeagenerationConceptevaluationFinalconceptFigure 3.2 The design process15
Conceptual <strong>Design</strong> of Temporary Exhibition Platform and Smart Grid Exhibitionfor Siemens Urban Sustainability CentreMethod and Execution3.2.1 Literature studies and seminarsTo gather the theoretical information necessary toperform this project, literature on the topics of smartgrid, experience design, and designing emotions wasconsulted. The literature was picked out from libraryconsultations and the internet or recommended by theproject supervisors or other involved personnel. See Bibliographyfor complete list of literature.As a complement to the literature studies, seminars wereattended at two different occasions. Visual forum is theleading Scandinavian visualisation conference and washeld for the seventh consecutive year at LindholmenScience Park, Göteborg 2011-05-03. It focuses on visualizationtechnology for businesses, researchers,academia and the public sector. The seminars at VisualForum mainly concerned visualisation and learning.The seminars at Elfack discussed the current smart griddevelopment status. Elfack is a tradeshow regardingelectricity, targeting industry representatives. It was heldat the Swedish fair in Göteborg 9th May 2011 to 12th May2011. Transcribed records of the seminars are presentedin the appendix (See Appendix V - Seminar transcripts onpage 88) and analyses of the results are presented inthe result section.3.2.2 User studiesThe user studies performed in this project were mainlyquestion based methods. Question based user studiesconsist of interviews and questionnairesand can either be very structuredor more unstructured. Structuredinterviews and questionnaires follow acertain template very strictly whereasin unstructured ones the questionsasked depend on what answers that arereceived.“-Smart gridQuestionnaireInterviewsDuring a personal interview an interviewerasks an interviewee a set of questions. If aninteresting topic comes up the probing technique can beapplied. The probing method encourages the intervieweeto develop certain interesting answers or commentson a more detailed level and describe their opinionsWhich are themain bottlenecksfor smart griddevelopment?and emotions around the subject. Interviews generallygenerate qualitative data and are therefore a powerfultool to collect new information.The interviews in this project were usually semi-structuredwith partly prepared questions and partly opendiscussions. The probing method was used to focus oninteresting topics that came up during the interviews.Siemens personnel (See Appendix VI - Interviewtranscripts on page 92) were interviewed to gain moreknowledge on Siemens’ view on smart grid and theirstrategies for exhibition design. Interviews with externalpersons were also held to increase understanding indifferent aspects of exhibition design and communication.The Siemens personnel and others involved in theUSC that were interviewed were chosen by Siemens. Theirroles were as experts on smart grid or as stakeholders inthe USC project, e.g. the architects of the building or thedesign team working with the permanent exhibition.QuestionnairesQuestionnaires are a good way to collect data froma large number of people. It is essentially a questionbased method that uses written or digital documents tocommunicate the questions and collect the answers. Ingeneral there are two types of questions in a questionnaire;ones with fixed answer options or ones with thepossibility to write the answers freely. Questionnaireswith fixed options are mainly used to collect quantitativedata whereas allowing the user to write freely alsocollects qualitative data.To gain an answer set that is relevant tothe project it is important to consider theselection of people that fill in the questionnaire.The selection can be representative,meaning that the people who fillin the questionnaire are similar, onas many levels as possible (knowledgelevel, gender, age, cultural background,occupation etc.), to the group that istargeted regarding whatever the questionnairemeans to investigate. Another wayto make a selection is what is called a critical selection.With this method focus is put on the critical aspects ofthe investigated subject and people who comply withthese criteria are chosen. If designing a mobile phonefor elderly people it might be beneficial to do a criticalselection and collect data from people with rheumatismor other motoric handicaps.“16
Oskar Karlsson, Petter PolsonMaster <strong>Thesis</strong> 2011 at Chalmers University of TechnologyMethod and ExecutionSince an important part of this project was to communicatethe topic of smart grid, the target audience’s knowledgelevel on this topic was of interest. To be able tocommunicate interesting information in the exhibitionand not repeat what they already knew a smart gridquestionnaire was constructed (See Appendix X - Questionnaireon page 105) to get a better understanding ofthe target group’s idea of the concept. The questionnairestudy was carried out among 12 professionals withinthe electricity- production, transmission, distribution,and installation field at the Elfack fair in Göteborg. Thisselection was considered critical for the target groupregarding the criteria:• Technology interest• Types of professions• Knowledge level on the topic smart gridCriteria such as e.g. age, gender, or nationality were nottaken into account. The questionnaires were filled in atthe fair in coffee shops and similar and then analysedwith box diagrams.Later in the project process, after presenting the initialconcepts, a concept survey was used to summarisefeedback. Each of the concepts was presented visuallyand in text and the participants were asked to give theirfeedback in a digital survey form. This data was thenanalysed and summarised into a table.3.2.3 Observation studiesObservation studies are a very helpful complement to thequestion based methods. Observing how users interactwith products can generate a lot of useful input thatuser studies such as interviews possibly would miss. Animportant advantage of observation studies is that theamount of information that is gathered through visual observationsis not limited by what the interviewee believesis important, which might be the case with interviews.Also, the interviewee’s ability to phrase and communicatethe point might also limit the information transfer andthus the usefulness of the study. A disadvantage is thatthe method doesn’t generally detect emotions, attitudesor preferences.The observation can be structured or unstructured anddifferent technical aids can be used such as camerasor audio recorders. In direct observations the observerobserves without interfering with the observed. In participatingobservations the observer is allowed to askquestions about whatever is investigated during thestudy. This probing technique might generate additionalqualitative data but might also distract the user fromperforming the task the way as would be the case if theuser was unobserved.Observation studies were an important part of this projectto gain more knowledge in how visitors interact withdifferent types of exhibition installations, to gain moreexperience in exhibition design, and also get inspirationfor different exhibition solutions.The observation studies were executed at five differentlocations listed below. The first three studies were directobservation studies done at museums and exhibitioncentres. The studies focused on how different installationsworked, which ones that were popular and why. Byalso testing different interactive installations ideas andinspiration on exhibition design and interaction methodswere gained. The two last studies were done at fairs andtradeshows in a more quantitative manner. The visitors’behaviour around different installations was observed,and exhibits that attracted most attention were studiedmore closely. The results and analyses are presented inthe Result section.Universeum, GöteborgUniverseum is a Science park with both permanent andtemporary exhibitions. Some of the exhibitions focuson animals and nature and there are for instance anaquarium part and a rain forest in the building. Otherexhibitions are covering different science topics suchas how the human brain works or what forensic sciencemeans. Universeum is mostly targeting families withchildren and uses mostly interactive installations for thekids to play around with.The museum of Natural History, GöteborgThis is a typical natural history museum presentinganimals and plants, both current and extinct. The targetaudience is mostly families and school classes and the installationsare mostly non-interactive.Elfack at the Swedish Fair, GöteborgElfack is a big tradeshow on the topic of electricity,targeting a variety of industries with business in electricityinstallation, power generation, electricity transmissionand distribution, and consumer products. Besides theexhibitions there are also seminars and forums discussingcurrent topics such as smart grid development.17
Conceptual <strong>Design</strong> of Temporary Exhibition Platform and Smart Grid Exhibitionfor Siemens Urban Sustainability CentreMethod and ExecutionFigure 3.3 Guide presenting the Virtual Autopsy Table atVisualiseringscenterFigure 3.5 Petter constructs molecules in interactive installationat Visualiseringscenter CFigure 3.4 Oskar interacts with digital animals atVisualiseringscenterFigure 3.6 Petter uses haptic senses at VisualiseringscenterVisualisation centre C, NorrköpingVisualisation Centre C in Norrköping is an exhibition centre demonstrating how visualisation and interaction can beused to communicate different messages. The centre runs in cooperation with the University of Linköping and targetsthe broad public, students, and industry. All installations are interactive and present how new technology can enhancethe experience and understanding of different research topics.18
Oskar Karlsson, Petter PolsonMaster <strong>Thesis</strong> 2011 at Chalmers University of TechnologyMethod and ExecutionVisual Forum, GöteborgVisual forum is an annual fair for visualisation technology where companies present and showcase their products andpartake in seminars and workshops on different topics related to visualisation and communication.CIRED at Frankfurt Messe, FrankfurtCIRED is a leading forum for the electricity distribution community. Every second year it holds an internationalelectricity conference where companies in electricity distribution participate. The 2011 exhibition was held in FrankfurtConference Centre and focused on smart metering, smart grid, and management of an aging infrastructure.Figure 3.7 Oskar trying out 3D goggles at Visual ForumFigure 3.9 Petter trying interactive spherical screen at VisualForumFigure 3.8 Oskar in front of the Frankfurt Congress Centreduring CIREDFigure 3.10 Petter interacting with Siemens installation at CIRED19
Conceptual <strong>Design</strong> of Temporary Exhibition Platform and Smart Grid Exhibitionfor Siemens Urban Sustainability CentreMethod and Execution3.2.4 Market studiesTo learn about other similar exhibitions around the worldon the topic of smart grid a market study was performed.The following criteria were analyzed for the differentexhibitions:• Initiator• Location• Time frame• Description• Core messageThis can be done digitally, in e.g. word processingsoftware, or by cutting out sentences from an interviewtranscript paper and gluing them onto a piece of paper.The basic procedure would be this:A sentence or paragraph is cut out and put on a newpaper. Then a new sentence is cut out and placed on thesame paper, right next to the first one if the informationcontent or opinions expressed in that sentence matchesthe first sentence, or on its own if it relates to somethingcompletely different. These steps are then repeated untilall the sentences are gone through. You will now haveseveral different groups of sentences representing themain topics of the information content. These groups cannow be named and summarised and the sizes and interrelationsof the groups can be interpreted.• Target audience• Communication strategyThis resulted in a graphical box chart illustrating somesimilarities and differences between the differentexhibitions. The x-axis of the chart was rated frompublic to industry, the y-axis from information centred toexperience centred, and the different boxes position andsize represent whether the exhibition targets an industrialaudience or the broad public and if it uses an informationorexperience centred communication strategy.3.4 List of requirementsResult of the data analysis was translated into a list offunctions for the temporary exhibition and the outdoorexhibit. The functions were screened and questionedin order to make sure that overlapping functions orirrelevant or superfluous ones were removed. After thisscreening only the true requirements for the design wereleft and this list was then run through a KR-matrix inorder to weight the individual requirements against eachother.3.3 Data analysisAll the collected data was analysed with respect to eachdata type. Qualitative information from interviews,interaction observation studies, and literature, wasgenerally processed with a KJ-analysis. The quantitativedata, on the other hand, was translated into graphicaldiagrams that were then interpreted. The analysisresulted in a Communication Strategy document, a Listof requirements for the temporary exhibition platformand for the outdoor exhibit, and an Exhibition ContentDescription for the smart grid exhibition.3.4.1 KR-matrixA KR-matrix is a way to systematical assess the internalhierarchy of the requirements of a design. Everyrequirement is compared to all the other ones and asubjective assessment of which one that is more importantfor the product success is made. This results in a score foreach of the requirements which then can be translatedinto a weighting of the functions. See Results for weightedLists of requirements (See 3.4 List of requirements onpage 20) and Appendix for entire KR-matrices (SeeAppendix XII - Kr-Matrices on page 109).3.3.1 KJ-analysisThis method was developed by the Japanese anthropologistJiro Kawakita and is used to structure large amountsof qualitative data. The core idea of the method is to breakdown the information into smaller homogenous parts andthen rearrange them according to their interrelations.3.5 Idea generationBased on the list of requirements, extensive ideageneration was carried out. Several methods for thiswere utilized but some techniques were common for allof them.20
Oskar Karlsson, Petter PolsonMaster <strong>Thesis</strong> 2011 at Chalmers University of TechnologyMethod and ExecutionGoing through all of the requirements systematicallyand try to generate sub-solutions for each and every oneof them can be a good way of producing a wide range ofideas. By then focusing on the whole system completelydifferent ideas can be generated and this continuousshift of focus from single requirements versus the wholesystem is a useful technique.Another important aspect when idea generating is thelevel of abstraction. When raising the level of abstractionthe actual reasons and underlying causes for a problemor a requirement are considered, and solutions tothe problem are generated instead of just fulfilling arequirement. This way of thinking will generate quiteradical, but nonetheless new, ideas that might have beenmissed if keeping the level of abstraction too moderate.3.5.1 BrainstormingThis method aims to stimulate a group of people togenerate a wide range of ideas in a short period of time.Its strength lies mainly in the way it discovers new angleson existing problems and uses synergic dynamics withinthe group to generate radically new ideas. Therefore,the composition of the brainstorming team can be ofgreat importance. The guideline is to try and achieve agroup of participants with slightly different backgroundand possibly also a different relation to the subject forthe brainstorming. Open communication, free fromcriticism, is fundamental for the method to function anda positive, exploring mentality is recommended.There are several ways of executing the brainstormingconcept. A very common more chaos based way is tosimply, verbally and with sketches, try to generate as manysolutions to the problem at hand as possible. Anotherprocedure is to individually generate solutions, sketchthem onto a paper, and then pass it on to the next personwho will then continue to develop those ideas. Whicheverone of these proceedings you prefer, it is essential to keepa strict time plan for the session, e.g. brainstorming for20 min, then break for 5 min.Image boardAn image board is essentially a collage of pictures thatrepresent the expressions and/or colours, shapes, environments,etc. that the final project result should match.The image board can be said to be the result of the visualand expressional design analysis and is also an importanttool to ensure that consensus is met within the projectgroup concerning this. The image board can be usedas a mediating tool for brainstorming or general ideageneration and should generally be present at all creativeprocesses in the project.PersonaA good way of representing a products target audienceis by using a persona. The persona can consist of bothpictures and narrative relating to a desired user orcustomer’s daily behaviour patterns and features. Thepersona should use specific details, not generalities, andtry to induce a personal understanding of the representedtarget user group. As with the image board, the personashould be present at all creative processes and act as amediating tool for the idea generation to make sure thatthe ideas actually fit onto the target group.Osborn’s idea spursOsborn’s idea spurs, or SCAMPER, is a tool to aid andenhance the brainstorming technique. SCAMPERstands for: Substitute, Combine, Adapt, Modify/Magnify/Minify, Put to other purposes, Eliminate, and Rearrange/Reverse. These advices are meant to open up new waysof approaching the problem and looking at it a differentway. The word Substitute should for instance make youFigure 3.11 Petter giving presentation during brain storming workshopFigure 3.12 Participants of the brain storming work shop21
Conceptual <strong>Design</strong> of Temporary Exhibition Platform and Smart Grid Exhibitionfor Siemens Urban Sustainability CentreMethod and Executionconsider substituting part of your product/process/problem for something else. By looking for something tosubstitute you can often come up with new ideas.Work shopSeveral brainstorming sessions were held in the projectteam to generate solutions for the three main objectives;the temporary exhibition platform, the smart gridexhibition, and the outdoor exhibit. To also collect ideasfrom people with an external view on the project a brainstormingwork shop was hosted. Eight different peoplewith different backgrounds and interests (industrialdesign engineering and engineering physics) wereinvited to come and reflect on the three above mentionedtopics during 2 hours. After a brief explanation of theproject background and scope, the participants were splitinto two groups, equipped with pans and papers, andencouraged to generate ideas through four different 15min sessions.Session 1 concerned general exhibition ideas and thepersona discussed above was presented. With a high levelof abstraction the groups discussed general strategieson how to best communicate information to the targetaudience at hand. Different types of media technologyand didactical methods were discussed and assessed.can the concept be adapted to the target audience?” and“What representation and media technology can beused?” were some of the questions discussed.The last session was about the outdoor exhibit. The twogroups were asked to consider general ideas on displayingobjects in an outdoor setting as well as exhibits on thetopic of smart grid.Ideas generated at the work shop were used whendeveloping the different concepts for the smart gridexhibition and the outdoor exhibit. A transcript of theresult from the workshop can be found in the appendix(See Appendix XVII - Brainstorming workshop results onpage 115).3.5.2 Morphological matrixA morphological matrix is used to visually display thedifferent solutions for different requirements of a productproblem. By combining these solutions into concepts, asmany combinations of ideas as possible are considered.This method was applied to the macro structure ofthe temporary exhibition and different concepts withdifferent shape and number of stories was developed.At session 2 the topic of smart grid was introduced andexplained. Waiting with introducing the topic until afterthe first brainstorming session was a conscious decisionto try to avoid potential bias and rather produce untaintedideas. However, after this brief intro to the subject theparticipants were encouraged to generate ideas on how tovisualize the concept of smart grid and communicate thedifferent aspects of it to the target audience.Learning through games was an interesting conceptdiscovered earlier in the research and the third brainstormingsession in the work shop considered this. “How3.5.3 Concept generationThe final part of the idea generation process was tosummarize all the different ideas to get an overview andtry to detect patterns. To achieve this all the ideas weresketched onto post-it notes and put onto a large whiteboard. Utilizing the KJ-analysis principle, the post-itswere then ordered according to different criteria andgrouped into clusters. By picking post-its from eachgroup and combining them, different initial conceptsfor the temporary exhibition and outdoor exhibit wereFigure 3.13 Post-it wall during idea generation22
Oskar Karlsson, Petter PolsonMaster <strong>Thesis</strong> 2011 at Chalmers University of TechnologyMethod and Executionproduced. These were then evaluated and screened whichled to deletion of some of them and merging of others. Bycombining the most promising features, three conceptsfor the temporary exhibition and four concepts for theoutdoor exhibit were finally accomplished.3.6 Concept evaluationAfter generating the different concepts for the temporaryexhibition and the outdoor exhibit, these concepts neededevaluation. This was done with PUGH Matrices and by apresentation for the stakeholders.3.6.1 PUGH MatrixTo evaluate concepts and ideas in a structured way a PUGHmatrix can be used. When using the method, the conceptsare all compared to a reference object with respect tothe different weighted requirements. The total score foreach concept then decides which one of the concepts andthe reference object that fulfills the requirements to thelargest extent.This method was executed in four different heats. In thefirst one, the three exhibition concepts were comparedto Siemens exhibition at the CIRED fair in Frankfurt. Thiscomparison confirmed whether the new concepts weresuperior to an existing one concerning the list of requirementsfor the project. For the other three heats, theconcepts were compared to each other. The result of thisevaluation showed which one of the three concepts thatshowed the most potential.3.6.2 Stakeholder feedbackThere are different ways to collect feedback from thestakeholders of a project. In this project a concept presentationwas given to a stakeholder group after half of theproject time period. The presentation was complementedwith a survey.The three concepts for the temporary exhibition andthe four ones for the outdoor exhibit were presented toa panel of project owners and other Siemens personnelat Siemens UK’s headquarters in London. The conceptsall represented different approaches to the designs andwere quite radical in their layout. The main reason forthis decision was to show the panel several different opportunitiesand to give them the chance to pick out theirfavorite features from each one of the concepts.Concept surveyTo structure the feedback from the concept presentationthe participants were asked to fill in their opinions on eachof the concepts into a survey (See Appendix XIX - Conceptsurvey on page 120). The survey consisted of picturesand short paragraphs describing all of the concepts andtheir content and had text box areas for input. The surveywas distributed digitally as an interactive PDF form.The opinions from the survey are analysed in the Resultsection (See 4.4 Concept evaluation on page 43) and atranscript of the result can be found in the appendix (SeeAppendix XX - Concept survey Results on page 128).3.7 Concept developmentAfter receiving feedback from the Project owners,other Siemens personnel, and the architects, the threetemporary exhibition concepts were merged into a finalone. All the input regarding exhibition content as well asits general design was taken into account which made iton a more detailed level than before. Also, after feedbackon the location of the exhibition, the most suitablespace for it was decided. This space was then outlined,scale 1:1, in a big atrium for spatial studies. By walkingaround and getting a feel for the available space and experimentingwith creating sub-spaces and corridors thefinal exhibition layout was developed. The temporaryexhibition platform design was then modelled up in CADsoftware and defined further. By placing the design intoa CAD model of the centre (provided by the architectfirm) further adjustments of size and placement could beperformed.Concept presentationsThe purpose of presenting concepts to stakeholders isto gain feedback on the ideas on different levels. To getopinions on the concepts as a whole, as well as on certaindetails of the designs, it is meaningful to present a widevariety of designs.23
Conceptual <strong>Design</strong> of Temporary Exhibition Platform and Smart Grid Exhibitionfor Siemens Urban Sustainability CentreMethod and ExecutionFigure 3.14 Trips to Nürnberg, Berlin, Erlangen and London24
Conceptual <strong>Design</strong> of Temporary Exhibition Platformand Smart Grid Exhibitionfor Siemens Urban Sustainability Centre4. Results andanalysisThe result section follows the same structure asthe Method and Execution part of this report.Results from the data collection, data analysis, ideageneration, and concept development are describedand analysed. Parts of the data, such as interviewtranscripts, are summarised in this section, while thecomplete data is presented in the appendix.25
Conceptual <strong>Design</strong> of Temporary Exhibition Platform and Smart Grid Exhibitionfor Siemens Urban Sustainability CentreResult and Analysis4.1 Data collectionThe data collection is divided into literature studies, userstudies, observation studies, and market studies. Theresults are listed and analysed below.4.1.1 Literature studiesThe results of the literature studies on smart grid arepresented in the Theory section of this report. The theoryon experience design and designing for emotions isdiscussed and analysed below.<strong>Design</strong> theory analysisEmotions affect our reasoning and actions and it istherefore important to consider them in all types ofproduct design. If a certain product induces a morepleasant emotion than its competitors, this mightmake the buyer choose it over a similar product. Thesetheories are assumed to also apply to exhibition design.Visitors leaving the exhibition with a positive feelingabout the experience and Siemens approach to the smartgrid concept will be more prone to engage further withSiemens.Product experience and emotional design are very closelylinked. When designing to induce certain emotions, theentire product experience must be taken into account.The aesthetical experience needs to be considered inevery aspect; from colours, surface finishes and textures,to pictures, movies, sound effects, interaction, etc. Everyvisitor will attribute different meaning to the differentelements of the exhibition depending on background,personality etc. It is therefore crucial to try to define thetarget user group so that the exhibition and its contentcan be adapted to induce the desired emotions within thisgroup. All these aspects of the human-product interactionneed to be considered and it is the whole system ratherthan specific explicit design cues that will induce theemotional response.The circumplex model (See Figure 2.2 Circumplexmodel of core affect on page 11) of core affect offersa structured way of defining emotions and should betaken into account when designing the exhibition and itscontent. Active and pleasant emotions such as curiosity,inspiration and fascination might be beneficial in someparts of the exhibition, whereas more calm affectivestates, such as relaxed and satisfied, will be preferred inothers.4.1.2 SeminarsThe seminars on exhibition design and smart grid thatwere attended at Visual Forum and Elfack is summarisedand analysed below. Full transcripts of the seminar resultcan be found in appendix (See Appendix V - Seminartranscripts on page 88).Analysis of seminars at Visual Forumregarding exhibition designBy incorporating a game aspect to an exhibit, the userwill participate more actively and be more emotionallyengaged, thus learning more about the topic. It isimportant to be aware of what pedagogical setup andvocabulary that is used in order to target the rightaudience. Just like the content and the technology,the pedagogical perspective plays a big role in everyexhibition. To actually induce “action” is an importantpart of the communication that needs to be considered inthe concept for the exhibition.Using historical persons can be a good way to put thingsin perspective. To look at people instead of technologycan illustrate how things have evolved. Paradoxical waysof presenting information (e.g. comic book style graphicsto show science) attracts attention.It is important to induce positive emotions and avoida feeling of hopelessness when communicating andeducating. The use of non-logical (purely aesthetical)visual, audible or tactile elements can enhance messagesand create the right atmosphere. User involvement andthe possibility to change and affect content make peoplemore engaged, especially if combined with the “recognition-factor”e.g. being able to affect your own city in anexhibition simulation.Analysis of seminars at Elfack regardingsmart gridSmart grid has become a fast growing area for research,technology development, and political discussions inthe last couple of years. It has become the brand namefor the change that is happening, and is needed in theelectricity grid to maintain a balance between productionand consumption when a higher capacity from renewablesources will be incorporated.The biggest focus in Europe today is how to integratemore wind power in the energy mix and to facilitate thetransition towards an electric vehicle fleet. At the sametime, major investments are needed to upgrade theelectricity grids worldwide in order to meet a higher26
Oskar Karlsson, Petter PolsonMaster <strong>Thesis</strong> 2011 at Chalmers University of TechnologyResult and Analysisdemand. Due to the energy situation and the existinggrid, the necessary investments vary for different partsof the world.Smart grid technology will enable new actors, such assmall scale producers and new energy service providers,to enter the electricity market. New market solutions areneeded to cope with the changes and to ensure necessaryinvestments in the grid.Technology development itself is not a bottleneck; theproblem is how to get people to use the technology. Otherbottlenecks are lack of standards in the industry, whichslows down development and integration of the newtechnology, and unclear political steering.Interviews with Siemens personnelA selection of the results from interviews with Siemenspersonnel are presented below. Complete interviewtranscripts can be found in the appendix (See AppendixVI - Interview transcripts on page 92).Siemens in generalSiemens is an honest, trustworthy and practical company.It only presents real data and does not promise things itcannot keep. “Tomorrow is today” was a slogan Siemensused in an earlier exhibition which corresponds to themessage; Siemens is not predicting the distant future butcan provide the right tools and solutions today.Siemens core values are:4.1.3 User studiesThe results from interviews and questionnaires used inthe project are listed below. The interviews are dividedinto those with Siemens personnel and those with othersthat have helped with guidance in this project.••Employees – brain power••Excellence - technology••Innovation - technology••EfficiencyFigure 4.1 Electric vehicle demonstration at Siemens Academie in Berlin27
Conceptual <strong>Design</strong> of Temporary Exhibition Platform and Smart Grid Exhibitionfor Siemens Urban Sustainability CentreResult and AnalysisSmart grid messageThere is a paradigm shift in electricity generation betweenthe 20th and the 21st century. More renewable energysources replace fossil energy which will bring change toelectricity transmission and distribution. The load willfollow power generation, instead of the other way around,and the current chain model for electricity distributionwill be more complex. An increase in renewable energyand load shifting are examples of drivers for smart griddevelopment. Others are the need for efficiency andreliability in the grid. Bottlenecks in the developmentof smart grid are the need for new infrastructure andnew global standards among electricity generatorsand distributors, but also that people’s mind set has tochange. However, there is no need to wait for smart griddevelopment to happen. Siemens has the solutions today,and not just as a “good provider” of smart grid products;Siemens want to present themselves as “THE company” inthe smart grid field.The exhibition in generalThe temporary exhibition is more business oriented thanthe permanent exhibition. It will be placed in a highersecurity area and target a more specific group of visitorssuch as decision makers and buyers of Siemens productsand systems. However, the broad public should not beexcluded from the temporary exhibition. The exhibitionwill be part of a bigger package with conferences, performancesetc. The way of presenting information must beflexible in order to simplify updating the content. Newcase studies and products will be developed, and they willneed to be included in the exhibition once it is completed.An exhibition designer has only 20 seconds tocommunicate the core message of an exhibition. It istherefore important to create a “wow-effect” and thencommunicate the content instead of the other way around.After the visitor’s attention is caught, a story is needed toevoke emotions. Interactive installations work well, evenon business-visitors, and are important to the exhibitionto achieve engagement. By including challenges or competitionsthe visitors will be more engaged in the learningprocess, and there is no “age limit” to play games.Smart grid specific exhibitionImportant actors in the smart grid field can be foundthroughout the whole energy chain; from power generatorsto transmission and distribution system operators, toaggregators, city planners, and consumers. Siemens canprovide both smart grid products and services to all ofthese actors. Starting from the customer’s perspectivewhen presenting product can be an effective strategy.If asking the question “What was the challenge?” onecan emphasize what results Siemens’ solutions actuallybrought to a certain case study. By creating this clear linkbetween the solutions and the cases, the effectiveness ofthe products is communicated in a more tangible way.Important products in the Siemens portfolio are DEMSand the Smart Grid Compass.Interviews with non Siemens personnelA summary of the results from interviews done with nonSiemens personnel during the project is presented anddiscussed below. The complete transcript can be found inDEMSDEMS stands for Decentralised Energy ManagementSystem and is Siemens software thatmonitors and optimises an energy system. DEMS canbe used to control the energy production and consumptionin any system from a house to a wholecity with utilities as typical customers.28
Oskar Karlsson, Petter PolsonMaster <strong>Thesis</strong> 2011 at Chalmers University of TechnologyResult and Analysisthe appendix (See Appendix VI - Interview transcripts onpage 92).Exhibition techniquesIn order to create interest, it is very important that anexhibition “tells a story”. The different exhibits need tobe connected and relate to each other in a relevant way.Interaction is another important topic to consider foran exhibition to attract and maintain attention from thevisitors. People stay longer at the exhibit or installationand get more involved and engaged when they caninfluence the content. Interaction is important regardlessof the target group, it works for all ages, professions etc.Description of innovative technologies for interactiveexhibits:• Multi touch tables – A large touch screenoriented as a table that users can gatheraround and interact with. It is a suitable tool formediating discussion whereas all the users areequal in the sense that they can all participate inthe interaction.• Object recognition – The multi touch tablesdescribed above can be used together withphysical objects that are placed on it. The tablecan recognize predefined objects, identifywhere the object is placed, in what direction it isoriented, and interact with it.• Motion control system – This type of technologycan e.g. be found in different gaming consolesand uses cameras, accelerometers and sensorsto detect motion. The user’s movements are continuouslyregistered which enables touch freeinteraction.• 3D video – By using 3D video spectators can geta thorough understanding of the spatial aspectsof a concept and complex problems can be bettercommunicated and discussed. A 3D movie alsoeffectively catches the attention of the viewer.• Projection mapping – This technology utilizesprojection of images or movies onto irregularsurfaces to create optical illusions. This can e.g.be used to add effects and atmosphere to theenvironment of the exhibition.Smart gridActors in the smart grid development:• Producers – can be large and small, global andlocal.• Venture capitalists – new actors that invest inprojects.• Equipment constructors – building e.g. windmills. Find new niches or adapt existing.• Producers of smart home equipmentSmart grid compASSThe Smart Grid Compass is a Siemensdeveloped tool for tailor-made smart griddevelopment. Since the energy systems andelectricity grids worldwide differ a lot there are noone solution that works in all situations. The stepstowards the smart grid vary and each projectneeds a unique solution. Siemens thereforeprovides consultants who can assessthe situation and provide solutions.29
Conceptual <strong>Design</strong> of Temporary Exhibition Platform and Smart Grid Exhibitionfor Siemens Urban Sustainability CentreResult and Analysis• Aggregators – gathers information from different electricity generators for distribution.• Users – can be “prosumers”, i.e. both producing and consuming electricity.Bottlenecks in the smart grid development:• Standards – the government should involve in large infrastructure investments. In this case, standards areneeded to get technology development instead of the other way around.• “Technology lock-in” – people are locked into old ways of thinking, fresh ideas are needed. Smart grid is a newtechnology area and can be a way to get new ideas into an old business.Analysis of interviewsSiemens wants to be presented as the major smart grid technology provider. The temporary exhibition can be moreSiemens oriented than the permanent one in the centre and the aim is to promote them to potential customers.Siemens is a very large and broad company with competence and products throughout the entire energy chain, and thisshould be apparent in the exhibition. At the same time Siemens is realistic, does not want to give promises that cannotbe met, and cares about its trustworthiness.Smart grid products are available today and the technology development is no bottleneck, even if there are challenges.Fresh ideas and a change in people’s mindset are needed for smart grid development to happen at the same time asstandards are being set to facilitate the construction of the new infrastructure.The exhibition should be mobile and flexible to be adaptable to changes in the content and context. It is important tocatch the attention of the visitors quickly and keep it by having a story in the exhibition. Interactive installations areimportant to enhance the experience. Interaction induces engagement and work on all different user groups.Results from questionnaireThe questionnaire (See Appendix X - Questionnaire on page 105) was distributed at the Elfack fair to get a clearerview of what knowledge people in the electricity-related field of business have regarding smart grid development. Theresults from the questionnaire are presented in diagrams below. For each diagram there is an analysis of the results;whether they were anticipated or not and how they can be used in the design of the smart grid exhibition.67%Q1. What do you include in the concept of a Smart Grid?83%75% 75%75%67%8%17%33%17%There were several alternatives that received a high score on the question what to include in the smart grid concept.Renewable energy got the highest result which claims that the participants see the smart grid as an enabler for morerenewable energy sources in the energy mix. Most people rejected the alternatives “A new kind of electricity” and “Anew way to transport electricity” which suggests that they have understood what smart grid is not about. The mostQ2. How will the Smart Grid emerge?92%30
Oskar Karlsson, Petter PolsonMaster <strong>Thesis</strong> 2011 at Chalmers University of TechnologyResult and Analysissurprising number is perhaps the low result for “Energy security” which only a third of the participants suggested isincluded in the smart grid concept. Perhaps this is because energy security is not a big issue in Sweden compared e.g.the USA and therefore is not seen as a major driver for smart grid development. The benefits of a smart grid for a securesupply of high quality electricity can be emphasised to increase this awareness.Q2. Q2. How How will will the the Smart Smart Grid Grid emerge? emerge?92%92%8%8%The Smart Grid depends on new The Smart Grid is an evolution ofThe Smart Grid depends on new The Smart Grid is an evolution ofdiscoveries that enables a the existing electricity- anddiscoveries that enables a the existing electricity- andrevolution of the electric grid. communication grids.revolution of the electric grid. communication grids.A strong majority of the participants saw the smart grid development as an evolutionary process rather than revolutionary.This indicates that most people in the business are aware that smart grid development is already taking place andthat the technology and market solutions necessary will keep developing in the future.Q3. Q3. The The benefits benefits of of a a smarter smarter grid grid are are said said to to be be numerous. numerous.Which Which ones ones do do you you consider consider more more important? important? (Average) (Average)2,82,83,33,3 3,23,2 3,13,13,423,42Provide a saferProvide a saferelectricity supplyelectricity supplyEnables electrification Improve energy qualityEnables electrification Improve energy qualityof the transportationof the transportationsectorsectorImprove energyImprove energyefficiencyefficiencyEnable expansion ofEnable expansion ofrenewable energyrenewable energyproductionproductionThe answer set to the question of benefits with a smart grid is spread evenly over the alternatives. The possibility tochange the energy mix into more renewable sources and to change the vehicle fleet into electrical were the most popularalternatives but the other answers were also common. This indicates that it is hard to identify one specific smart griddriver that is more important than others. Most people seem to value the many advantages with a smart grid rather thana certain benefit.Q4. Which do you believe to be the main bottlenecksin developing the Smart Grid? (Average)2,73,52,433,25New marketmodels need to bedeveloped to speedup investmentsTechnology andproducts need tobe developedThere is a lack ofpoliticalincentitives andregulations tosupport thedevelopmentThere is a lack ofinterested amongthe consumers tochange theirelectricity usage.New standardsneed to bedeveloped31
Conceptual <strong>Design</strong> of Temporary Exhibition Platform and Smart Grid Exhibitionfor Siemens Urban Sustainability CentreResult and AnalysisOn the question of bottlenecks in the smart griddevelopment the answers were pretty evenly spread outbut some patterns could be noted. The most popularanswer indicated that it is a question of developingnew technology and products rather than creatingthe necessary market models and getting the politicalregulations in place. This is surprising because the peopleasked all worked in the energy business and could beanticipated to have faith in the technology. By presentingthe technology that is here today and show that existingsolutions can be used in the smart grid development, thisattitude might change.4.1.4 Observation studiesThe studies resulted in a number of qualitative observations.A short selection of observations is presented belowand a full transcript of these observations can be found inthe appendix (See Appendix VII - Qualitative Observationstudies on page 98). After the observations, a KJ-analysisof the results from the qualitative studies follows. Thequantitative study at Elfack is presented on a separatesheet in the appendix but analysed in this section.Universeum, Göteborg, 2011-03-30All the decoration, furniture, lighting and music etc.worked together and created a sense of a whole. Thisadded to the experience. Enclosed environments aroundinstallations made it easier to focus on the exhibits. The“creepy” interior and framing of one of the installationscreated a lot of anticipation and excitement. It was veryobvious that something scary was going to happen but itwas not clear exactly what.At one installation the user got to act as a reporter andrecord a weather forecast that was shown on a TV screenafterwards. This installation was very appreciated andengaging. It was fun to get to act as a famous person andthen see the result on a TV screen. The users wanted tolook and talk exactly like the real TV reporters whichtriggered competition and engagement.Figure 4.2 Well thought through interior design and lighting at Universeum, Göteborg.32
Oskar Karlsson, Petter PolsonMaster <strong>Thesis</strong> 2011 at Chalmers University of TechnologyResult and AnalysisThe Göteborg museum of Natural History,2011-04-20A huge model of the killer whale attracted interest fromthe visitors. Its big sculptural forms fascinated and werebeautiful to look at. Big, macabre, scary,“disgusting or in other ways bizarreexhibits fascinated, attracted attentionand got a lot of viewing time. 3D-objectsenhanced the spatial experience andgave depth to the exhibits. To see theanimals in their context was interestingand added to the understanding. Puttingan image or a painting behind an exhibitcreated a sense of depth which made you feelas if you were actually there yourself.Not many interactive displays were used, but at one placethere was a shark the visitors could touch. Touching thesharkskin was interesting and the feel of the texture onyour fingertips gave a more vivid experience.An exhibit about smaller birds was perceived as verycluttered. They had jammed very many birds in the samecabinet which made it hard to focus on a single one. Thiswas a shame since they were all very interesting andunique. It was hard to follow the “story” and focus onitems if there is no clear “red thread”.Visualisation Centre C, Norrköping,2011-04-28From interacting with the installations and observingother visitors during the tour in the centre a number ofobservations were made. A selection of these is listedbelow and the full observation result is presented in theappendix (See Appendix VII - Qualitative Observationstudies on page 98).Lego cityThis installation visualised the city of Norrköping in whiteLego. By projecting different colours on houses, riversand streets, different messages could be communicated.This enabled several “layers” of information in the samemodel which made it more space efficient.Since the visitors recognized the city, they became moreengaged in the exhibit and listened to the informationpresented by the guide more carefully. It would beinteresting to use something similar with London in theUrban Sustainability Centre.Interactiveinstallationscan be bothspectacular andplayful- Discussions atVisualisation Centre CNot all messages that were communicated came across asintended. Different messages require different means ofcommunication.The food on the tableThis was a multi touch table installation thatshowed what climate effect different typesof food have. The user got informationabout the food by placing paper discs“with illustrations, which represented acertain food type, on the table.By combining the digital screen withphysical objects the users got moreinvolved in the interaction process. To haveto physically pick up and place the paper disc on the tablewas intuitive and at the same time encouraged actionfrom the user.The exhibit was easy to understand and use for first timeusers and worked smoothly. Other types of objects couldhave been used instead of the paper discs, such as modelsof buildings or power plants etc.Archaeology gameIn this computer game the users were encouraged todig for fossil. If the player managed to find three fossilsbefore the time ran out, the player then got to answersome question about the animal, whose remains werefound, and then earned a medal.The game targeted children but highlighted the fact thatplayfulness and challenges can be a powerful tool whenpresenting information.Visual Forum, 2011-05-03The observation studies at Visual Forum resulted innotes on the different installations regarding the content,technology used, and its popularity. These results arelisted in the appendix (See Appendix VII - QualitativeObservation studies on page 98) and summarised here.Having a large or in other means prominent attractorhelps to catch the attention of the visitors. By enclosingthe installations with rollups or walls, the attentionwas kept for a longer period of time. The popularity ofthe installations increased when interactive exhibitswere used. By letting the visitors test the technologythemselves the interest in the product and companyincreased. Showing high-tech 3D technology and eyecatchingmovies also caught the visitors’ attention andcreated interest. Showing 3D scanned virtual images of33
Conceptual <strong>Design</strong> of Temporary Exhibition Platform and Smart Grid Exhibitionfor Siemens Urban Sustainability CentreResult and Analysisa well know location created a feeling of familiarity andmade the visitors curious of knowing more about thetechnology. Give-aways were appreciated by visitors andmade many people stop at installations which otherwisehad few things to attract attention with.KJ-analysis of the qualitative observationstudy resultThe results from the three qualitative observation studieswere KJ-analysed and gathered into the categories listedbelow. For each category some conclusions are madeand these conclusions are further developed in theExhibition <strong>Design</strong> Strategies for Successful Communicationdocument in the Final Concept section of this report.Attract attention and create interestAn exhibition must first attract the attention of the visitorto get a chance to communicate messages. This can bedone with an attractor that draws the attention of the userand focuses it on the topic of the exhibition.Exhibition structureTo maintain the users’ attention throughout an exhibitionit is important to tell a story and the structure, and howthe exhibition is organised needs to support this. Theuser should immediately get a clear picture of the topicof the exhibition, and an overview should be presentedbefore detailed information.Aesthetics and interior designThe aesthetical impression of an exhibition is important.It needs to work as a whole to create the right atmosphere,and at the same time all details need to match the rest ofthe exhibition to keep a harmonized experience.Interactive experienceUsing interactive objects and letting the user participatein a game or challenge increases the interest and createsemotions. Through interaction that appeals to all senses,the experience can be both more fun and engaging and atthe same time more informative for the user.Evoke emotionsOne of the main objectives with the exhibition is to makethe visitor feel the desired emotions to complement theinformation message.Installation solutionsInformation needs to be communicated in a way thatfacilitates learning and if objects and products are beingpresented, they should be placed in their context to makeit easier for the user to relate to them.Quantitative observation study at ElfackThe observations from the Elfack fair were summarizedinto a 13 by 16 matrix with the different companies/exhibits on the one axis and the different aspects thatwere observed on the other. Features like size, popularity,interactive objects, colour scheme, personnel, giveawaysetc. (See Appendix VIII - Quantitative observation studyon page 102) were studied. The different cells were thencolour-coded with respect to the degree of impact it wasconsidered to have on the exhibition’s popularity.InterpretationThe analysis shows that the following are very importantfeatures for a successful exhibition:Installations that visitors can interact with (e.g. buttons,touch screens, heat cameras, actual products that you cantouch and try) appeal to people’s curiosity and attractpeople to the space. By combining this with a game ora challenge (e.g. arm wrestling, ball games, computergames etc.) it also appeals to the audience’s playfulnessand/or competitiveness which attract even more attention.The exterior and interior design of the exhibit is animportant communication tool. The first thing that theaudience will see when approaching the exhibit is theattractor. If this is placed in a position for increasedvisibility and if it is designed in a way that generatesemotions such as surprise and curiosity (impressivescreens, appealing design) it will attract visitors. Thenext thing that the user will pay attention to is the overalldesign of the exhibit. If the colour scheme, surfacefinish, lighting, placement of the installations etc.harmonise with the company’s brand and the content ofthe exhibition, the exhibition will be perceived as wellthought through and thus interesting.Some exhibits aspired to create environments thatthe user would recognise from other contexts (e.g.living room, beach bar, hard ware store). This playfullyconflicting experience (e.g. having a sandy beach insideof a fair) creates surprise and interest and attracts people.By incorporating a calm café area into your exhibit yougive the visitors the opportunity to escape the hystericalenvironment of the fair for a while and enjoy a cup ofcoffee or tea and a nice relaxing experience.Other giveaways in the form of food were also extremelypopular. The exhibits that offered e.g. hamburgers wereconstantly very crowded. A trade show involves a lot ofwalking and taking in new impressions which consumesquite a lot of energy and thus making the visitors34
Oskar Karlsson, Petter PolsonMaster <strong>Thesis</strong> 2011 at Chalmers University of TechnologyResult and Analysishungry and constantly on the lookout for free hot dogs,sandwiches, coffee, beer, wine etc.Another very important ingredient of the exhibit is thepersonnel. Not only do they need to aesthetically matchthe rest of the exhibition but also provide service andknowledge to the visitors.4.1.5 Market studyThe results from a market study comparing four othersmart grid exhibitions is shown below, followed by ananalysis of the results.The Magic BoxInitiator: The State Grid Corporation of ChinaLocation: Shanghai World ExpoTime frame: May 1– October 31, 2010Description: Fair exhibition. A metallic square buildingwith a crystal cube embedded inside. The box is made upof 112 pieces of LED panels, 14.9 meters wide and 13.9meters high.Core messages: The movie told a four-minute storyabout comfortable future life made possible by intelligentpower systems. Visitors experienced three stages; first“meet with” the electricity, “get to know” and further be“intensely linked” with electricity. From video screeningsvisitors could also learn how the State Grid meetselectricity needs of a vast country like China.Target Audience: Visitors of the Shanghai World Expo.The broad public.Communication strategy: The visitors were invited tostand at the centre of a 20-meter-high cubic theatre withsix screens covering the walls, ceiling and floor. Thesepowerful audio and visual experiences aimed to give thevisitors intense sensations like e.g. surfing in the sea andbeing engulfed by waves, or standing on a cliff and thendropping.(http://en.expo2010.cn/c/en_qy_tpl_107.htm)Grid IQ Experience CentreInitiator: General ElectricLocation: Atlanta, Georgia, US.Time frame: Opened January 20, 2011.Description: Interactive Experience CentreCore messages: Present GE’s company-wide commitmentto solving customers’ challenges in innovative ways withmore efficient, reliable and sustainable energy solutions.Educate and inform about the global energy landscapeand the GE technologies modernizing the electrical grid.Create understanding for smart grid solutions and theirpotential to change how power is generated, deliveredand consumed. Showcasing how utilities, regulators andconsumers can enact measures simultaneously to achievea greater degree of energy efficiency.Target Audience: Utilities, consumers, regulators andpolicy makers.Communication strategy: iPad-guided tours that visitorscan take. The centre also features in-depth technical demonstrationsto help educate utility engineers.(http://www.gepower.com/about/press/en/2011_press/012011.htm)Siemens Smart grid tourInitiator: Siemens U.S.Location: Visiting a selection of U.S. states.Time frame: April 22 to December 2, 2011.Description: Road show consisting of a semi-sphericalrigid construction picturing the earth.Core messages: Siemens provide cutting-edge smartgrid solutions which can help meet tomorrow’s growingdemand for power and bring smart generation and smartbuildings a step closer. The tour also displays the latestin Smart Grid developments, standards, and industrytrends, showcases unique solutions and presentspreviews of future innovations.Target Audience: Industry and authority; utilities,governments, and technology and service providers.Communication strategy: Spherically projected video.Interactive learning through educational sessions,networking with other leaders in the industry, consultationfrom industry experts and debates on the future ofSmart Grid.35
Conceptual <strong>Design</strong> of Temporary Exhibition Platform and Smart Grid Exhibitionfor Siemens Urban Sustainability CentreResult and Analysis(http://www.smartgridtour.com/)ABB Smart Grid Centre of ExcellenceInitiator: ABB U.S.Location: Raleigh, North Carolina, U.S.Time frame: Opened September 22, 2010.chosen to mainly target industry and employ a moreinformation centred approach to the communicationstrategy. The Magic Box, on the other hand, encompassesmore experience oriented features and focuses ontargeting the broad public. The upper right quadrant isquite empty indicating that there is a gap in the marketfor experience centred exhibitions that target industry.Description: Technology and demonstration centredevoted to smart grid development.Core messages: The centre will include a testing anddevelopment laboratory, a verification centre to certifycustomer solutions before deployment and showcaseABB’s smart grid technologies and collaborativepartnerships.The magic BoxExperienceTarget Audience: Industry and public.(http://www.smartgridexpo.jp/en/About-INTL-SMART-GRID-EXPO/About-INTL-SMART-GRID-EXPO/)AnalysisThe four different smart grid centres’ similarities anddifferences where visualized in a market positioningmatrix. The position along the x-axis denotes whetherthe target audience group is mainly the broad publicor industrial actors. Each centres positioning on they-axis indicates if the communication strategy chosenis experience or information centred. The matrix showsthat the centres sponsored by Siemens, ABB and GE havePublicSiemens Smart Grid TourGrid IQ Experience CentreABB Smart Grid CentreInformationFigure 4.4 Market study matrixIndustryFigure 4.3 Siemens Smart Grid Tour 201036
Oskar Karlsson, Petter PolsonMaster <strong>Thesis</strong> 2011 at Chalmers University of TechnologyResult and Analysis4.2 Data analysisThe analysis part of the project resulted in an ExhibitionContent Description that contains the actual informationthat needs to be communicated in the smart gridexhibition, a list of requirements on the temporaryexhibition and the outdoor exhibit, and a communicationstrategy to be used in the exhibition.4.2.1 Exhibition Content DescriptionThe Exhibition Content Description is a sheet thatexplains the content information in the exhibition. It isdescribed below and the complete version is presentedin the appendix (See Appendix I - Exhibition ContentDescription on page 74). The content of the exhibitionwas divided into five parts; background, benefits andchallenges, actors and markets, road to a smart grid, andcases and solutions.BackgroundThis works as an introduction to the topic of smart grid,gives a historical background, and presents the energysituation in the world today. The concept of smart gridis defined from a technology perspective as well asfrom what challenges that must be solved with the newelectricity grid. The different drivers for smart griddevelopment are presented and differences around theworld are discussed.Even though most visitors to the temporary exhibitionwill have a good knowledge of the topic, it is necessaryto get a mutual understanding of what smart grid isaccording to Siemens and why it is being developed.Benefits & ChallengesThis part focuses on comparing the new smart grid withthe existing electricity grid. The differences are presentedin a BOCI-graph with Benefits/Challenges on the y-axisand Opportunities/Issues on the x-axis (See Appendix XI- BOCI Analysis on page 108). By representing new possibilitieswith a smart grid with a bubble in this graph, thecomplexity of the development is illustrated.Actors & MarketsThe idea of this part is to illustrate how and where differentactors are involved in the development of a smart gridand how their roles can change. From new technologyand market solutions, new actors may enter the energymarket and new business opportunities will evolve.The purpose is to induce discussions among the visitorsby presenting their parts in the system and to have theminterested in taking part of the smart grid development.One important message is: If you do not act today, othersmay come and take over.Road to the Smart GridIn this part the path towards a smart grid is discussed.What steps that are needed depend on the situation inthe energy system today and the shape of the existingBOCIBOCI stands for Benefits, Opportunities, Challenges,and Issues and is a graphical representationof new conditions when developing new technologyand products. The BOCI-analysis is similarto a SWOT-analysis but focuses on positivechanges.37
Conceptual <strong>Design</strong> of Temporary Exhibition Platform and Smart Grid Exhibitionfor Siemens Urban Sustainability CentreResult and Analysiselectricity grids. This differs a lot around the world andthere are few general solutions that work everywhere.Temporary exhibitionRequirementWeightThe message is that all smart grid projects are unique andthat Siemens have the capacity and knowledge to analysethe situation and provide the right solutions.Cases & SolutionsThis part presents smart grid projects Siemens hasperformed and contains information about what productsSiemens can be provided. However, the content will haveto be updated and complemented by Siemens whenadditional smart grid projects have been completed andnew products developed.4.2.2 List of requirementsBy analysing the results from literature studies, studiesat other exhibitions, seminars, interviews, etc., lists ofrequirements for the temporary exhibition concept aswell as the outdoor exhibit was made. The different requirementswere weighted against each other so that aprioritised list was constructed.To elicit emotions in the exhibition, to inform about thetopic, and to inform about Siemens’ solutions related tothe topic, are the three requirements that received thehighest score on the list. Other important requirementsare to tell a story, induce discussions, be innovative andat the same time keep the flexibility of the exhibition.Some of the requirements are related to each other, e.g. toprovide interaction and induce discussions are good waysto engage the visitors, and telling a story is an importantpart of eliciting emotions. Some less important requirementsare to facilitate maintenance and to make surethat the exhibition design fits in any Siemens building.The lower scored requirements are not prioritised in theconcept development.Elicit emotions 5Inform about the topic 5Present Siemens Solutions 5Tell story 4Induce discussions 4Engage visitor 4Be perceived as innovative 4Maintain visitor's attention 4Feasible design 3Intuitive understanding for first time users 3Facilitate content flexibility 3Provide interaction 3Allow mobility 3Reliable operation 3Relate information content to context 3Catch attention 3Express innovation/futurism 2Adapt content 2Allow flexible placement 2Express Siemens core values 2Relate design to context 2Deepened functionalities for experienced users 1Fit into Siemens facilities 1Facilitate maintenance 1Figure 4.6 Weighted list of requirements - Temporary exhibitionOutdoor exhibitRequirement Notes/Limits WeightEvoke interestAround the USC and/or Smart Grid.Target audience: Broad Public.People walking by and/or driving by and/or flying over.3Withstand weather Rain, snow, and storm proof. 2Relate to context Building, garden and other outdoor elements. 2Withstand vandalism 1Figure 4.5 Weighted list of requirements - Outdoor exhibit38
Oskar Karlsson, Petter PolsonMaster <strong>Thesis</strong> 2011 at Chalmers University of TechnologyResult and Analysis4.2.3 Communication strategyThe communication strategy can be divided into threemain pillars; the information content, the didacticalmethod, and the media technology. The informationcontent is presented in the Exhibition Content Descriptionsummarised above and the media technology anddidactical method are described below.DidacticalmethodInformationcontentMediatechnologyFigure 4.8 Model of communication strategyMedia technologyThe media technology is the toolbox of input and output technology devices that are available when designing anexhibition. A mind map of different media technologies was constructed (See Appendix IX - Media Technology toolboxon page 104) to get an overview of the different technologies and devices that were considered in the exhibition designprocess.Information Attention Engagement Experience EmotionDidactical methodcontentFrom analysing the research results, a didactical method that discusses how to communicate a message in an exhibitionwas developed. The method divides the didactical process into five steps shown in the picture below. The ultimategoal with the exhibition is to induce action from the visitor, either by investing in Siemens products or by taking otherinitiatives related to the development presented in the exhibition. To inspire action the first thing that is needed is toDidactical Mediaattract the visitor’s attention and make him/her interested in the topic. The next step is to get the visitor engaged in themethod technologyexhibition and give him/her an experience. This experience will, if composed skilfully, elicit emotions Story within the visitorand these emotions will in turn lead to action. Throughout the exhibition the learning process must be supported by astory that is consistent and captivating.Attention Engagement Experience Emotions ActionsStoryConfidenceExcitFigure 4.7 Didactical method for temporary exhibitionImportanceInterestExcitement39
Attention Engagement Experience Emotions ActionsConceptual <strong>Design</strong> of Temporary Exhibition Platform and Smart Grid Exhibitionfor Siemens Urban Sustainability CentreResult and AnalysisThe exhibition design and content should also be created to elicit emotions according to a certain profile. The firstthing the visitor should feel is interest in the topic and Story exhibits. After creating interest in the exhibition a feeling ofimportance should be communicated to maintain the visitor’s attention. The next emotion to elicit is confidence so thatthe visitors will feel secure that Siemens can provide the necessary solutions to the important challenges presented inthe exhibition. Finally, the visitor should feel excited to be a part of the development in order to end the exhibition witha positive and active emotion that can lead to the desired actions.ConfidenceExcitementImportanceInterestFigure 4.10 Emotional profile for temporary exhibitionFigure 4.9 Gaming experience at Frimley40
Oskar Karlsson, Petter PolsonMaster <strong>Thesis</strong> 2011 at Chalmers University of TechnologyResult and Analysis4.3 Idea generationThe idea generation process resulted in three different concepts for the temporary exhibition on smart grid and fourconcepts for the outdoor exhibit. The concepts show the variety of ideas produced in the process, both regarding thegeneral temporary exhibition platform and layout, as well as different ways of presenting the smart grid content. Referto the Concept survey in the appendix for further descriptions of the initial concepts (See Appendix XIX - Concept surveyon page 120).4.3.1 Temporary exhibition conceptsThe three initial concepts for the temporary exhibition on smart grid were called The Hub, The Tunnel, and The Mingling.The first two were two-story constructions with a set route for the visitors to follow around the exhibition. The layoutFigure 4.11 Concept 1 - The Hubconsisted of a central hub construction with a roominside it and staircases leading to a second floor on top.These concepts were challenging conventional exhibitionstructures, while the third one used a more traditionallayout with installations spread out on one floor, wherethe visitors can move around freely. In all three conceptsa modular platform was used for projecting movies andimages, and giving presentations. Another commonfeature was that the product and solution display wasplaced in a lounge area where the visitors could sitdown, enjoy refreshments, and in a relaxed atmospherelearn more about what Siemens can offer. A concept fora smart grid challenge was also incorporated in all threeexhibition concepts, but the other stations were designeddifferently so that as many ideas as possible could beincluded. The set route in the first two concepts allowedcontrolled storytelling throughout the exhibition.41
Conceptual <strong>Design</strong> of Temporary Exhibition Platform and Smart Grid Exhibitionfor Siemens Urban Sustainability CentreResult and AnalysisFigure 4.12 Concept 2 - The TunnelFigure 4.13 Concept 3 - The Mingling42
Oskar Karlsson, Petter PolsonMaster <strong>Thesis</strong> 2011 at Chalmers University of TechnologyResult and Analysis4.3.2 Outdoor exhibit conceptsSince there were fewer requirements on the outdoor exhibit compared to the temporary exhibition, the concepts for theoutdoor space varied a lot in design, technical solutions and in content. The concepts were called The Inverted Globe,Augmented Reality, Renewable Energy, and The Egg and are briefly described below. The Inverted Globe and The Eggworked well as attractors since they were large and eye-catching. The Renewable Energy concept made use of the waterarea next to the Urban Sustainability Centre and the Augmented Reality concept incorporated innovative technologywhich allowed futuristic virtual installations. By presenting concepts that are distinctively different from each other, abroad range of ideas could be incorporated, which generated interesting discussions on what features that were desiredand feasible to develop.Figure 4.14 The initial four outdoor exhibit concepts4.4 Concept evaluationThe results of the concept presentation and survey are summarised in the table below. The complete answers to thesurvey can be found in the appendix (See Appendix XX - Concept survey Results on page 128).Analysis of the feedbackIt is important to consider all the feedback from the stakeholders so that as many important opinions as possible willbe included in the final concepts. One clear trend in the feedback was that a two-story construction was not a feasiblesolution for the temporary exhibition concept since it would not fit into the building. However, the set route in The Hub43
Conceptual <strong>Design</strong> of Temporary Exhibition Platform and Smart Grid Exhibitionfor Siemens Urban Sustainability CentreResult and Analysisand The Tunnel was preferred over the free route in The Mingle. Another crucial feature of the temporary exhibition wasto keep it flexible and continue developing the modular concept.The concepts for the outdoor exhibits all received some good feedback and some negative opinions. A combination ofthe different concepts where all the appreciated features are merged into one concept was therefore suggested.Modules & LoungeSmart PassStructureStation 1 – Smart GridIntroductionStation 2 - Actors andMarketsStation 3 - Cases andSolutionsA modular concept is good to ensure flexibility in the exhibition, which isvery important. The relaxed lounge area is suitable for conversation.The idea of a smart pass is well received but the already existing RFID tagsmay be sufficient. Good for a high-tech company as Siemens.A one storey concept is a must. The flexibility is important. "IKEA" conceptwith a set walking route and order of stations is good.The more simple, module based concepts with screens are popular. Backprojected dome was not preferred. Tunnel concept different from Event'sexhibition and would be remembered.The game idea was very popular. The only concern is cost for development.It may be possible combine with the existing smart grid game and should becoordinated with the City of the Future to avoid overlap.The best combination would be to have an interactive table where peoplecan gather and discuss and information can be brought home.Outdoor conceptsFigure 4.15 Table of stakeholder feedback on initial conceptsUsing the water is interesting but concept 3 (Renewable Energy) is not fullythought through. Augmented reality is innovative but could be combinedwith a physical attractor. Vandalism is an important issue to consider.Augmented realityAugmented reality is a term for a live director indirect view of a physical, real-worldenvironment whose elements are augmentedby computer-generated sensory input such as sound,video, graphics or other data. The technology canthus combines real world scenery with virtualimages and let the user see virtual projectionsthrough e.g. a smart phone cameraor other technical equipment.44
Conceptual <strong>Design</strong> of Temporary Exhibition Platformand Smart Grid Exhibitionfor Siemens Urban Sustainability Centre5. FinalresultThe final concepts for the temporary exhibitionplatform, the exhibition on smart grid, and theoutdoor exhibit are presented in this sectionwith written descriptions and visualisations.45
A CA CCOMMS ROOM1.17A CA H UA H UCOMMSCOMMSCOMMSCOMMSA H USTORE1.46A H URISERA H USTAIRC.03A H UA H UFEATURE STAIRC.04MANIFOLDCUPBOARDCLEANERS1.03A H UESCAPE STAIRC.02LIFT-01PLANT ROOM1.18RECEPT SUPPORT1.04LIFT-02IT. RISER ELECTRICALRISERSMOKERISERWEELCHAIRREFUGELOBBY1.08WATER TANKOFFICE LOBBY1.01SHOWER1.07SHOWER1.05OFFICE1.35CORRIDOR1.43LO BY1.41STORE1.40VEND-COPY POINT1.42CONTROL ROOM1.34ELEC.RISERA H UMALE WC1.11BRIDGE1.02DWC1.10LOBBY1.09A D RAUDITORIUMG.43FEMALE WC1.12LO BY1. 3VOIDCORRIDOR1.32LOBBY1.13LIFT-03ESCAPE STAIRC.01FURNITURE STORE1.31BREAK-OUT AREA1.16CORRIDOR1.30PANTRY1.14TERRACE1.15MEETING ROOM1.19MEETING ROOM1.21MEETING ROOM1.20MEETING ROOM1.22MEETING ROOM1.24VIDEO CONFERENCE ROOM1.26MEETING ROOM1.29MEETING ROOM1.25MEETING ROOM1.23MEETING ROOM1.27MEETING ROOM1.28Conceptual <strong>Design</strong> of Temporary Exhibition Platform and Smart Grid Exhibitionfor Siemens Urban Sustainability CentreFinal Result5.1 Temporary exhibition platformThe concept for the temporary exhibition platform contains a suggestion on location in the centre, a modular conceptfor flexible exhibition layout, and a check-in station. This platform is general and can be used for other exhibitions ondifferent topics in the Urban Sustainability Centre. The concept for the Smart Grid exhibition, which is an example onhow to use the temporary exhibition platform, can be found in a later section (See 5.3 Smart grid exhibition on page53).5.1.1 Placement in the Urban Sustainability CentreThe preferred placement of the temporary exhibition is the office space and breakout area on the first floor. However,the structure is flexible and can be fitted into other possible placements as well. There are several reasons why the firstfloor is suitable for hosting the temporary exhibition. Firstly there is a reception desk already planned on the first floor,which can be used to welcome the visitors who will feel special and selected when going to a floor separate from thepermanent exhibition. Secondly there will be more office space on the second floor, and just a small part of the totaloffice space would be used for the temporary exhibition. The room on the first floor will also be large enough to fit anexhibition. Thirdly the breakout space can work as a lounge area where Siemens solutions can be presented in a relaxedatmosphere easily accessible from other part of the exhibition.ELECTRICALA D RA H UELEC.RISERCOMMSCOMMSCOMMSCOMMSCOMMSCOMMSCOMMSCOMMSCOMMSIT. RISERFigure 5.1 Urban Sustainability Centre - Location for temporary exhibition46
Oskar Karlsson, Petter PolsonMaster <strong>Thesis</strong> 2011 at Chalmers University of TechnologyFinal Result5.1.2 Modular conceptThe flexibility of the exhibition is achieved by using a general structure based on modules throughout the wholeexhibition. Four different modules have been developed and are described below. All modules have a clean design withwhite high-quality plastic finish without any unnecessary objects or writings. This design communicates excellencewhich is one of Siemens’ core values.Figure 5.2 Overview of modular conceptFigure 5.3 Modular concept with projectionScreen moduleThe screen module consists of a large white screenmounted on a stable base module. The screen is suitableto project pictures and movies on, and the base modulecontains speakers which enables both visual and audibleexperiences. Both the screen and base are easily movableand stackable to assure flexibility in the exhibition. Theexhibition structure can be adapted to the content and thescreen modules can stand on their own, on a row, or ina corner formation. On top of the screen there is a rackthat can be used to hold projectors for projecting imagesin any direction. To increase the experience further, 3Dprojectors can be used instead of regular 2D projectors.The height of the screen module is adapted to thesuggested location in the centre which enables enclosedroom-like or tunnel-like constructions solely by placingthe modules in certain ways.Figure 5.4 Screen module - exploded view47
Conceptual <strong>Design</strong> of Temporary Exhibition Platform and Smart Grid Exhibitionfor Siemens Urban Sustainability CentreFinal ResultFigure 5.5 Base module placed in storage boxFlexibility & MobilityFigure 5.6 Modular concept - Corner brace enables flexible placementFigure 5.7 Wheels underneath screen module and racks on top.48
Oskar Karlsson, Petter PolsonMaster <strong>Thesis</strong> 2011 at Chalmers University of TechnologyFinal ResultControl moduleThe control module consists of a computer with a touch screen that controls the images and sound effects on the screenmodules. The image shown on the touch screen is the same as the one projected onto the screen module and the controlmodules can be moderated either by the visitors or by Siemens personnel on site. Since only digital projections areused to display images and movies, the exhibition concept becomes very flexible in the terms of content. Whenever thecontent changes or is updated the computer can be reprogrammed to show the new content on the control module andon the screen modules.Figure 5.8 Control module with hidden computer insideFigure 5.10 Projector mounted on screen rackFigure 5.9 Speakers fitted into the base module. Cables are completely hidden underneath.49
Conceptual <strong>Design</strong> of Temporary Exhibition Platform and Smart Grid Exhibitionfor Siemens Urban Sustainability CentreFinal ResultGame moduleThe game module (See Figure 5.16 SimGrid Challenge onpage 57) consists of a large multi-touch screen tablewith object recognition technology. Around this modulefour to six visitors can gather around and togetherwith Siemens personnel discuss interesting topics. Themodule is suitable to use when incorporating a gameor other type of challenge in the exhibition. The tablebecomes a meeting platform where visitors sit down andinteract with the challenge and with each other. Fromthis interaction the users will get a better understandingof complex topics, meet other actors in their field oftechnology, and learn from each other.The solution display screens can use 3D technology toincrease the experience when showcasing products.Part of the concept for showcasing case studies andsolutions are the case and product templates which havebeen developed in this project. The templates enableSiemens to present cases and solutions in a coherentway which makes it easier for the user to find the desiredinformation. By linking the case and solution templatesto each other, the user can chose to either look intosolutions directly or looking at interesting case studiesand through them finding the related products.Solutions display moduleThe solution display module (See Figure 5.19 Breakoutspace setting with solution display module on page 60)is similar to the game module but with a smaller tablewith a multi-touch screen without object recognitiontechnology. One to four people can gather around themodule at the same time and it can be controlledby either the visitors, Siemens personnel,or both at the same time. By placingthe solution display modules in thebreakout-space, the table becomesanother gathering place where thevisitors can meet and discuss Siemens’case studies and solutions in a relaxedenvironment. By using digital screens forproduct display, the exhibition becomesmore flexible since only software updates are necessarywhen changing the topic of the temporary exhibition.Figure 5.11 Smart-CARD5.1.3 Check-in deskWhen arriving at the first floor, either by the staircaseor by the lifts, the visitors are welcomed at the receptiondesk by Siemens personnel. Each person is asked toregister their RFID-tag in a scanner and the receptionisthelps them to create a personalSiemens account. This account isused to store interesting informationthroughout the exhibition and will beaccessible afterwards through a webpage.After registering, the visitors have theirpicture taken and then receive a Smart-CARDcontaining their photo and information abouthow to reach their personal Siemens account on theinternet. When logging in at the different stations bywiping their RFID-tags over the scanners, a digital versionof the personal Smart-CARD together with the photo ofRFIDRadio Frequency Identification is acommunication technology that usessmall electronic tags which sends radiosignals that are readable a short distance fromthe tag. This enables touch free reading similar tobarcodes but by using radio signals instead of visiblelight the code is invisible (RFID Systems, 2011).RFID-tags are planned to be given to visitorsin the Urban Sustainability Centrefor quick identification when usinginstallations.50
Oskar Karlsson, Petter PolsonMaster <strong>Thesis</strong> 2011 at Chalmers University of TechnologyFinal Resultthe person, an avatar, appears on the screen. Interestinginformation is then stored to the personal Siemensaccount by draging it to the avatar.The Smart-CARD concept creates a feeling of exclusivenessand recognition which enhances the experience thatSiemens is a high-tech company and a reliable partner.The Smart-CARD also works as a giveaway which willremind the visitor of the exhibition at a later stage.5.2 Exhibition <strong>Design</strong>Strategies forSuccessfulCommunicationThis document is developed from the analyses of thedifferent literature, user, and observation studies inthis project. The conclusions emphasise general aspectsof exhibition design rather than presenting a concreteinstruction manual and they can be considered asguidelines when designing similar exhibitions.The document is divided into general exhibitionguidelines and design strategies.5.2.1 General exhibition guidelinesThese recommendations should be considered before theactual design of the exhibition begins.Purpose of the exhibitionThe first thing to consider when making an exhibition iswhat the purpose with the exhibition is. If the purpose isto only inform about a certain topic or if the reason formaking the exhibition is to showcase and sell products orservices, the approach will be different.Target user groupSimilar to defining the purpose of the exhibition, who thetarget group is needs to be considered. The exhibitionmay target mostly children and families, or perhaps thetarget group is professionals from the industry. Thetarget group significantly influences the message andon what level the information should be presented. Alsothe interior design and aesthetical expression shouldbe adapted to the visitors, e.g. using more colours andplayful sounds to attract children’s interest and moreclean design to appeal to professionals and adults.Information contentAfter defining the user group the actual content of theexhibition can be decided together with the messagesthat need to be communicated. The informationcontent should support the messages and the storyof the exhibition and thus follow a line of argument.The information can be presented in layers so that thecontent is adaptable to different visitors with differentbackground. It is important to make the informationeasily accessible with the option to go deeper into topicsthat are of greater interest to the different users.ContextAn exhibition is never fully isolated and the surroundingsare often important to consider. The amount of availablespace limits the size of the exhibition and the type ofcontext put different requirements on it. If the exhibitionis one out of many at a fair and needs to stand out fromthe rest to catch attention, the ability to attract visitor andcreate interest is of high importance. If on the other handthe exhibition is to be placed in a certain building andrather needs to fit it, the focus will be on other parts e.g.the interior design.Time frame and budgetThe last of the general things to consider before startlooking into the design strategies is what the time frameand for the exhibition is and how much money can bespent on it. If the exhibition is temporary the constructionshould be simpler to allow quick assembly and easymobility. If the content of the exhibition will change butthe structure will remain the whole exhibition needs tobe flexible to allow updating. The time frame before theexhibition needs to be finished also puts limitations onthe size and complexity of the installations. The budgetis naturally very important to consider throughout thedesign process, as in all projects. The cost will dependon many things e.g. the rent, technical equipment,technology and software development, furniture andinterior design, and people working with the exhibitionduring development and during the time it is in place.5.2.2 <strong>Design</strong> strategiesThese strategies are mainly collected from a KJ-analysison the observation studies performed in this project. Thestrategies are divided into six different subjects according51
Conceptual <strong>Design</strong> of Temporary Exhibition Platform and Smart Grid Exhibitionfor Siemens Urban Sustainability CentreFinal Resultto the KJ-analysis and cover both structural and technicalissues as well as visitors’ impact.Attract attention and create interestAn exhibition must first attract the attention of the visitorto get a chance to communicate messages. This can bedone with an attractor that draws the attention of the userand focuses it on the topic of the exhibition. By buildingthe exhibit around a central attractor you will gainattention from a distance. The attractor also functions asa “heading” of what the content of the exhibition is about.Very large objects and installations can more easily attractattention than smaller ones but the attractor shouldalso be somehow fascinating to create interest. Scary,beautiful, impressive, disgusting, spectacular, or in otherways bizarre exhibits can fascinate the viewer. It is alsogood to add a level of surprise and anticipation into anexhibition to make the user more interested and excited.By using recognition, e.g. letting the visitor see his/herown face, company logo, or city, the visitor’s attention andengagement is put to an even higher level.Exhibition structureTo maintain the users’ attention throughout an exhibitionit is important to tell a story and the structure, and howthe exhibition is organised needs to support this story.The user should get a clear picture of what the exhibitionis about from the start and get an overview before detailedinformation is presented. There must also be a goodbalance in the amount of exhibition objects and a clearthought behind the location of the objects and installationsso that the user can easily follow the story.By having a structure with a clear entrance the visitors willfeel special and important. Food or giveaways can also beused to make the visitor feel pampered or selected. Foodalso helps preventing fatigue and giveaways function asmemorabilia.Aesthetics and interior designThe aesthetical impression in an exhibition is importantand it needs to express the content of the exhibition. Itshould work as a whole to create the right atmosphere,and at the same time all details need to match the restof the exhibition to keep a harmonized experience. Thisshould be considered when choosing colour scheme,surfaces, finish, and fonts etc.If all parts of the interior work together, such as decoration,furniture, lighting and music, the right mood can becreated which enhances the experience for the user. It isalso possible to create the desired emotions from settingthe atmosphere and context for the actual content andmessages presented in the exhibition.Interactive experienceUsing interactive objects and letting the user participatein a game or challenge creates interest and elicitemotions. Through interaction that appeals to all sensesthe experience can be both more fun and engagingand at the same time more informative for the user. Acombination of visual, haptic and audible stimuli in aninteractive exhibit works well to engage the user and if thegame aspect is included as well the installation becomeseven more captivating. Games or challenges appeal to theaudience’s playfulness and competitiveness which attractattention and focus with the user.Crucial for all interactive elements is that it needs to beoperable without any technical or usability problems. Ifthe technology does not work flawlessly, or it is unclearfor the user how to interact with the exhibit, the user willfeel frustration, disappointment or even anger. Serviceminded, helpful, and skilled personnel who can assisthelps out.Evoke emotionsOne of the main objectives with the exhibition is to makethe visitor feel something for the message to get through.The exhibition should give the audience a comprehensiveexperience. Visual, audible, and haptic stimuli shouldwork together to elicit desired emotions. Even some “bad”feelings, such as disgust and fear, can increase the level ofinterest from the user. However, if the exhibition makesthe user feel sad or guilty, he/she will probably just try toshake it off. The key is to evoke the right type of emotionand at the right moment.Installation solutionsBesides having a clear structure and consistent design ofthe exhibition as a whole, the individual installations alsoneed to be considered. To get the users’ full attention itcan be good to somehow screen off the installation fromthe surroundings and thus decreasing disturbances fromthe outside. This can be achieved by putting up walls or aroof around the exhibit.The information needs to be communicated in a way thatfacilitates learning. Written information should be keptto a minimum and always be supported with pictures orother means of communication. By using projections orinteractive screens, many layers of information can bepresented on a smaller area.52
Oskar Karlsson, Petter PolsonMaster <strong>Thesis</strong> 2011 at Chalmers University of TechnologyFinal ResultIf objects and products are being presented, they shouldbe placed in their context to make it easier for the user torelate to them. It is also nice to use physical objects or 3Dtechnology to enhanced the spatial experience and givedepth to the exhibits. This will further facilitate the communicationto the user who will feel more as a part of theexhibit and thus more participating. Another way to getthe user more involved is to use familiar environments. Byrecognising a face or a city, the user will be able to relate tothe exhibit and become more interested in the message.5.3 Smart grid exhibitionThe concept for the temporary exhibition on smart grid isdivided into four stations representing the background,benefits & challenges, actors & markets, and cases &solutions in the Exhibition Content Description (SeeAppendix I - Exhibition Content Description on page74). These stations are presented in detail belowafter the suggested exhibition structure and route aredescribed.5.3.1 Exhibition structure and routeThe modules are placed in a certain way to create thefeeling of several rooms in the exhibition. Siemenspersonnel guide the visitors through the exhibition andthey walk a certain path. By having a set route, it is easierto tell a story throughout the exhibition to elicit emotionsand to give the visitors a better experience.BRIDGE1.02FEATURE STAIRC.04Figure 5.12 USC first floor office space - Exhibition layout53
Conceptual <strong>Design</strong> of Temporary Exhibition Platform and Smart Grid Exhibitionfor Siemens Urban Sustainability CentreFinal ResultFigure 5.13 Station 1 - Smart grid background5.3.2 Station 1 – Smart grid backgroundThe introduction to the smart is presented on two screen modules at the start of the exhibition. A guide gives the presentationto a group of about 4-12 visitors at the same time. The presentation starts with the guide presenting the energysituation today. The message is that the global trends today are growing populations and higher demand for energyworldwide. At the same time, the world’s energy mix needs to change from fossil to renewable sources, which puts alot of pressure on the electricity grid. The need for a secure electricity supply, efficient use of energy, and a transitiontowards sustainable energy systems are the most important drivers for the smart grid. These drivers are introduced andthe concept is described to make sure that the visitors all have the same basic level of understanding.54
Oskar Karlsson, Petter PolsonMaster <strong>Thesis</strong> 2011 at Chalmers University of TechnologyFinal Result5.3.3 Station 2 – Historical timeline and definitionAfter the introducing presentation the group walks into the tunnel-like part of the exhibition. In the tunnel the groupstops to watch a timeline-movie where a voice tells the story about how smart grid technology has evolved, from anhistorical perspective. The timeline consists of four different branches that each begins with a scientist that representsa certain technological development. These are Edison with his DC-technology and his branch emerges with the branchthat starts with Tesla who developed AC-technology. On the other side there is a branch representing communicationtechnology that starts with Bell and Siemens. This branch will emerge with the other side’s branch and this meetingrepresents present time when smart grid technology links communication and electricity together. This timeline givesa historical perspective on smart grid development and compare Werner von Siemens with other scientific giants andthereby emphasizes Siemens’s excellence.After the historical introduction the visitors spread out in the tunnel and use individual interactive stations. The firstmodule inside the tunnel has a set of electronic kitchen magnets with different words. These words can be used to formsentences and the visitors are encouraged to write their own definition of the smart grid concept in one sentence. Thesesentences are projected on the walls and ceiling of the tunnel and shown to visitors that come after. Through writingtheir definitions, the visitors are able to influence the exhibition and will start thinking about what a smart grid is andhow it can be defined in different ways.Figure 5.14 Station 2 - Timeline and smart grid definition55
Conceptual <strong>Design</strong> of Temporary Exhibition Platform and Smart Grid Exhibitionfor Siemens Urban Sustainability CentreFinal ResultFigure 5.15 Station 3 - BOCI analysis5.3.4 Station 3 – Benefits and challengesThe visitors continue in the tunnel into the next room to try out a new set of interactive control modules. These havethree different content parts that compares today’s electricity grid with the future smart grid.One shows a graphical representation of the benefits, opportunities, challenges and issues (BOCI) with a smart grid.Each topic in the graph contains three layers of information and the user can touch a topic on the control module toreach the next layer or go back one layer. The BOCI-analysis mainly consists of benefits and opportunities and thechallenges will be presented together with suggested solutions to increase the credibility of the exhibition.The second possible use of the interactive modules presents films showing visions of possible future scenarios. In onefilm the whole world is connected with super grids that transport clean electricity (produced by e.g. solar power indesert areas) around the globe. A second film shows a decentralised future where local energy sources (e.g. from solarphotovoltaic on rooftops) together with local storage capacity can supply electricity to self sufficient micro grids. Thesefilms give a promising picture of the future and a good feeling of anticipation.Thirdly the user gets to participate by making own estimations of future population, energy need, and energy mix.For each set of estimations a future scenario is presented with movie cuts and supporting numbers and figures of newinvestments needed in the electricity grid. From all reasonable estimations the smart grid will be a necessity to allfuture scenarios and by letting the user participate, this conclusion becomes more trustworthy. The result is stored atthe personal exhibition account and can also be compared to other user’s results.56
Oskar Karlsson, Petter PolsonMaster <strong>Thesis</strong> 2011 at Chalmers University of TechnologyFinal Result5.3.5 Station 4 – Actors and Markets, the SimGrid challengeAfter the tunnel, the group gathers again to attend a round of SimGrid together with the guide as a moderator. SimGridis a simulation game that combines digital screens with physical objects. The game module is a multi touch table withobject recognition where the players can put models of different smart grid components. The mission is to construct abalanced energy system and a grid that can supply a city with electricity in a clean, reliable and efficient way.Meeting platformFigure 5.16 SimGrid Challenge57
Conceptual <strong>Design</strong> of Temporary Exhibition Platform and Smart Grid Exhibitionfor Siemens Urban Sustainability CentreFinal ResultFigure 5.17 SimGrid - Screen viewPurpose of the gameThe first purpose with SimGrid is to give the players a deeper understanding of how a smart grid is constructed andwhat the challenges are. Most visitors have a good knowledge about smart grid prior to the visit, but by having a realtime experience of taking part in building one, they reach a new level of understanding.Secondly, the users are able to take the role as another actor in the smart grid field than what they normally represent.This give them a better understanding of who the actors are, what their roles are, what challenges they face, and howdifferent actors need to work together to enable the future smart grid.Finally, the simulation game work as a meeting platform for different visitors to the exhibition. It is a game for fourto six players who work together towards a common goal and therefore require cooperation between the visitors. Themoderator can raise interesting questions that will induce discussion around the table.Questions that may come up and be discussed during the simulation are:-What is needed to build an electricity system?-What are the main differences between the electricity grid today and the smart grid?-What actors are involved and how should they co-operate to build the smart grid?-How can a balanced situation between electricity supply and demand be managed?-How does a demand response system work and why is it a crucial part for keeping balance in the grid?58
Oskar Karlsson, Petter PolsonMaster <strong>Thesis</strong> 2011 at Chalmers University of TechnologyFinal ResultInitial situation and game ideaOn the game module there is a digital landscape with models of houses, industries, and office buildings on fixedpositions from the start of the simulation. On the screen on the wall the status of the city’s households, industries, andcommercial buildings are shown, as well as the electricity supply and demand curves, and the money assets of the city.As long as the industries are producing and the households and offices are running without blackouts, the monetaryassets will grow.The initial situation is a stable city where the electricity supply is kept high to meet the demand peaks. The game startswith a movie on the screen showing that the city’s energy supply is changing when the nearby coal-fired power plant issuddenly shut down. At the same time, more people are moving into the city which changes the demand for electricityin all three sectors. The players are given the challenge to adapt the electricity system to the new situation to make surethat the city’s monetary assets are not running out.The game moderator gives the rules and explains how the simulation works. Each player is in charge of some categoriesof products and has the possibility to put them on the table. Placing a model on the table means that the city is investingin this product which costs money. To cope with the changes in the energy situation the players have to co-operate tomatch the supply and demand curve without running out of money. All important parts of the electricity generation,transmission, distribution, and consumption must be in place and the players are only in charge of one category each.The products categories available will be those that Siemens has to offer in the smart grid field, e.g. wind turbines,HVDC cables, switch gears, smart meters, and building management systems.Game flowThere are different game flows that can be used in theSimGrid. They can be divided into turn-based flows andchaos-based flows. In a turn-based flow, each player willhave the option to either invest in a new product or topass before it is the next player’s turn. This type wouldprobably be the best option if the users play against eachother. In SimGrid however, the users play together towardsa common goal which makes a chaos-based flow suitable.The players can choose to act whenever they want duringthe simulation time, but since co-operation is needed,the users will have to discuss the moves with each other.One option is to have short simulation intervals wherethe players can act and then have a break where the gamemoderator can address interesting questions that havecome up before the simulation starts again.Figure 5.18 SimGrid - Close-up59
Conceptual <strong>Design</strong> of Temporary Exhibition Platform and Smart Grid Exhibitionfor Siemens Urban Sustainability CentreFinal Result5.3.6 Station 5 – Cases and solutionsWhen the visitors have attended the round of SimGrid, thefirst part of the exhibition is finished and the group moves ontowards the breakout space. In this area, there is a bar servingrefreshments to the visitors who can settle down at the baror in a comfortable chair around a coffee table. The relaxedatmosphere is well suited for presenting Siemens cases andproducts in the smart grid field, and this is done at the foursolution display tables that are placed in the breakout space.Siemens personnel are present to help the visitors use thescreens and to answer questions regarding Siemens smartgrid solutions.BRIDGE1.02Figure 5.20 Breakout space - Exhibition layoutFEATURE STAIRC.04Figure 5.19 Breakout space setting with solution display module60
Oskar Karlsson, Petter PolsonMaster <strong>Thesis</strong> 2011 at Chalmers University of TechnologyFinal ResultThe screens present either cases or products and organisethem in different ways to make the information asaccessible as possible. The user chooses to look at casesor solutions but they are also linked to each other.When choosing to see cases the earth will appear on thescreen with small dots representing Siemens presencearound the world. The user can spin the globe around avertical axis and touch any dot to get information aboutthe different case studies. The visual information will becomplemented with sound effects when the globe spinsand when one location is zoomed in etc. By showing thatSiemens has worked with smart grid projects aroundthe world the visitors will feel that Siemens is the worldleading company and the best partner in the smart gridfield. The user can also choose to see the cases representedby icons and categorised according to geographicallocation, field of business, size of project, or alphabetically.Whenever the user sees something of interest thecurrent page can be swept to the avatar on the screen tostore the information on the user’s personal Siemensaccount.Figure 5.21 Solution display module with cases displayed on globeIf choosing to look at products and solutions Siemensvirtual city is shown with the smart grid productscategorised according to technology and type of business.By using existing software the product presentation iseasy to construct and update and the visitors recognisethe specific Siemens environment. Similarly to the casepresentation more information about each product isaccessible by clicking on the screen and informationof interest can be stored to the Siemens account. Theproducts can also be shown as icons and organised incategories to get a good overview of Siemens smart gridportfolio.Figure 5.22 Solution display module with Virtual City softwareBoth cases and solutions are presented on the caseand product templates that can be used for any type oftechnology and therefore in other temporary exhibitions.This makes the installation flexible and the content caneasily be updated, which is necessary for a developingfield of technology such as smart grid.Figure 5.23 Icons representing cases and products61
Conceptual <strong>Design</strong> of Temporary Exhibition Platform and Smart Grid Exhibitionfor Siemens Urban Sustainability CentreFinal Result5.4 Outdoor exhibitThe outdoor exhibit relates to smart grid and the temporary exhibition, but also to sustainable technology in general,and the content is flexible so that it can be adapted to other topics.5.4.1 Outdoor requirementsSince the outdoor area is available for the public there are other requirements for an outdoor exhibit than for thetemporary exhibition inside. It must be weather and vandal proof and should address all visitors, unlike the specifictarget audience for the temporary exhibition. A solution to the vandalism problem is to make use of the water aroundthe centre and place the installation off shore. This way no one can reach it and it is thereby protected.Figure 5.24 Urban sustainability centre with outdoor area62
Oskar Karlsson, Petter PolsonMaster <strong>Thesis</strong> 2011 at Chalmers University of TechnologyFinal Result5.4.2 Concept descriptionThe concept of the outdoor exhibit is based on the technology of augmented reality. Through augmented reality it ispossible to project artificial images into a real environment. This could be done either by a smart phone app or withaugmented reality goggles. The installation concept is a grass clad island on the water with a futuristic egg shapedhouse built on it. The house attracts attention and evokes curiosity with the visitors, and makes them excited to use theapp or goggles to watch what happens on the island.In the augmented reality picture a micro grid appears that balances supply and demand of electricity on the island.Small scale renewable power plants emerges, e.g. solar PVs on the roof, a vertical wind mill next to the house, and awave power plant in the water around the island. Other sustainable technologies such as rain water harvesting, energystorage facilities and a spiral-shaped cultivation are shown in the garden around the house. Next a futuristic electricvehicle appears in the water and drive up on land to park next to the house. In the background large off shore windpower farms are visible as well as well as large scale solar power plants.On shore there is a signpost explaining how to use the augmented reality technology and describing the differentobjects and solutions that appear in the picture.Figure 5.25 Outdoor exhibit attractor63
Conceptual <strong>Design</strong> of Temporary Exhibition Platform and Smart Grid Exhibitionfor Siemens Urban Sustainability CentreFinal ResultFigure 5.26 Outdoor exhibit with augmented reality visualsThe scenery is a vision of a clean and efficient future where new technology solutions help people to live in a sustainableway without having to lower their quality of life. It shows how an isolated area can become more self-sufficient onresources and how a household goes from being a consumer into becoming a “prosumer” and even a net producer ofpower to the grid. The vision shows that a sustainable future is possible and that people can live without affecting theenvironment or climate in a negative way. This is intriguing to experience and evokes a sense of hopefulness about thefuture and at the same time makes the visitors interested in learning more about sustainable solutions in the UrbanSustainability Centre.64
Conceptual <strong>Design</strong> of Temporary Exhibition Platformand Smart Grid Exhibitionfor Siemens Urban Sustainability Centre6. DiscussionThis section considers the methods usedthroughout the project and the results theygenerated. Sources of error are discussedand a suggestion on how to proceed with theexhibition concepts is presented regarding whatneeds to be developed further and what thenext steps could be.65
Conceptual <strong>Design</strong> of Temporary Exhibition Platform and Smart Grid Exhibitionfor Siemens Urban Sustainability CentreDiscussion6.1 Method discussionThis project has strived for a structured, scientificapproach and several different methods and theories havebeen applied. In general, this has worked very well andthe final results are proof of this. However, in a project ofthis size the parameters are many and their relationshipsvery complex and to call attention to this, some methodsand sources of error are discussed below.The MECE analysis carried out at the start of the projectdidn’t reach its full potential. This tool is mostly used inmanagement related projects and was difficult to applyto the current scope. It did, however, present a usefuloverview of which data collection activities that wereimportant to prioritise and which ones that could wait.Regarding the data collection, a rather extensive onewas carried out on the topic of smart grid, designingemotions, and experience design. Some research wasdone on exhibition design but this topic was arguablyslightly overlooked. The time plan didn’t allow a deepdive into the topic but the reason for down-prioritisingit is mainly something else. One of the key instructionsfrom the project owners in the early stages of theproject was to provide fresh external input on Siemensexhibition strategies. Therefore, opinions and reflectionson exhibition design were formed from observations andexperiences rather than extensive literature studies.The questionnaire that was distributed in the datacollection phase of the project aimed to attain a betterunderstanding of the knowledge level on the topic smartgrid. The composition of the group that filled in the questionnaireaimed to represent the target audience for theactual exhibition and this may be of interest to discuss.The participants were on average slightly youngerthan the expected exhibition audience and, for obviousreasons, Swedish. A portion of them were also in the fieldof electricity installation which falls outside of the targetaudience’s profile. In spite of this, it is argued that theresult of the questionnaire is relevant for the project.This is based on the assumptions that knowledge level onsmart grid is not heavily dependent on nationality (withinEurope) or age. The rather high percentage of peoplefrom electricity installation could be assumed to lowerthe overall result but instead the result indicated a ratherhigh knowledge level. To confirm this, a larger sample ofpeople from a broader range of background could havebeen used.The market studies done in the project aimed to givean overview of other similar exhibitions. None of these(except from the Siemens exhibit at CIRED) were actuallyvisited. To be able to personally experience e.g. “Themagic box” might have given a deeper understandingof the other actors’ strategies for exhibition design andselecting content.The data collection and analysis resulted in two lists ofrequirements, one for a temporary exhibition on smartgrid and on for the outdoor exhibit. Instead of doingthree; one for the temporary exhibition platform, onefor the smart grid exhibition content, and one for theoutdoor exhibit the two first ones were merged. Thiswas considered better since the smart grid contentpart of the project followed a slightly different processthan the others and could thus not be concluded into aclassic list of requirements. It helped, however, to have aspecific exhibition topic in mind when working with thetemporary exhibition platform concepts, so this structureof the lists of requirements was preferred. Notable isthat Elicit emotions is among the top three requirementsin the first list of requirements. This might seemstrange to some readers but the reason for it is quitestraight forward. As stated in the design theory section(See 2.2 <strong>Design</strong> theory on page 10) emotions are animportant part of our decision making process. Since themain objective of the exhibition is to encourage furtherengagement with Siemens, i.e. making certain decisionsin favour of Siemens, emotions are crucial to consider.Most of the other requirements listed relate strongly tothe top three ones and some of them can even be saidto overlap slightly. But when working with somewhatintangible areas such as emotions and experience, someoverlaps are hard to avoid. However, the total effect of thelist is still a well-founded framework for the solution set.Another quite important issue when working withemotions and experience is how to communicate it. Theconcept presentations given in this project were basedon speech and visuals and did not include e.g. audibleor tactile stimuli. As discussed in the theory section (See2. Theory on page 5) a full aesthetical experience isessential to consider to make sure that the product-userexperience elicit the desired emotions. It is assumedthat this applies when giving presentations as well andit would therefore have been desirable to enhance theexperience for the audience with music, sound effects, theright lighting conditions etc. to be able to communicatethe concepts on a deeper level. However, such a presentationmight have come across as a bit excessive, and toinstead go with a concept that the audience was used to66
Oskar Karlsson, Petter PolsonMaster <strong>Thesis</strong> 2011 at Chalmers University of TechnologyDiscussionwas a good decision. All the aspects of the concepts wereinstead explained vividly and it is not necessarily needto personally be subjected to an experience to be able toassess its potential.Since the scope of this project did not include any deeperstudies in the usability of the products no empiricalusability studies have been performed. Some nonempirical usability studies such as Hierarchical taskanalysis, Cognitive walkthrough and/or Predictive HumanError Analysis is advised to consider for the continuationof the project to ensure a sufficient level of usability.6.2 Result discussionThe final results are divided into three parts and each partis discussed separately below.6.2.1 Temporary exhibition platformThe modular concept provides flexibility to the exhibitionconcept, which is a very important feature to a temporaryexhibition platform. The use of digital information fromprojectors and screens enables the content to changewithout adding new equipment to the exhibition and themobility of the modules makes it possible to adapt thefurnishing and interior to different topics. The case andsolution display module is also flexible and can be used forany type of products and topic. Both the case and producttemplates and the product display table are designedto have a standardised method for presenting Siemenssolutions regardless of topic. The multi touch table withobject recognition used for the SimGrid challenge in thesmart grid exhibition concept is probably the least flexiblepart of the temporary exhibition platform. However,this table can be used in many different ways besidesthe proposed game concept. The object recognitiontechnology enables human-product interaction in aninnovative way and can be adapted to either explain thetheory of a topic or to showcase products by using bothphysical models and digital information.One possible problem that may occur when usingprojectors is that the lighting conditions are too brightfor the projections to be clearly visible. The solution tothis problem would be to shade out the sunlight andto use a low level of indoor lighting in the room. Thescreen modules are adapted to fit the ceiling height inthe suggested office space of the Urban SustainabilityCentre and will thus form walls and sub-spaces andshield the sunlight if placed in front of windows. Anotherpossibility is to use blinds in the windows to control theamount of sunlight and thus create the desired lightingconditions. Another issue that needs to be solved is tofind an optimal placement of the projectors to createthe desired atmosphere, with pictures surrounding thevisitors, without anyone blocking the projections. If thisturns out to be a problem when letting projectors on onemodule projecting on an opposite one, a solution can beto project from below. A projector can be placed in thebase module and project onto the screen above withoutanyone or anything in the way.The choice of location in the centre was made afterconferring with Siemens and the architect firm. Therewere other suggestions of possible placements for thetemporary exhibition, e.g. the Street in between theCorporate and Exhibition crystals or one of the meetingrooms. The chosen office space and breakout space hasmany advantages, e.g. the reception and cafeteria isalready planned for and the location is well separatedfrom the permanent exhibition. However, the temporaryexhibition concept can be used in other locations as wellbut the layout would then have to be redesigned.6.2.2 Temporary exhibition on smart gridThe smart grid exhibition concept presented in thisproject is one possible solution out of many. The finalconcept design depends on both the messages that shouldbe presented, and on the different ways to communicatethis information. The content of the smart grid exhibitionconcept is meant to give the visitors the right backgroundinformation and sufficient knowledge about the topicto be able to discuss it with the other visitors and withSiemens personnel. The topic of smart grid is presentedin a broad way to reach all different visitor groups and theobjective is to have the visitor to start thinking about newpossibilities with smart grid development rather thanlearning about technical details. By creating a meetingplatform in the exhibition, the visitors can learn fromeach other and gain a deeper understanding of the topicin other ways than by just reading information.The areas of the Exhibition Content Description (See )that needs to be developed further are ones regardingSiemens cases and solutions, and the steps that differentactors need to take in the smart grid development. Theprojects that Siemens participate in and the products theydeliver will change over time and this part of the contentwill have to be updated throughout the exhibition period.67
Conceptual <strong>Design</strong> of Temporary Exhibition Platform and Smart Grid Exhibitionfor Siemens Urban Sustainability CentreDiscussionTherefore, it would have been a waste of effort to focus onthat part of the content in this project. Regarding the stepsin the smart grid development and the messages Siemenswants to communicate to the different actors; this has tobe considered further. Siemens has recently done a re-organisationand the smart grid sector will be part of a newdivision which has led to changes in the messages. Oncethe new organisation is in place the message to differentsmart grid actors should be considered and then includedinto the exhibition.One of the major requirements of the smart grid exhibitionis to elicit emotions within the visitor to inspire action.To achieve this it is important to tell a story throughoutthe exhibition and this has been attempted in the conceptpresented in this report. By first welcoming the visitorsand handing out the Smart Passes, they will feel specialand selected and thus be more receptive to the messagespresented. The background presentation will give thevisitors sufficient information to be able to take part inthe rest of the exhibition and also create more interestin the topic. The historical background gives a multi-sensoryexperience and by placing Werner von Siemens asone of the founders of smart grid technology the visitorswill gain more faith in Siemens as a competent company.When the visitors write their own definitions of smartgrid they will start thinking about the topic and opentheir minds to other’s opinions on the smart grid conceptwhich will further enhance interest and curiosity. Byshowing possible benefits, opportunities, and challengeswith smart grid compared to the electricity grid today,the visitors will feel the importance of the smart griddevelopment. By then moving to the SimGrid-stationwhere the visitors will work together to actually createa smart grid they will also feel excitement of being partof this development. The last part of the exhibition is inthe relaxed and comfortable environment of the breakoutspace where the visitors will get to learn more aboutwhat solutions Siemens can provide in the smart gridfield. This will elicit a feeling of confidence that Siemenshas all the tools and knowledge to be the best providerof smart grid technology. Throughout the exhibition thevisitors will thus both learn more about the topic andalso be exposed to emotional experiences which leadto discussions and possibly also to decisions on furtherengagement. However, all of these installations need tobe constructed and tested before the exhibition begins, tomake sure that the right usability is achieved and that thedesired emotional sequence is elicited.The concept works well for group visits, where part of theexhibition is presented by a Siemens guide. This requiresthat there are well educated personnel present to makesure that the visitors get a friendly and professionalreception and that questions that comes up throughoutthe exhibition can be answered. The amount of interactiveinstallations in the concept also requires staff on siteto help out and instruct when needed. Especially, theSimGrid-station will need a Siemens moderator to initiatethe game procedure and to induce discussion among theusers.6.2.3 Outdoor exhibitThe outdoor exhibit is based on augmented realitytechnology, which is new and still quite innovative butmay be problematic. The camera must recognise patternsin the picture to be able to add digital images that lookreal. This technology should be tested before the exhibitis being built to make sure that the installation will workas planned. If the picture doesn’t look real or the digitalimages won’t follow the cameras picture when it moves,the installation will not be perceived as sufficientlyinnovative or interesting.6.3 Next step for SiemensThe suggested way to continue with the temporaryexhibition and outdoor exhibit is to make a cost analysisand see what fits into budget, choosing case studiesand products to showcase in the smart grid and othertemporary exhibitions, start developing this content, andfinding suppliers of the technical equipment.6.3.1 BudgetIf deciding on proceeding with these concepts, the firstthing to do will be to make a detailed budget and see whatsolutions are economically feasible. Things to considerare cost for technical equipment (e.g. projectors and touchscreens), software development (e.g. for the SimGridconcept), and how much the extra staff would cost.If the whole concept for the smart grid exhibition does notfit into the budget, parts of it can be cancelled. The caseand solution presentation is the easiest part to separatefrom the rest since it is placed in a different location andworks well on its own. Other options can be to cut downcost by using existing screens instead of the modulesdeveloped in this project or to use simpler solutions for68
Oskar Karlsson, Petter PolsonMaster <strong>Thesis</strong> 2011 at Chalmers University of TechnologyDiscussionproduct presentation, but this would put the sense ofexcellence, efficiency and innovation in jeopardy.The cost for the outdoor concept can vary a lot dependingon how large the island is and what kind of attractor thatis put on it. The island can be constructed on floatingpontoons and the design can be more simplistic tokeep the price down, as long as it is a good attractorthat catches the attention of the people outside thecentre. The augmented reality allows a lot of innovativefeatures without any extra cost (except for the softwaredevelopment).6.3.2 Case studies and productsAs motivated earlier, what cases and solutions to presentin the smart grid exhibition has not been defined. Siemensis a very large company and smart grid is a quite widetopic which means that there are a lot of projects that canbe considered for display. When finding an interestingSiemens project, this can be described on the developedtemplate and complemented by e.g. movie clips andinterviews with participants. After finding a case, theSiemens products that were provided should be includedin the solution display and linked to the case.6.3.3 Software developmentSince there are lots of digital, interactive installationsin the concepts, there is much software developmentthat needs to be done. Especially the SimGrid game willtake a lot of concept development and testing before itcan be finalised and put into use. The object recognitiontechnology must work with the software to get thecomplete simulation experience. The game idea must alsobe defined before the programmers can start workingwith the software development.6.4 ConclusionIn this project, the three-fold scope was fulfilled andpresented in both text and visualisations. A temporaryexhibition platform was developed, together with asuggestion on a location in the Urban SustainabilityCentre, suitable to host the temporary exhibitions.The concept was made flexible so that the informationcontent of the exhibition can be changed to fit any topic.As a complement to the temporary exhibition platformconcept, to be used as a guideline when designing anexhibition, a document with strategies for successfulcommunication was developed.An exhibition concept on the topic of smart grid wasproduced regarding both the information contentabout smart grid and exhibition design solutions tocommunicate the message to the right target audience.The exhibition concept was made to fit the temporaryexhibition platform and can be used to presentand motivate why a temporary exhibition is a goodcomplement to the permanent exhibition in the UrbanSustainability Centre.Besides the temporary exhibition concept, an idea for anoutdoor exhibit was developed. This exhibit makes use ofthe water area outside the centre, targets the broad public,and aims is to make people interested in sustainabletechnology and the Urban Sustainability Centre.In all parts of the project, a product development processwas applied and numerous methods and tools were used.The installations in the exhibition focus on interactionand visitor participation to increase user engagement.The project has a clear sustainability perspective andthe smart grid exhibition will help the visitors to see thenecessity of a sustainable development and what role asmart grid will play in the future.69
Conceptual <strong>Design</strong> of Temporary Exhibition Platformand Smart Grid Exhibitionfor Siemens Urban Sustainability Centre7. BibliographyThe references in this report was collected from books,journals, papers and web pages, and are listed below.71
Conceptual <strong>Design</strong> of Temporary Exhibition Platform and Smart Grid Exhibitionfor Siemens Urban Sustainability CentreBibliographyBooksDesmet, P., 2002. <strong>Design</strong>ing Emotions. Delft: Delft University of Technology, Dept. of Industrial <strong>Design</strong>.Flick, T. & Morehouse, J., 2010. Securing the Smart Grid. Maryland Heights : Elsevier, 2010.Olsson, J. & Skärvad, P.-H., 2007. Företagsekonomi 100. Liber.Pinto, J.K., 2007. Project Management – Achieving Competitive Advantage. New Yersey: Pearson, 2007.JournalsDesmet, P. & Hekkert, P., 2007. Framework of product Experience // International Journal of <strong>Design</strong>. - 2007. - ss. 57-66.Russel, J.A., 2004. Core affect and the psychological construction of emotion // Psychological review. - 2003. - 110 : Vol.1. - ss. 145-172.Papers and ArticlesLitos Strategic Communication, 2008 - The Smart Grid: An Introduction. Washington D.C. : U.S. Department of Energy,2008. Available: http://energy.gov/sites/prod/files/oeprod/DocumentsandMedia/DOE_SG_Book_Single_Pages(1).pdfLarsson, Ö. & Ståhl, B., 2011. Smart Ledning. Stockholm: VINNOVA, Blue Institute, 2011.International Energy Agency, 2010. Key World Energy Statistics 2010. Available: http://www.iea.org/publications/free_new_desc.asp?pubs_ID=1199International Energy agency, 2011. Technology Roadmap - Smart Grids. Available: http://www.iea.org/subjectqueries/keyresult.asp?KEYWORD_ID=4156International Electrotechnical Commission, 2010. Smart Grid Standardization Roadmap. SMB Smart Grid StrategicGroup IEC. Available: http://www.iec.ch/smartgrid/roadmap/Vattenfall R&D, 2010. Vattenfall R&D Magazine, no 2. StockholmWorld Energy Council, 2010 . Survey of Energy Resources. London, UK. Available: http://www.worldenergy.org/publications/3040.aspWeb pagesEuropean Commission, 2011. Climate action, http://ec.europa.eu/clima/policies/package/index_en.htm, [2011-09-10]The Windpower, 2011. http://www.thewindpower.net/statistics_world_en.php, [2011-09-10]European Technology Platform, 2011. SmartGrids - http://www.smartgrids.eu/, [2011-04-10]Tom Spencer, 2011. McKinsey’s MECE framework, http://www.tomspencer.com.au/2008/06/14/mece-analysis-framework-mckinsey-and-company/,[2011-09-10]RFID Systems, 2011. http://www.rfid.se/ [2011-09-12]72
Conceptual <strong>Design</strong> of Temporary Exhibition Platformand Smart Grid Exhibitionfor Siemens Urban Sustainability CentreAppendix73
Conceptual <strong>Design</strong> of Temporary Exhibition Platform and Smart Grid Exhibitionfor Siemens Urban Sustainability CentreAppendix I - Exhibition Content DescriptionThis document describes the messages and content of the temporary exhibition on smart grid. The exhibition description sheet isdivided into a background part that introduces the topic, a part regarding benefits and challenges compared to today’s electricity grid,a section on actors and markets and finally a part on cases and solutions that Siemens provides in the smart grid field.BackgroundThe world’s energy demand is increasing rapidly with a higher standard of living and an increasing world population. The total energydemand is expected to grow at an annual rate of 2.2 percent from 20,300 terawatt-hours today up to 33,000 terawatt-hours by 2030.There is also a need to change the energy mix in the systems towards a more sustainable use of energy. The energy and transportsector emits greenhouse gases causing climate change and the fossil resources that today stand for about 90% of the world’s totalenergy supply will eventually run out.Great transitions need to be done, to change the energy mix towards renewable sources and to use energy more efficiently. The mostclean and sophisticated way of utilising energy is to use electricity, a high quality energy source that can be transformed into all othersources in a very controlled way. This will bring a great challenge to energy systems worldwide and especially put the electricity gridsunder large pressure.The world stands before a paradigm shift in electricity generation and an electrification of our societies. This is not possible withtoday’s electrical grids that are often aging and outdated. Today’s grid is characterized by centralized, large scale production andhierarchical distribution from the power generator to the consumer through high voltage transmission networks and low voltagedistribution networks. In the future, the grid will be transporting electricity in two directions and both the supply and demand sidewill be more complex. The electric grid has to develop into a smart grid that can both secure the balance between production andconsumption and guarantee the availability of high quality electricity.Historical perspectiveThe smart grid is evolving from technologies that originate back to three scientific giants;• T.A. Edison who developed DC and battery technology,• N. Tesla, who further developed Edison’s concept for electricity distribution by inventing AC technology,• A.G. Bell who invented the telephone and therefore set the ground for today’s communication technology.Alongside with these great scientists was Werner Von Siemens who started the company that would become one of the biggest andmost successful players in both electricity generation and distribution and communication technology. When the fields of electricityand communication come together in the smart grid, a unique combination of knowledge and competence is required to meet the newdemands. Siemens has this competence.Drivers for a smarter gridThe drivers for developing a smart grid are many and vary a lot for different locations and situations. Most important drivers are theintegration of renewable energy into the electricity mix and the reliability and efficiency of the electricity grid.Sustainability and integration of renewable energyTo reduce the carbon footprint from electricity generation more renewable energy sources will be used in power production. Theproblem when integrating more renewable power generation into the energy system is that power that comes from solar and windis highly fluctuating. Today, the electricity supply is adapted to the demand and needs to be more reliable than the renewable intermittentenergy sources are. This relationship will change so that load follows generation which calls for a flexible electricity price incombination with a grid that can communicate with smart home products.The integration of renewable energy sources will change the energy mix but there will still be a need for traditional power supplyas base load to keep the supply stable. However, even fossil power generation can be made more efficient to minimize the carbonfootprint by using better turbines in the power plants and combining heat and power production.74
Oskar Karlsson, Petter PolsonMaster <strong>Thesis</strong> 2011 at Chalmers University of TechnologySecurity of supply and efficiencyIn many places around the world there is already a problem with old grids not being able to supply the electricity according to demand.Blackouts and brownouts are costly and this problem becomes larger as the world’s energy demand increases and the fossil sourcesare running out. Keeping the right power quality also becomes more problematic when more disturbing objects are connected to thegrid and more sensitive equipment is being used. This gives a need for a smarter control of the electricity system to assure a safe andreliable supply of the right quality.Today’s electricity infrastructure is designed to meet the highest level of demand and during non-peak hours the system is underutilised.If the demand was evened out, this excess power capacity would not be needed. Smart grid technology can manage this byproviding incentives for consumers to shift consumption from peak hours to off peak hours. This is done by providing informationabout supply and electricity price as well as smart automated solutions that helps the consumers make the most profitable choices.Smart grid technology can also help improving transmission and distribution to have less loss from friction and to optimise investmentsin the system.Different development and drivers in different regionsThe most prominent driver for developing the smart grid varies around the world. In EU the main driver is the political will to changethe energy mix into more renewable. The smart grid is needed to enable large scale integration of renewable electricity generation.USA on the other hand has an old and unreliable grid and their smart grid driver is mainly to secure the electricity supply to avoidcostly blackouts. China is the region that grows the fastest at the moment and needs to build a lot of new grid to supply the energydemanding east from the sources in the west. To optimise the investments needed the new grid will include smart technology.Definitions of smart grid:Smart grid is a concept without one true definition and different actors will have different approaches to defining what it is.To define the smart grid there are two different approaches that can be used. One way is to use a technological approach on thetopic and define the concept based on the technology and products that builds up a smart grid. The other approach is to start at thechallenges that the electric grid has to face and define the smart grid as the power network that has the solution to these challenges.Smart grid from a technological perspective; a smart grid consists of:• An electricity system with two-way distribution and communication• Smart metering to control supply and demand• Optimisation tools to improve energy efficiency• Storage devices that works with the grid to match the supply and demandSmart grid from the challenge perspective; a smart grid must enable:• Integration of more renewable electricity production• Efficient long and short transmission and distribution electricity• Load shifting in a way that gives incentives for efficient consumption• An integration of electric vehicles in the vehicle fleet75
Conceptual <strong>Design</strong> of Temporary Exhibition Platform and Smart Grid Exhibitionfor Siemens Urban Sustainability CentreBenefits and challengesThe existing grid infrastructure in many developed countries is aging and needs new investments. Smart grid technology provides theopportunity to maximise the use of existing infrastructure through improved monitoring and management and new infrastructurecan be more strategically built to complement the existing. This means that smart grid technology will have effects throughout theenergy chain as well as affect the whole world’s energy systems.The effect of a smart grid on a society can be divided into benefits compared to the old grid, new opportunities that evolve, challengesthat have to be met, and issues to consider.The benefits compared with today’s grid can be directly linked to the drivers for the smart grid. The challenges that have to be met canbe of technological nature as well as society and market related.Allowing integration of renewable energy• Large scale renewable energy plants• Expansion of the small scale electricity generation marketThrough a smart demand response system in combination with storage possibilities the supply and demand for electricity can bematched, even when intermittent power sources are used in a large scale. This in combination with better transmission and distributiontechnology will allow larger wind farms or large solar power plants to be included in the energy system which enables powerproduction in more remote areas of the world such as off shore and dessert areas.The smart grid will also allow bidirectional flow of electricity which will make it possible for e.g. households to produce its ownelectricity. Smart technology is needed to optimize this small scale production and to integrate it with the grid.A more reliable electricity supply• Effective disturbance management• Manage and supply different energy quality to different users• Self healing networkSmart grid will make it possible to include more variability into the generation but keep the quality and secure the supply. Thanks toreal time system information the operators can manage and balance generation and demand and keep the right quality. Automaticdetection of error in the grid can be included and the errors can ideally be fixed without the customer noticing.By using metering and sensor equipment, a smart grid can anticipate a fault in the system before it occurs and allow for necessaryactions to be taken. If there is an outage, the smart grid can identify the source of the error and reduce the spread of the interruptionand respond more quickly than today’s grid. A smart grid could also be made self healing through artificial intelligence so that it couldanalyze and learn strategies to avoid future errors. The higher degree of automation and self-healing applications reduce operationaland maintenance efforts and, therefore, enhance the profitability of electrical networks.A more efficient energy use• Optimises grid operation and grid infrastructure• Reducing losses in the grid76
Oskar Karlsson, Petter PolsonMaster <strong>Thesis</strong> 2011 at Chalmers University of TechnologyDistributed generation from many small producers gives production close to consumption. This means less losses and less load onlarge transmission grid. Necessary investment in the transmission network can be postponed if the electricity is transferred smarterand used closer to the generation.With smart metering interruptions in the grid will be easier to detect and correct. Weak areas with poor power quality can be identifiedand necessary measures taken more easily than today. This will make investments more cost efficient since the DSO knows where inthe network the money will give the best outcome.Enabling a change of the vehicle fleet into electrical vehiclesOne of the major benefits with having a smart grid is that it enables a large scale expansion of electric vehicles in the vehicle fleet.• It is better for the environment and climate as well as the local city environmentoIf the electricity is produced from renewable sources no greenhouse gases are emitted.oAn electric vehicle is cleaner and does not emit particles, CO, NOx or other harmful compounds.oAn electric engine is quieter and runs more smoothly than a combustion engine.• An electric engine is more and efficient than the combustion engines.oIt can use the brakeage power to recharge the battery.oThe electric drives have fewer moving parts and are more controllable than combustion engines which give lessfriction losses.oNo idle running when the car stands still.Smart grid technology can enable charging of EVs when the demand, and price, is low or when there is a large supply from renewablegeneration. If charged during off peak hours, the effect on the grid is small when changing the vehicle fleet into an electric one. Smartcharging can be included to make sure that cars are charged during night rather than when people get home from work. This is calledGrid to Vehicle control (G2V).A future possibility is to not only see the electric vehicle as a load in the electricity grid but to include it as an active player by using thebatteries as storage devices. A first step towards using the electric vehicle for storage is to connect it to a smart communicating homeEMS, so called Vehicle to home (V2H). By doing this it is possible to use electricity from the car battery at peak demand when the priceis high or to use it to avoid blackouts. The next step is to use the electric vehicle fleet for large scale storage and send electricity from thebatteries back to the grid when the car is not used and the demand is high, so called Vehicle to grid (V2G). This has great potential forsolving both transportation and storage issues at the same time and E-cars become more than environmentally compatible vehicles.They are an important element of an intelligent energy infrastructure and contribute to the grid’s ability to compensate for fluctuatingpower production from renewable sources and distributed generation units.Enabling active consumer participation and demand response• Increase the customer awareness of their energy consumption• Clear price signals which gives incentives for changing the demand77
Conceptual <strong>Design</strong> of Temporary Exhibition Platform and Smart Grid Exhibitionfor Siemens Urban Sustainability CentreSmart grid technology will allow the customers to be more involved in the energy system and make active choices on electricity usagedepending on the supply. Through a variable electricity price and smart products, the consumer can change the demand to cheaperoff-peak hours and therefore getting a lower electricity bill. This so called demand response system is one of the main advantagesthat come with smart grid development. Demand response enables a large scale expansion of intermittent power generation, byshifting and balancing the load and decreasing peak demand. A demand response system will need to be developed from severaltechnology areas and includes advanced metering infrastructure and distribution management as well as smart customer productsand interfaces. The first customer group that will have a large effect on the demand response development is the industry, since it ismore concerned about the electricity price.Storage is the biggest technological challengeEnergy storage is an important part of a smart grid and brings a challenge for technology development. However, storage is not abottle neck for smart grid development; there are solutions today that works but the technology can be improved.Solution for energy storage is needed in the future grid of several reasons:• To even out the supply from intermittent sources and thus enabling more renewable power production in the energy mix.• For time-shifting which means buying cheap electricity and use it when the demand is high or sell when the electricity isexpensive.• Good storage equipment gives decreased need to expand the grid today and thus postponing expensive investments andsaving money.Different storage technologies are needed for different applications.• Pump power plantoMatches wind power well but dependant on geographical situation• BatteriesoMany different kinds are being developedoUsed in electric vehicles• Air cagesoEfficiency under 80% but environmentally friendly• FlywheelsoSuitable for frequency control, short time usage and can be recharged many times• Super-condensers78
Oskar Karlsson, Petter PolsonMaster <strong>Thesis</strong> 2011 at Chalmers University of TechnologyoHas large potential but needs development• Fuel CellsoPromising but needs hydrogen infrastructure• Thermal storageProsumers and virtual powerplants• Consumers may also be producers of electricity• A prosumer can either use the electricity or sell it back to the grid in a bidirectional grid• Small producers can get together and form a Virtual power plant to optimize the productionConsumers can also generate electricity and use it, store it or sell it to the grid and thus acting as so called “prosumers”. Many smallelectricity generators can get together to produce electricity as a virtual power plant. A virtual utility is a cluster of power plants andstorage facilities controlled by one Energy Management System, EMS. The EMS checks demands and production in each part of thecluster and decides what to distribute and where. Coming together in a virtual power plant can also be a way for small producers toget market shares.Cyber security• Becomes more and more important when more things are connected. If our energy supply depends on ICT, the security issueis of great importance.• Already an issue in banks, mobile phones etc. We still use credit cards.Personal integrityMore details on our habits are registered, metered and stored, and can be used in advertising etc. This can mean both new businessopportunities but also raise new questions as “How much information do we want to give out?” and “Who owns the information?”New legislation will be needed to make sure that the information is not misused and to protect the personal integrity of the user.Future scenario: Self sustaining micro gridsMicro grids, like “Islands”, that are self supplying with local power sources in combination with power storage is a possible futurescenario. For developing countries smart grid technology can provide the means to electrify remote located rural areas by creatinga micro grid. These local grids can later on be added to the electricity system when the national grid is growing and covering largerareas. A smart micro grid makes it possible for isolated regions to be completely self-sustaining on electricity which enables a cleanand sustainable development all over the world.Future scenario: Connect the world with a supergridThe larger a grid is the more reliable and secure it can be. Renewable electricity can be produced where the sun shines or wind blowsand then distributed to where the demand is largest at the moment. This leads to the scenario for the future where all continentsare connected with the same so called “supergrid”. It could be possible to supply the worlds need for electricity solely by harvestingsolar energy in the dessert areas around the world and this energy could be distributed through a world-wide smart supergrid. HVDCtechnology is used for long distance low loss transmission and smart energy management systems are needed to solve the complextask of bringing electricity to the users in the most efficient way.79
Conceptual <strong>Design</strong> of Temporary Exhibition Platform and Smart Grid Exhibitionfor Siemens Urban Sustainability CentreActors & MarketsThe development of the smart grid will affect the whole energy system and markets involved. Investments are needed along the wholechain of electricity generation and consumption and new business opportunities will emerge as not only the rules, but the whole gameplan changes. It is therefore important for an actor to know the roles in the smart grid development, and be prepared for the newconditions in the market.Important actors are:• Transmission System Operators• Distribution System Operators• Power generators• City planners• Aggregators• Consultants (for power generation, building construction etc.)Customers can be divided into three different categories:• Industry – driven by logic and considers energy as an input.• Commercial buildings – considers energy a cost to be rationalized to make profit.• Households – wants to decrease cost and might be intrigued by cool equipment. Harder to adapt to changes than the industryhas.New business opportunitiesThe smart grid development will bring new business opportunities for companies in the energy market. New products and servicesthat will emerge are:• Electric vehiclesoCars and batteriesoCharging infrastructureoVehicle to grid communication80
Oskar Karlsson, Petter PolsonMaster <strong>Thesis</strong> 2011 at Chalmers University of Technology• PVs for small and large scale production• Smart household equipmentoSmart MetersoSmart home appliancesoInterfaces towards customers• Energy management and optimisation systemsoSoftware to optimise and control power production and consumptionoHome energy management systemsoVirtual power plants• StorageoSelling energy storage equipment or providing storage capacity to power producersInvestments, cost and benefitsThe cost/benefit balance is easier at the beginning and at the end of the line.• Production investments and benefits can easily be calculated on short term or long term; however you need to consider futuresubsidy systems.• Energy efficiency measures including smart technology within the metering in industry and houses are possible to calculateand make profitable.• Transmission investments are of distinct infrastructure type and are usually done with public money. Can also be financedtogether with other countries and regions.• Distribution investments are the hardest to analyze and most problematic from a company perspective. The profits can bemade by the ones who find the best solutions on the market today. New regulation may be necessary.81
Conceptual <strong>Design</strong> of Temporary Exhibition Platform and Smart Grid Exhibitionfor Siemens Urban Sustainability CentreProblems appear when investments and profits don’t appear at the same place in the electricity chain. Nobody wants to makeinvestments in the grid that don’t pay back. However, large investments are necessary both on the production side to meet the newdemands and on the transmission and distribution side to improve the grids. There are high risks involved in new investments and thecost must be divided between different actors. Political mechanisms are usually needed for the investments to get going.The road to the smart gridThe steps that need to be taken towards a smart grid differ a lot between regions depending on the situation today and what drives thesmart grid development.Regional characteristic to take into account:• Energy mix, current and planned• Demand, current and future from different sectors e.g. industry, transport, households• Status of existing grid and planned transmission and distribution networks• Neighbouring regions and possible connections• Market structure and regulationsDemonstration projectsCommercial scale demonstration projects are needed to capture real-world data and see how the technology works with the market andregulation systems as well as with the end-user. Large scale demonstrations will give shared learning among the participating actors,decreased risk when investing in new technology and finding best practice methods for smart grid deployment.Setting new standardsSmart grid technology will bring together many industry sectors that have not previously worked with each other and combinedifferent products into one solution. At the same time, large investments are necessary to speed up the smart grid development. Thisgives a need for good interoperability between companies and products to decreases the risks with the investments. Standards aretherefore crucial for a variety of products and services in the smart grid field.Case studies and productsSiemens is a global company and has presence all over the world with knowledge within a broad range of disciplines. It is the onlycompany with integrated energy and infrastructure knowledge and products to supply solutions throughout the entire energy chain.This is needed to meet the new challenges that come with an increasingly complex and changing energy situation in the world. Thenew smart grid technology needed for the different steps in generation, transmission, distribution, and consumption can all be foundin Siemens’ portfolio.The approach for presenting products is to have a customer’s perspective and start with a challenge that relates to smart griddevelopment.Product categories:Siemens smart grid products can be divided into the categories E-mobility, smart distribution, smart consumption, and efficientnetwork. On top of these categories Siemens’ smart grid compass can guide the costumers into the right investments within the smartgrid field. Siemens can supply consultancy expertise that helps actors in the industrial and public sector to find their path in the smartgrid development.E-mobilityThe vehicle fleet in the world is transforming into an electrical one and the number of electric vehicles worldwide is expected to riseto 12 million by the year 2020. This transformation will lead to great challenges but also bear great potential. Siemens solution is a82
Oskar Karlsson, Petter PolsonMaster <strong>Thesis</strong> 2011 at Chalmers University of Technologyself-integrating network and EV infrastructure that makes sure energy is available to supply mobility at any time and in a sustainableway.Siemens can provide an integrated approach for the entire e-car infrastructure including various charging solutions, information andcommunication technologies, and billing solutions that make possible the seamless interaction of e-cars, operation centres, and powergrid.Examples of products:Charge CP700AThis is a charging point with built in safety that is prepared for communication with future smart grid infrastructure.Smart distributionThe Smart Grid is developing into a decentralized energy network and the distribution of electricity must be as efficient as possiblewithout failing in reliability. To cope with this an intelligent infrastructure is needed which can be observed and controlled in a smartway, and which is prepared for tomorrows energy mix.The higher degree of automation and self-healing applications reduce operational and maintenance efforts and, therefore, enhancethe profitability of electrical networks. Consequently, telecontrol and online monitoring of substations improve operational safety.Smart metering solutions from Siemens combine sophisticated metering functions, the management of distribution networks, andthe integration of back-end IT systems. These solutions were specially developed to suit the new challenges the liberalised energymarket poses on distribution network operators and energy retailers and ensures maximum transparency for end customers. Thisallows network distribution operators to optimize essential key processes and offer new services like flexible billing to their energysuppliers and customers.Examples of products:SIPLINK/SIHARBORShoreside power supply for ships to power the boat when in harbour.Smart buildingsBuildings are one of the major energy consuming sectors with a great potential for efficiency measures. Smart building solutions helpoptimising interactivity with the Smart Grid for maximum energy savings in buildings.Siemens’ smart building solutions make it possible for buildings to take advantage of automated demand response programs thatimmediately shift electricity demand from the least critical functions to where power is most needed.Furthermore, they automatically store energy for later use when prices are most favourable. The building can go from being an energyconsuming player into being a prosumer that re-feeds energy to the grid when the production is higher than the consumption. Thisprocess can be optimised with the smart buildings solutions which give the customer the possibility to making money on energyinstead of spending it.Examples of products:BMS – Building Management SystemControl and optimise the energy usage in a building by regulating when to buy, sell, store, and use the electricity and heat. Can alsoinclude the e-car into the building system and use that as a storage device.Smart MeterMeasure and communicate the energy usage in a building.Efficient networkAn efficient network means both a grid that transports electricity with small losses and a network that is operated and controlled inan efficient way.83
Conceptual <strong>Design</strong> of Temporary Exhibition Platform and Smart Grid Exhibitionfor Siemens Urban Sustainability CentreTechnologies from Siemens such as high-voltage direct current (HVDC) transmission and flexible AC transmission systems (FActs)help connect large-scale wind, hydro, and solar power generation to the grid – even when generation takes place hundreds, or eventhousands, of kilometres away from the of consumption.Siemens communications solutions enable online monitoring and control of all grid assets, which in turn means fastest possiblereaction to faults and minimized downtimes. In many cases intelligent substation automation and protection solutions in combinationwith the Energy Management System (EMS) will even enable the Smart Grid to react autonomously. Advanced condition monitoringsolutions from Siemens help optimize grid usage through continuous information about the state of the devices in operation andhigh-quality evaluation for minimized downtimes, reduced life cycle costs, and an extended service life of the assets.Examples of products:HVDC plusHigh voltage direct current electricity transportation with high efficiency in long range applications.PSS®SINCALPlanning software for electricity and pipe networks. Optimise existing networks, identify hot spots, forecast problems, and plan andoptimise new investments. Targets larger industries, power companies and cities.DEMS – Decentralised Energy Management SystemDEMS is the intelligent way to manage decentralised generation and virtual power plants. It is a software to put on top of the buildingmanagement system and link supply and demand sides. The software can be used to control virtual power plants so that small scalegenerators can be optimised. It can also forecast and optimise the demand side to create demand response.8DJH Gas insulated medium voltage switchgearCommunicative substations that provide information within the network. The gas insulation allows compact design for use in cities.Used for monitoring and load-flow controlling through remote controlling.NXAIR Air insulated medium voltage switchgearSafe to operate.NXPLUS C WindInnovative feed in technology for wind power. Maintenance free equipment.SIPROTEC 4Future-proof seamless communication device to be placed in e.g.switchgears to protect, control, measure, and automate. Digitalprotection technology in all fields of application.OVCB – Outdoor Vacuum Circuit BreakerCircuit braking and reclosing medium-voltage device that can stand outdoor weather condition.84
Oskar Karlsson, Petter PolsonMaster <strong>Thesis</strong> 2011 at Chalmers University of TechnologyAppendix II - MECE Analysis - Facts & TARGET USERWhat prior knowledge doesuser group 1 have?User studyWhat prior knowledgedoes the visitor have?What prior knowledge doesuser group 2 have?User studyWhat prior knowledge doesuser group 3 have?User studyWhat informationshould be presentedto the visitor?What new knowledge does SIEMENSwant to communicate?InterviewsWhat new knowledge is ofinterest to user group 1?What other knowledge is of interestto the user?Literature studies/InterviewsWhich of this knowledge is possibleto communicate to the user?User studyWhat new knowledge does SIEMENSwant to communicate?InterviewsWhat new knowledgeis of interest to thevisitor?What new knowledge is ofinterest to user group 2?What other knowledge is of interestto the user?Which of this knowledge is possibleto communicate to the user?Literature studies/InterviewsUser studyWhat new knowledge does SIEMENSwant to communicate?InterviewsWhat new knowledge is ofinterest to user group 3?What other knowledge is of interestto the user?Literature studies/InterviewsWhich of this knowledge is possibleto communicate to the user?User studyWhat user groups doesSIEMENS want to target?Interview SIEMENSWhich are thetarget user groups?What other user groups dousually go to similar centres?What similar centres arethere?Interview EVENTWhat user groups go tothem?Collect statistical data fromsimilar centre85
Conceptual <strong>Design</strong> of Temporary Exhibition Platform and Smart Grid Exhibitionfor Siemens Urban Sustainability CentreAppendix III - MECE Analysis - PresentationHow should the facts becommunicated to user group 1?How should the facts becommunicated to user group1 in an interactive way?How should the facts becommunicated to user group1 in a non interactive way?User studyUser studyHow should the facts becommunicated?How should the facts becommunicated to user group 2?How should the facts becommunicated to user group2 in an interactive way?How should the facts becommunicated to user group2 in a non interactive way?User studyUser studyHow should the facts becommunicated to user group 3?How should the facts becommunicated to user group3 in an interactive way?How should the facts becommunicated to user group3 in a non interactive way?User studyUser studyHow should this informationbe presented to the visitor?How should awareness andinterest be evoked throughvisual impressions?How should this be evoked inan interactive way?How should this be evoked ina non interactive way?User studyUser studyHow should awarenessand interest be evoked?How should awareness andinterest be evoked throughsound impressions?How should awareness andinterest be evoked throughsmell impressions?How should this be evoked inan interactive way?How should this be evoked ina non interactive way?How should this be evoked inan interactive way?How should this be evoked ina non interactive way?User studyUser studyUser studyUser studyHow should awareness andinterest be evoked throughhaptical impressions?How should this be evoked inan interactive way?How should this be evoked ina non interactive way?User studyUser study86
Oskar Karlsson, Petter PolsonMaster <strong>Thesis</strong> 2011 at Chalmers University of TechnologyAppendix IV - Weekly report (Example)WeeklyRepoR ttempoRaRy exhibition on SmaRt GRidS foRSiemenS URban SUStainability CentRepRojeCt oUtlinethe project aims to produce a concept for a temporary exhibition on the topic of Smart Grids in the SiemensUrban Sustainability Centre. the temporary exhibition will be on a deep dive customer specific level aiming toencourage discussion and aid in decision making and investment. the target audience groups for the exhibitionare a public political body and Siemens related Commercial actors.oSkaR kaRlSSon & petteR polSonReCent aCtivitieS• produced a pedagogy and technology overview.•••market and observation user studies and seminars at visual forum in Göteborg.produced a draft for an exhibition impact sheet (what impact the exhibition shouldhave on the visitors).Worked with a questionnaire to the elfack fair next week.identified pRoblemS• the Germany trip is not yet fully organized, meeting in berlinis not set up.•We need a better knowledge of Siemens Smart Grid products.ReSUltS• Clearer picture of what pedagogical and technological tools we can utilize in theexhibition.• Gained information on interactive learning.the next Step• attend seminars and perform observation studies and questionnaires at elfack.•••Coordinate a visit to Siemens Germany offices.meeting with lina bertling from Chalmers.Summarize data collection.SolUtionS• We hope to gain deeper knowledge on Siemens’ smart grid products and servicesfrom our Germany trip.aSSiStanCe needed• organizing the Germany trip and setting up the meetings. Carol Gelder is alreadyworking on this.Project PlanningData Collection & AnalysisIdea Generation & Concept EvaluationVisualisation & Documentation87
Conceptual <strong>Design</strong> of Temporary Exhibition Platform and Smart Grid Exhibitionfor Siemens Urban Sustainability CentreAppendix V - Seminar transcriptsSeminars at Visual ForumGöteborg 2011-05-03The visit included lectures and seminars on the topic of visualization and learning, and observation studies and market studies on theexhibits.About Visual ForumVISUAL FORUM is the leading Scandinavian visualization conference and was held for the seventh consecutive year in Göteborg. Itfocuses on visualization technology for businesses, researchers, academia and public sector.Speakers:Hans Willehader, architect firm BIG, Denmark.Karl Alfredsson, Centre of Pedagogy & Didactics, Gothenburg.Odd Tullberg, Deputy of Visualisation & VR, WSP, Stockholm.Pontus Jakobsson, CEO Sightline AB, Stockholm.Andreas Lykke-Olsen, architect firm Kollision, Denmark.Results from the Seminars• BIG used a “comic book styled” publication to tell the story about their company and core values.• BIG urged the value of “Hedonistic Sustainability” i.e. People need to be informed that living a comfortable andenjoyable life isn’t in conflict with a sustainable future.• BIG often use art in their architecture. It adds value to the building and its surroundings.• KA emphasised the importance of active participation and emotional engagement in the learning process (modelAccenture, 2000).• KA argued that the best way to gain a deeper understanding of complex systems is performing real projects andsimulating real projects by a game is the second best.• When using technology in learning you need to consider the content, the available technology and the pedagogicalaspect (model by Ruben Puentedura eller Mishra, P., & Koehler, M. J. (2006). Technological Pedagogical ContentKnowledge: A new framework for teacher knowledge. Teachers College Record. 108(6), 1017-1054.).• To teach sustainability in urban planning you need to:o Create common knowledge for all target groupso Make them talk to each other and understand each other.o Consider who’s leading the discussions and holding the presentation.• KA argued that games work on adults as well as on kids when it comes to learning. You just have to use vocabularyand a setup that fits the target group.88
Oskar Karlsson, Petter PolsonMaster <strong>Thesis</strong> 2011 at Chalmers University of Technology• OT & PJ argued that VR models are good to store and present large amounts of data. It speeds up the discussion andlearning process.• Actors become more engaged and involved in the discussions if they felt that they contributed to the VR model.• ALO emphasised the importance of getting the public involved in city planning (“the involvement process”).• “There is no single perception of the common good”.• “Everyone has different emotions and want different things”.• ALO introduced the AELIA model (Attention, Experience, Learning, Influence, Action) as a way to engage the public.DiscussionIncorporate a game aspect to the exhibit will make the user participate more actively and be more emotionally engaged in thuslearning more about the topic. It is important to be aware of what pedagogical setup and vocabulary that is used so that it targets theright audience. Just like the content and the technology, the pedagogical perspective plays a big role in every exhibition. To actuallyinduce “action” is an important part of communication that needs to be considered in the concept for the exhibition.Using historical persons can be a good way to put things in historical perspective. To look at people instead of technology can illustratehow things have evolved. Paradoxical ways of presenting information (i.e. comic book style graphics to show science) attracts attention.It is important to induce positive emotions and avoid hopelessness when communicating and educating. The use of non-logical(aesthetical) visual, audible or tactile elements can be used to enhance messages and create the right atmosphere. Involvement andthe possibility to change and affect content make people more engaged, especially if combined with the “recognition-factor” i.e. beingable to affect your own city.Seminars, Elfack fair 2011Professor Lina Bertling – Head of Division Electric Power Engineering, Chalmers University of Technology• Her focus was on renewable electricity production from wind power and on transport, which are important issues inSweden and globally.• EU’s 20-20-20 goals are the drivers.• There are two important international cooperation; ENARD – bottom up approach based on technical requirementsand ISGAN – top down approach based on political targets.• Main questions for developing a smart grid are to have a balance between production and consumption and tocontrol a higher capacity from renewable sources.Stig Göthe – SEK, Chairman of the board at Powercircle• Wind and solar power grows fastest in EU together with electricity from gas power plants.• Small producers can get together in a virtual power plant with smart technology.• Net owners have to adapt to changes that are coming into both producer and consumer side of the electricitysystem. They need to handle problems that occur without making any profit of their own.89
Conceptual <strong>Design</strong> of Temporary Exhibition Platform and Smart Grid Exhibitionfor Siemens Urban Sustainability Centre• Actorso Generatorso Network companieso Researcherso Energy service providerso Technology providerso Traderso Userso Regulatorso Government agencies• There was a political awakening in 2008-2009 when IEA started the network ISGAN on a political initiative.• This is a new pioneer age for electric power technology. New standards are needed to control IT, disturbances,security etc. and new innovations are needed to cope with technological challenges.• Smart grid has become the brand name for the change that is happening and is needed in the electricity grid.• In China and India new cities and electricity grids are being built. This is where technology leaps will be taken whennew grids are built from scratch. In the Western world there will be more upgrading of the existing grids.Håkan Johansson – ABB, head of smart grid market Northern Europe• The technology itself is not the biggest issue, the problem is how to get people using the technology.• New business models need to be created, perhaps more regulation and other political instruments (e.g. taxes) areneeded.• Energy efficiency measures can give 30% higher efficiency in electricity usage.• Most parts of the transmission grid are already automated today. This is not the case for the distribution grid.• Defining a smart grid:o Start with the technologies and products that are part of the system.o Start with the problems and challenges that need to be solved.• Smart grid is a growing area of technology that demands global standardisation.• It is the consumer that expedites development of standards but the consumer has not participated in the electricitymarket before.90
Oskar Karlsson, Petter PolsonMaster <strong>Thesis</strong> 2011 at Chalmers University of TechnologyDiscussionSmart grid has become a fast growing area for research, technology development, and political discussions the last couple of years.It has become the brand name for the change that is happening and is needed in the electricity grid to maintain a balance betweenproduction and consumption when a higher capacity from renewable sources will be incorporated.The biggest focus today is on integrating more wind power in the energy mix and to start the transition towards electric cars in thevehicle fleet. At the same time, lots of investments are needed to upgrade the electricity grids worldwide to cover a higher demand. Theinvestments are different for different parts of the world due to the energy situation and the existing grid.Smart grid technology will enable new actors to enter the electricity market e.g. small scale producers and new energy serviceproviders. New market solutions are needed to cope with the changes and to make sure the necessary investments in the grid happen.The smart grid technology itself is not an issue, the problem is how to get people using the technology. Other bottlenecks arelack of standards in the industry which slows down development and integration of the new technology, and unclear politicalsteering.91
Conceptual <strong>Design</strong> of Temporary Exhibition Platform and Smart Grid Exhibitionfor Siemens Urban Sustainability CentreAppendix VI - Interview transcriptsInterviews with Siemens personnelThe following persons were interviewed:Werner KruckowBettina PeckDavid KitchingJo HencherPhil SkipperWilfried LammersIna NierodaRobert SchlammingerHeike OnkenMichaela Stolz-SchmitzDietmar StaackMonika LischkaRalf ChristianSiemens in general• Siemens is an honest, trustworthy and practical company. They only show real data and does not give promises that theycannot keep.• Siemens core values are:oEmployees – brain poweroExcellence - technologyoInnovation - technologyoEfficiency• “Tomorrow is today” – slogan at Siemens exhibition at Masdar. Not promising things for the future but supplying the toolstoday.• Siemens is not a “good provider”, Siemens is “the company” for SG products.92
Oskar Karlsson, Petter PolsonMaster <strong>Thesis</strong> 2011 at Chalmers University of TechnologySmart grid message• Smart grid is not a player in the system, it is a concept.• No smart grid is the same, it depends on the situation.• We are not going to preach right and wrong about smart grid, instead give Siemens’ view on the topic.• Paradigm shift in electricity generation between the 20 th century and the 21 st .oMore complex than the chain model for distribution.oRenewables instead of fossil.oLoad follows generation instead of the other way around.• Drivers for a smart gridoBalancing the grid.oLoad-shifting.oReliability – important in the US.oEfficiency – EU 202020 target.oDecreasing carbon footprint.• Time frame: 1 st step has already been taken; houses are being equipped with smart meters to prepare for the SG development.Next step is electric vehicles.• Bottlenecks in smart grid development:oPeople’s mindset has to change.oCountries need to agree and cooperate (standards etc.).oNew infrastructure is needed.93
Conceptual <strong>Design</strong> of Temporary Exhibition Platform and Smart Grid Exhibitionfor Siemens Urban Sustainability CentreoControl of renewable production.• Storage is a big problem, however not a bottleneck for building a SG. The technology today works but can be improved.• The near future is not fossil free; there will still be 50% fossil sources in the energy systems worldwide 2030.Regarding the exhibition in general• The building itself is used as part of the exhibition as an example of sustainable building technology with solar panels, rainwater harvesting, geothermal heating, natural ventilation and energy efficient lighting. The building is all electric.• The temporary exhibition (TE) should be moveable because it can be placed at other locations after it has been displayed atthe CUS.• Make the content adaptable/flexible so that it can be change later on. The latest products or case studies may not be the samewhen the exhibition is in place.• The TE is more business oriented than the PE. It will be placed in a higher security area and target a more specific group ofvisitors such as decision makers and buyers of Siemens products. However, the broad public should not be fully excludedfrom the temporary exhibition.• The Temporary exhibition will be part of a bigger package with conferences, performances etc.• A story is needed to evoke emotions.• Create a wow-effect and then communicate the content instead of the other way around. You have only 20 seconds tocommunicate the message.• There is no age limit in playing games, it is inspiring and captivating.• Use competitiveness for making the users more engaged in the learning process.• Interactive installations work well, even with business-visitors, and are of importance to the exhibition.• When using interactive functionalities, it is important that correct feedback is given to the user. He/she needs to understandwhat consequences his/her actions have.Smart grid specific exhibition• Important actors in the smart grid field:oTransmission System OperatorsoDistribution System OperatorsoPower generators94
Oskar Karlsson, Petter PolsonMaster <strong>Thesis</strong> 2011 at Chalmers University of TechnologyoCity plannersoAggregatorsoConsultants (for power generation, building construction etc.)• When presenting products:oStart from customer perspective, what is the challenge?oPresent Siemens’ solutions, if possible related to a case study.oShow the solution as a product portfolio and then specific products.oMake the product presentation flexible.oImportant products:• DEMS• Decentralized Energy Management System software.• DEMS optimizes virtual power plants by forecasting winds etc and regulating energy mix dependingon electricity price and load distribution.• DEMS is used in the USD.• Utilities are typical customers.• Can also be used in whole cities, e.g. London.• Positioned between the small scale electricity generation (from e.g. solar cells) and the BuildingManagement System that controls the loads.• DEMS optimized the system to minimize external (expensive) input.• Target is to have DEMS in the Low Carbon London project.95
Conceptual <strong>Design</strong> of Temporary Exhibition Platform and Smart Grid Exhibitionfor Siemens Urban Sustainability Centre• Smart grid compass:• Siemens offers consultancy to tailor-make steps for smart grid development.• Uses workshops and the tool smart grid compass.• Steps in smart grid development:oFocus on regional strategy instead of a time strategy since each situation is unique.oCover the world with challenges, drivers and cases. Siemens is a global company and the centre for urban sustainabilityis a global centre.oFocus on regions and drivers and relate to case studies.• Possible case study is the “Low Carbon Network” in London.Interviews with non Siemens personnelResults from interviews with others than Siemens personnel during the project are listed below.Regarding exhibition techniques• Interaction is important to attract and maintain attention from the visitors. People stay longer at the exhibit or installation andget more involved and engaged when they can influence the content.• Interaction is important regardless of the target group. It works for all ages, professions etc.• It is very important to “tell a story” with an exhibition to create interest. The different exhibits need to be connected and relateto each other in a relevant way.• Avoid too complex mechanical technology in an installation. Moving parts tend to break and need more maintenance.• Innovative technologies for interactive exhibits:ooooMulti touch tables – A large touch screen oriented as a table that the users can gather around and interact with. It is asuitable tool for discussion where all users are equal in the sense that they all can participate in the interaction.Object recognition – The multi touch tables described above can be used together with physical objects that are placedon it. The table can recognize predefined objects and identify where the object is placed and in what direction it isoriented.Motion control system – These types of systems use cameras or hand held devices to register movements from the userand enables touch free interaction. The technology can be found in different gaming consoles and uses cameras, accelerometersand sensors to detect motion.3D video – By using 3D video spectators can get a thorough understanding of the spatial aspects of a concept presentedand complex problems can be better communicated and discussed. A 3D movie also effectively catches the attentionof the viewer.96
Oskar Karlsson, Petter PolsonMaster <strong>Thesis</strong> 2011 at Chalmers University of TechnologyoProjection mapping – This technology allows projection of images or movies onto irregular surfaces. This can be usedto create a 3D environment.Regarding smart grid• Actors in the smart grid development:ooooooProducers – can be large and small, global and local.Venture capitalists – new actors that invests in projects.Equipment constructors – building e.g. wind mills. Find new niches or adapt existing.Producers of smart home equipmentAggregators – gathers information from different electricity generators to distribute.Users – can be prosumers, i.e. both producing and consuming electricity.• Bottlenecks in the smart grid development:ooStandards – the government should step in at large infrastructure investments. In this case, standards are needed toget technology development instead of the other way around.Technology lock-in – people are locked into old ways of thinking, fresh ideas are needed. Smart grid is a newtechnology area and can be a way to get new ideas into an old business.• The distribution net will be more like the transmission net is today, but who pays for the necessary investments?97
Conceptual <strong>Design</strong> of Temporary Exhibition Platform and Smart Grid Exhibitionfor Siemens Urban Sustainability CentreAppendix VII - Qualitative Observation studiesUniverseum, Gothenburg, 2011-03-30• All the decoration, furniture, lighting and music etc. worked together and created a sense of a whole. This added to the experience.• In an exhibit where the task was to solve a crime the feedback was very confusing. It was hard to understand if anything happened when thebuttons were pressed and if it gave the correct result. This generated at disappointed and embarrassed feeling since I didn’t manage to solve thetask.• The part of the exhibition where you got to act as a TV reporter and record a weather forecast was very appreciated and engaging. It was fun toget to act as a famous person and then see oneself on TV. You automatically wanted to look and talk exactly like the TV reporters which triggeredcompetition.• The exhibit where you got to act as a handball goalkeeper was very fun and engaging. It was very entertaining to use your whole body and try tocatch as many balls as you could. This triggered competition between the participants.• The exhibit that showed that pain can be controlled didn’t really work. This caused frustration and scepticism.• The “memory floor” triggered competition and was very addictive for the user although it was a bit unclear what you actually learned from it.• The idea to be able to create your own music from your pulse and hear what your body sounds like caught the participant’s attention. The useof both lights and sounds was fascinating.• Enclosed environments around installations made it easier to focus on the exhibits.• The “creepy” interior and framing at one of the installations created a lot of anticipation and excitement. It was very obvious that something scarywas going to happen but it wasn’t clear exactly what.• It wasn’t clear how to use the “frog sound installation”. You were supposed to press two buttons at the same time which was very problematic.This caused frustration and annoyance.The Gothenburg museum of Natural History, 2011-04-20• Hard to follow the “story” and focus on items if there is no clear “red thread”.• Annoying not to have a clear heading of what an exhibit is about. Too much information on a small space feels cluttered.• The wooden cabinets the exhibits were displayed in and the old fashioned interior design gave a sense of “Carl von Linné” and the categorisationof the species.• Exhibitions placed with one big exhibit in the middle and smaller ones around it.• Very few interactive exhibits. No sound. No haptic experiences.• Big, macabre, scary, disgusting or in other ways bizarre exhibits fascinated, attracted attention and got more viewing time.• 3D-objects enhanced the spatial experience and gave depth to the exhibits.• Touching the sharkskin was interesting and the feel of the texture on your fingertips gave a more vivid experience.• The huge model of the killer whale attracted interest. Its big sculptural forms fascinated and were beautiful to look at.• The many drawers with different butterflies in them were fun to investigate.• Some of them didn’t come out smoothly which was annoying.• There were so many of them that you couldn’t look in them all. This was a bit frustrating. “Where is the prettiest one?”98• There was no overview of them. You just opened them randomly.
Oskar Karlsson, Petter PolsonMaster <strong>Thesis</strong> 2011 at Chalmers University of Technology• Good that signs and text looked as old as the rest of the visual elements. Looked like they matched each other.• The Japanese Spider Crab’s size and spectacular appearance fascinated and caught attention.• To see the animals in their context was interesting and added to the understanding.• The use of colours and fonts in the exhibit about Caribbean fish enhanced the display.• The exhibit about mushrooms was unclear. The text was too small and difficult to read.• The section on how amoebas reproduce was explained in a clear way with a clear chronology. There was no need for text to understand.• The big “tree” that showed how different species are related to each other was very informative. “Man’s” branch was coloured red which madeit easy to spot and follow. Interesting to see which other species are closely or remotely related to us.• The many tiny handwritten signs were hard to read.• The exhibit about smaller birds was perceived as very cluttered. They had jammed very many birds in the same cabinet which made it hard tofocus on a single one. This was a shame since they were all very interesting and unique.• Putting an image or a painting behind an exhibit created a sense of depth which made you feel as if “you were actually there yourself”.• The section about how lighthouses can affect birds flight trails and ultimately lead to that birds die gave a very sad feeling. Felt guilty.• Some displays were situated very high up on the wall in narrow corridors. Most of the time you didn’t notice them at all. To look at them you hadto bend your neck in an unpleasant way.• In the main hall there were goat’s horns on the wall to symbolise variation. This was perceived better than the exhibit with all the little birds.• In the exhibits on animal phenomena’s models of the animal was combined with photos, graphics and text. This was a different approach thanthe exhibits about the animals themselves.• The exhibit about mites in houses caused a slightly disgusted feeling. This caused longer viewing time however.• The wooden floor and the rest of the interior harmonised with the exhibits of skeletons of whales and dinosaurs. Felt like a “typical museum”.• An exhibit where you could listen to whale sounds didn’t function properly. No sound could be heard which caused frustration and confusion.“Did I do it wrong?”Visualisation Centre, 2011-04-28From interacting with the installations and observing other visitors during the tour in the centre following observations were made.• Lego cityThis installation visualizes the city of Norrköping in white Lego. By projecting different colours on houses, rivers and thestreets, different messages could be communicated. This enables several “layers” of information in the same model whichmakes it more space efficient.Since the visitors recognized the city, they became more engaged in the exhibit and listened to the information presented bythe guide more carefully. It would be possible to use something similar with London in the USC.Not all messages they tried to communicate with this technique came across as intended. Different messages require differentcommunications to reach the receiver.• Virtual autopsy table99
Conceptual <strong>Design</strong> of Temporary Exhibition Platform and Smart Grid Exhibitionfor Siemens Urban Sustainability CentreThis exhibit uses a multi touch table to display a virtual autopsy. The installation encouraged interaction and was one of themost popular installations in the exhibition. All users around the table could participate in the interaction but some problemswere experienced when moving around the “body”.• The food on the tableThis was another multi touch table installation that showed what climate effect different types of food have. The user gotinformation about the food by placing paper discs with illustrations which represented a certain food types on the table.By combining the digital screen with physical objects the users got more involved in the interaction process. To physically pickup and place the paper disc on the table happened by intuition and at the same time encouraged action from the user.The exhibit was easy to understand and use for first time users and worked smoothly. Other types of objects could have beenused instead of the paper discs, such as models of buildings or power plants etc.• Mind ballThis exhibit was a game where the two contestants competed in relaxing the mind and not thinking. By measuring the brainactivity of the two competitors a ball was moved back and forth on a table and the person who relaxed the most could eventuallyscore a goal.The installation was very popular among the teenagers visiting the exhibition who queued up to compete against each other.Competition can play an important role in an exhibition, especially if done in a new and innovative way.• Molecule constructionIn this exhibit the user were supposed to construct molecules from atoms by using 3D goggles and haptic controllers.Getting both visual and tactile feedback enhanced the experience of this installation. To give the user a challenge is a good wayof creating interest, but it needs to be on the right level.• Electronic book and the animal displayThese two exhibits utilized cameras and motion control sensors so that the user could interact with it with his/her body. Eventhough the actual content of the exhibits were not very interesting the way of interacting with them still encouraged thevisitors to use them.• Snake boxThis exhibit mainly consisted of a black box with a viewing hole. Inside the user could experience how snakes perceive theirenvironment.The mystery of the black box appealed to the user’s curiosity and was therefore intriguing.• Archaeology gameIn this computer game the users were encouraged to dig for fossils. If the user managed to find three fossils before the timeran out the player then got to answer some question about the animal he/she just found the remains of and then earned amedal.The game targeted children but highlights the fact that playfulness and challenges can be a powerful tool when presentinginformation.• Face recognition100
Oskar Karlsson, Petter PolsonMaster <strong>Thesis</strong> 2011 at Chalmers University of TechnologyBy sitting in front of a computer screen and a camera, the user’s facial expression was registered and transferred to a digitalmodel on the screen. This exhibit mainly showed, in a playful way, that face recognition technology is available today.• Fish sensorIn this exhibit the user got to experience how a fish orientates through tactile sensing instead of vision. The user had to weara blindfold and had to rely on a hand held sonar device to orientate which was exciting.Visual Forum, 2011-05-03• Yrkeshögskolan Göteborg: No attractor or walls around the installation, only roll-ups, a computer and some brochures.Popularity: 4.• Lindholmen Science Park: Had attractor but a bit unclear what it does. Computer screen showing film. No walls around theinstallation. Popularity: 2.• VIC Stockholm: Roll-ups without little information. No screens and no real attractor. Very few visitors.• Projectiondesign: Large projection screen showing the visitors in 3d when using goggles. Also other screens and interactiveinstallations. Popularity: 5.• BARCO Sverige AB: Not very effective or useful attractor, they couldn’t show anything with it. It was used in medical applicationsbut none of them could be shown. Nice posters and complementary chocolate. Popularity: 3.• Ats AB: Showed a cool movie of a laser scanned square in Gothenburg. The actual laser was the attractor of the installationwhich also consisted of some roll-ups. Popularity: 6.• SIMBAL: Interactive precision controller as the main object of the exhibit. Interactive challenge for the visitors to try theinstrument. Popularity: 5.• Visualiseringscenter C & Sectra: Large model of a virtual autopsy table as the main attraction. Interactive and popular amongthe visitors. Popularity: 5.• EON Development AB: Large screen with CAD model of scoter and kinect camera to interact with it. Also a laptop with a3D screen with face recognition so that visitors could control the object on the screen with their eyes. The exhibits wereimpressive but the functionality was not perfect. Popularity: 5.• jDome: Situated in the lecture hall instead of the main hall. The actual product, a half spherical projection screen withinteractive functionalities, was the attractor in the installation. Visitors could step inside the half sphere and move around ina virtual landscape by moving their body. Popularity: 3.101
Conceptual <strong>Design</strong> of Temporary Exhibition Platform and Smart Grid Exhibitionfor Siemens Urban Sustainability CentreAppendix VIII - Quantitative observation studyQuantitative observation study at ElfackThe observations from the Elfack fair were summarized into a 13 by 16 matrix with the different companies/exhibits on the one axisand the different aspects that were observed on the other. Features like size, popularity, interactive objects, colour scheme, personnel,giveaways etc. were studied. The different cells were then colour-coded with respect to the degree of impact it was judged to have onthe exhibitions popularity.Company Esylux Ahlsell Cetec Schneider Electric ABB Elektroscandia Elma instruments MilwaukeeSize [m] 10x10 15x15 7x12 30x15 30x30 20x20 7x12 8x8Popularity [1-5] 5 5 5 5 4 4 3Two cabinets in theFour installations with aAbout ten large About forty installations showingAbout seven. Mostly Two workbenccorners. OneAbout six. One car andInstallations Four product shelves product and a screen atinstallation with arc products and some separateshelves with products. Shelves with pinstallation with asome screens on tables.each.shaped covers. screens.Two heat cameras. the walls.screen in the corner.Interactive objects Lightswitches Competitions NoTouchscreen showingSchneiders business.Dollhouse with buttonsshowing homeappliances.CompetitionHeat camera. Car.Heat cameras. Productsto try.Usable drills atstations.ColourGrey/white/red. Sametype as their logo.White and blue as inlogo. Blue lighting.Colourful in beach style.Green and white allover. Green texts onwhite background.Grey, white and black. Not verydistinct but the logo is visibleeverywhere.Mostly white surfacesand black floor.Black and the logo,products in differentcolours.Red and whitethe interiors anproducts.Interior designBar table and regulartables with chairs. Barwith food service.A bar, some bar tablesand an arm wrestlingtable in the centre.Large bar on sand. Awooden deck withchairs.Large exhibition, roundbar in the middle, samecovered installations inshiny white plastic.Bar and a separate caféLarge bar with food service in the which was popular.centre, somewhat enclosed. Shiny Screens andexhibits in straight rows.installations frames thearea.One small table,otherwise mostly steelshelves with products.Cluttered.Small bar but fthe benches. Lend hardwareGive awaysHamburgers, drinks,water bottles.Drinks at the bar.Sausage and drinks inthe bar. Also sweets,pens etc.Nuts and drinks in thebar.Fruit and sanwiches in the barand waterbottles.Cinamon buns in thecafé, drinks in the bar.Soft drinks and bagswith brochures.Coffee in the bPersonnelDressed in red brandedshirts. Ladies in tights to Blue company polos.attracts visitors.Mostly in the barwearing hawaii-shirts.Lots of personnel,dressed in green.At most of the installations,dressed in black with blue orgreen ties.Well dressed in suitsand bowties.A few dressed in black.All dressed in rScreensPostersNo screensLarge poster behind thetables.One for eachinstallation and fourabove the bar.One behind eachexhibit.One at the cornerinstallation.NoAt most installations,some larger, one touchscreen, also in theceiling.Only prints on the walls.Computers at most installationsfor showing product systems.Large at the bar and smaller atmany exhibits.At most installations.One connected to theheat camera.Some in the café.At the heat cameras andNoone computer.In the ceiling and at theside.Some picturescorner shelf.AttractorPoster in the ceiling.Large arc shape withpicture over the bar.Arc with logo over thearm wrestling table.The bar itself.Large screen in ceilingand all the arc shapedinstallations.Some larger installations andproducts.The car and a largeround installation.The poster in theceiling.-Other -Arm wrestlingcompatition and sledgehammer competition.Music and party mode.Answer some questionsabout Schnieder andwin an iPad.Competition; hit blinking lights. - - -Green cells=big positive impact on exhibition popularityYellow cells=some positive impact on exhibition popularityRed cells=negative impact on exhibition popularity102
Oskar Karlsson, Petter PolsonMaster <strong>Thesis</strong> 2011 at Chalmers University of Technology3hes.roduct atEnsto Siemens Sevvodan/Niko Novum Delta Brennenstuhl Helakabel20x10 10x30 15x5 15x10 15x5 15x5 15x33 3 3 3 2 1 1About eight. Someproducts on tables andon unusual lookingshelves.About eight exhibits, one smallwind power plant and one largeproduct on the floor.Two screenwalls with information,one table with products and a ballthrowing game.Four product shelves and onearmwrestling game. Very open.Three installationsshowing products onbenches.Two brochure standsand three productshelves.One shelf withbrochures.the workNo, but products youcan touch and hold.Touchscreen showing Siemensbusiness.Throwing competition. The armwrestling game. No No No, both ond on theGreen on floors and onsigns, otherwise cleanwhite surfaces. NiceTurquoisegraphics in the samecolour palette and goodlighting.Mostly white and grey.Yellow and black on installations,posters and floors.Blue, white and green,both on floor andposters.Not very distinct. Redchairs.Black walls, grey floor.Colourful cabel-wall.ocus onike a highstore.Geometrical shapes andgood quality plasticinstallations. One largearc shaped in the centreand a food service atthe edge. Good lightingNice sofas, tables and plantscreating livingroom feeling. Twosidedbar and installations. Whitepassage in the middle and blackfloor under the installations.Spinnable information signs and abar table.Large bar in the centre. Blackpassage in the floor that leads tothe bar. Installations on the sides.One bar table,otherwize just theirproducts.One bar table and oneregular. Looks like ahardware store. Stronglights.Room surrounded bycable walls. Two bartables.ar.Pens, sausages anddrinks.Coffee and cookies in the bar. Chocolate, fruit and coffee. Ice-cream and drinks in the bar. No Brochures Coffeeed.Green and white stripedshirts with grey pants.Mostly men in black.Young model girls and someworkers. All dressed in black polos.Men in black.Not dressed the sameway.Two persons showingproducts. Dressed injackets.Few, dressed in black.at aOne at the food servicedesk and one in acorner showing nicemovies.At the installations and one largeat the bar.One computer.Pictures at the walls. Large cubicle shaped in the ceiling. In the ceiling. Large with logo behind the bar.NoLarge screen showingnice case study movie.On the walls.No screensSome on the wall.NoOnly some prints at thewalls.The arc shape with Large posters above the bar. NiceThe spinnable information signs andlogos and signboards on tree poster at the "livingroom" andLarge poster above the bar.the ceiling poster.top.large Siemens products.Signboard in ceiling.One large poster withlogo in ceiling. Noattractor on the floor.The cable walls.- -Throw balls in holes to score pointsand win an iPod.- - - -103
Conceptual <strong>Design</strong> of Temporary Exhibition Platform and Smart Grid Exhibitionfor Siemens Urban Sustainability CentreAppendix IX - Media Technology toolbox104
Oskar Karlsson, Petter PolsonMaster <strong>Thesis</strong> 2011 at Chalmers University of TechnologyAppendix X - QuestionnaireSmarta ElnätTack för att du tar dig tid att fylla i denna enkät. Resultatet kommer användas i ett examensarbetevid Chalmers tekniska högskola som kommer mynna ut i en utställning om Smarta Elnät.Din medverkan är helt anonym och mycket betydelsefull för vårt fortsatta arbete.Jag är…Under 25 år25-40 årÖver 40 årUtbildningVälj den senast avslutade eller pågående utbildningsnivån!Högskoleutbildning inom teknikAnnan högskoleutbildningGymnasieutbildning inom teknikAnnan gymnasieutbildningÖvrigt:BranschStudentPolitikerStatsplanerareElproduktionEldistributionElinstallationÖvrigt:105
Conceptual <strong>Design</strong> of Temporary Exhibition Platform and Smart Grid Exhibitionfor Siemens Urban Sustainability CentreSmarta ElnätFrågorFråga 1. Vad anser du ingår i begreppet Smart Elnät?Kryssa i en eller flera rutor!ElbilarSolcellerNya elmätareEn ny slags elektricitetNytt sätt att transportera strömKommunikationInfrastrukturFörnybar energiElsäkerhetÖvrigt:Fråga 2. Hur kommer det Smarta Elnätet uppstå? Vilken av nedanstående beskrivningaranser du vara korrekt?Välj ett alternativ!Det smarta elnätet bygger på nya upptäckter som möjliggör en revolution av elnätet.Det smarta elnätet är en evolution av de existerande el- och kommunikationsnäten.Fråga 3. Fördelarna med det smarta elnätet anses vara många. Vilka anser du varaviktigast?Rangordna fördelarna nedan i förhållande till varandra! 1 är viktigast, 5 är minst viktig. Använd varjesiffra endast en gång.Ger en säkrareelförsörjningMöjliggör enelektrifiering avfordonssektornFörbättrarenergikvalitetenGör elanvändningenmer effektivMöjliggör utbyggnad avförnyelsebaraenergikällor1 2 3 4 5106
Oskar Karlsson, Petter PolsonMaster <strong>Thesis</strong> 2011 at Chalmers University of TechnologySmarta ElnätFråga 4. Vilka tror du är de främsta flaskhalsarna vid utbyggnad av ett smart elnät?Rangordna alternativen nedan i förhållande till varandra. 1 är främsta flaskhalsen och 5 är den minstviktiga. Använd varje siffra endast en gång.Nyamarknadslösningarmåste komma fram föratt investeringarna skata fartTekniken ochprodukterna sombehövs behöverutvecklas/förbättrasDet saknas politiskastyrmedel för attreglera utbyggnadenPrivatkonsumentersaknar vilja att påverkasin elanvändningStandarder behövertas fram för att dennya tekniken ska fågenomslag1 2 3 4 5Fråga 5. Vad skulle du helst lära dig mer om inom smarta elnät?Välj ett eller flera alternativ!Nya marknadsförutsättningarAffärsmöjligheter och hur man kan tjäna pengarNy kommunikationsteknikNya produkterTidsram för utvecklingenHur elbilar kan passa in i ett smart elnätVilka aktörer som finns idag och vilka nya som kan tillkommaSpecifika fallstudier/exempel på vad som händer på områdetÖvrigt:Fråga 6. Vilka effekter tror du att utbyggnaden av ett smart elnät kommer ha på dinbranch?107
Conceptual <strong>Design</strong> of Temporary Exhibition Platform and Smart Grid Exhibitionfor Siemens Urban Sustainability CentreAppendix XI - BOCI AnalysisBENEFITSAllowingintegration ofrenewable energyProvide reliableenergy supplyMore efficientuse of energyEnable electricvehicleinfrastructureConsumerparticipationSelf sufficientmicro gridsConsumerinformationstoredVirtualPower plantsGlobal supergridISSUESOPPORTUNITIESICT securityimprovementsCHALLENGESStandardsneededStorage ofenergy108
Oskar Karlsson, Petter PolsonMaster <strong>Thesis</strong> 2011 at Chalmers University of TechnologyAppendix XII - Kr-MatricesKR-matrixTemporary exhibitionxTechnology &constructionConVisitor impact Usability ContexttentReliable operationFeasable designAllow mobilityFascilitate maintenaceBe percieved as innovativeInform about SGPresent Siemens SolutionsTell storyProvide interactionInduce discussionsElicit emotionsFascilitate content flexibilityIntuitive understanding for first time usersDeepend functionalities for experienced usersRelate information content to contextAestheticalappearanceCommunication &LearningRelate design to contextAllow flexible placementExpress Siemens core valuesExpress innovation/futurismFit into Siemens fascilitiesCatch attentionMaintain attentionEngage visitorAdapt contentMax score: 23Score y Score x Total Score WeightingyReliable operation 0 0 9 9 3Technology &constructionFeasable design y 0 1 13 14 3Allow mobility y x 0 1 10 11 3Fascilitate maintenace x x x 0 0 1 1 1Be percieved as innovative y y y y 0 4 13 17 4Inform about SG y y y y y 0 5 17 22 5Visitor impactPresent Siemens Solutions y y y y y x 0 5 16 21 5Tell story y y y y y x x 0 5 14 19 4Provide interaction y y y y x x x x 0 4 8 12 3Induce discussions y y y y y x x y y 0 7 12 19 4Elicit emotions y y y y y y y y y y 0 10 13 23 5ContentFascilitate content flexibility y x y y x x x x y x x 0 4 9 13 3UsabilityContextAestheticalappearanceCommunication& LearningIntuitive understanding for first time users y x y y x x x x y x x y 0 5 9 14 3Deepend functionalities for experienced users x x x y x x x x x x x x x 0 1 1 2 1Relate information content to context y x x y x x x x y x x x x y 0 4 5 9 3Relate design to context x x x y x x x x x x x x x y x 0 2 1 3 2Allow flexible placement x x x y x x x x x x x x x y x y 0 3 2 5 2Express Siemens core values x x x y x x x x x x x x x y x y x 0 3 1 4 2Express innovation/futurism x x x y x x x x x x x x x x x y y y 0 4 2 6 2Fit into Siemens fascilities x x x x x x x x x x x x x y x x y x x 0 2 0 2 1Catch attention x x x y x x x x x x x x x y y y y y y y 0 8 1 9 3Maintain attention y y y y x x x x y x x y y y y y y y y y y 0 15 1 16 4Engage visitor y y y y y x x x y y x y y y y y y y y y y y 0 18 1 19 4Adapt content x x x y x x x x x x x x x y y y x y x y x x x 0 6 0 6 2Score x 9 13 10 1 13 17 16 14 8 12 13 9 9 1 5 1 2 1 2 0 1 1 1 0KR-matrixOutdoor exhibitAttentionContextAttenContexttion Max score: 3Evoke interestWithstand weatherWithstand vandalismRelate to contextMaxweight: 2Score y Score x Total Score WeightingEvoke interest00 3 3 3Withstand weatherx 00 1 1 2Withstand vandalism x x 00 0 0 1Relate to contextx y y 02 0 2 2Score x 3 1 0 0109
Conceptual <strong>Design</strong> of Temporary Exhibition Platform and Smart Grid Exhibitionfor Siemens Urban Sustainability CentreAppendix XIII - List of requirementsList of requirementsTemporary exhibitionFunction denomination Notes/Limits WeightingTechnology & construction Reliable operation Robust and simple technology and3constructionFeasable designRealisable with modern technology,3cost comparable with similar fairinstallations.Allow mobilityFew loose parts, few connections,3fascillitate assembly/disassembly,allow transportation.Fascilitate maintenace 1Be percieved as innovative By stakeholders and visitors. 4Visitor impact Inform about SG See EDS 5Present Siemens SolutionsAs THE partner and provider of5products, solutions and services for theSG development. Siemens is an honest,trustworthy and practical company.They don't make promises they cannotkeep.Tell storyNot only presenting data.4Dramaturgical finesse needed.Provide interaction To engage and enhance learning. 3Induce discussionsThat ultimately lead to actions and4decisionsElicit emotions According to Emotional profile. 5Content Fascilitate content flexibility Content will change often and needs to 3be updated.UsabilityIntuitive understanding for first time Target group: Industry & Authority 3usersDeepend functionalities forSiemens employees 1experienced usersContext Relate information content to context Relate to the permanent exhibition3when placed in the USC and functionindependently when placed in othercontexts.Relate design to contextUSC: part of bigger concept;2conferences, performances etc.Allow flexible placementIn conference rooms, office spaces and 2similar.Aesthetical appearance Express Siemens core values Employees, Excellence, Innovation,2Efficiency.Express innovation/futurism 2Fit into Siemens fascilitiesThe USC, other Siemens offices,conference fascilities, trade shows etc.1Communication & Learning Catch attention Eg. Attractor 3Maintain attention 4Engage visitor 4Adapt content To target group 2110
Oskar Karlsson, Petter PolsonMaster <strong>Thesis</strong> 2011 at Chalmers University of TechnologyList of requirementsOutdoor exhibitFunction denomination Notes/Limits WeightingAttention Evoke interest Arround the USC and/or Smart Grid.Target audience: Broad Public.People walking by and/ordriving by and/orflying over.3Context Withstand weather 2Withstand vandalism 1Relate to contextBuilding, garden and other outdoorelements.2111
Conceptual <strong>Design</strong> of Temporary Exhibition Platform and Smart Grid Exhibitionfor Siemens Urban Sustainability CentreAppendix XIV - Stakeholder overviewProject ownersDeep-dive, customer specific exhibitionTargeting industry, authority (and publicto some extent).Innovative, futuristic exhibition.Global perspective.Fresh input, not siemens view.Encourage discussion.Exhibition should be mobile.Outdoor exhibit should be vandal proof.Siemens OfficeNottinghamPresent and create interest in Siemens products.Send different messages to different actors.“There should be SIEMENS all over the place inthe corporate crystal”.“We don’t want people to wait for smart grid”.“Land owners are key decision makers”.Target housing associations.Siemens OfficeErlangenSiemens is not a good provider, it’s THE SmartGrid company!We’re not aiming at a fossil free future, butmore renewable.Present only the challenges Siemens can solve.Use Siemens core values and express that it’s a“German realistic company”. “The future startstoday”.No Smart Grid is the same. It depends on thesituation and location.ArchitectExhibition must fit into the USCcontext aesthetically.Flexible location depending onthe scope of the exhibits.Spacious location, possiblyconference rooms or offices.EVENTSTAKE HOLDERREQUIREMENTS“80% public visitors, 10-20% schoolsand higher education and 1-2%Siemens customers”.Exhibits should have two layers oflevels.Event has ideas for the outdoor as well.The TE must relate to the PE regardingstyle and content.SiemensSwedenLook into the possibilityof incorporatingSwedish case studies.Siemens OfficeNürnbergPresent Siemens view on Smart Grid. “We’renot a religion”.Smart Grid development has already started.Focus on the areas that are not covered in thePE; actors, markets and product solutions.TE needs to be flexibel and easy to update.Avoid mentioning specific countries.Show regional strategies rather than timestrategies.SiemensTech. AkademieDecreasing our carbon footprint is themain driver for a Smart Grid.Siemens should be presented as THEgreen company!Focus on cities and urban contexts.ChalmersUniversityNew, fresh ideas are needed.People in the business tend tothink too conventional.Exhibition needs to incorporateinteractive objects.112
Oskar Karlsson, Petter PolsonMaster <strong>Thesis</strong> 2011 at Chalmers University of TechnologyAppendix XV - Image board113
Conceptual <strong>Design</strong> of Temporary Exhibition Platform and Smart Grid Exhibitionfor Siemens Urban Sustainability CentreAppendix XVI - Persona114
Oskar Karlsson, Petter PolsonMaster <strong>Thesis</strong> 2011 at Chalmers University of TechnologyAppendix XVII - Brainstorming workshop results2011-05-2410:00-12:30Participants: 8 students from industrial design engineering and engineering physics.ResultsThe workshop was divided into four brainstorming sessions concerning the exhibition, how to communicate the topic of smart grid,how to use gaming as a method for learning and what to do with the outdoor space.Session 1 – General exhibition ideas• Use labyrinths to force meetings.• Encourage a certain moving direction.• Give more questions instead of clear answers to a question.• Make it possible for one visitor to impact on other visitors or parts of the exhibition when interacting at one spot.• Include installations or experiments that demand cooperation between different visitors.• Encourage visitors to teach others.• Make it possible to ”login” as yourself or as somebody else to get a feeling of what roles there are.• Use “rich emotions”, thing you do that you don’t like but gives a richer experience, e.g. fascination over car accidents.• Surprise the visitors without humiliate them.• Induce hope and engagement instead of bad conscience.• Use competitions and challenges.• Use as little text as possible but still be informative.• Make the visitors feel like children, use playfulness, but without making it childish.• Build several floors and create rooms that the visitors can enter. Relate to the story that is told.• Let the visitor decide over the future vision and create scenarios from decisions he/she makes along the way in the exhibition.• An exhibition can either be like a one-way street where the visitors are led in a certain direction or it can be open for visitorsto walk freely and “mingle”.• Use personal stories, the anecdotes are remembered afterwards.• It can be nicer to hearing information than to read.• Create a lounge area on a higher level to get an overview of the exhibition.• The exhibition should be easy to understand and engage with.ooIndividually adapted, you should not have to understand the technology to be interested.Clear overview over the exhibition or being guided through the exhibition.115
Conceptual <strong>Design</strong> of Temporary Exhibition Platform and Smart Grid Exhibitionfor Siemens Urban Sustainability CentreooooClear examples of actual products presented in an interesting way.Use audio.Use physical models to encourage playfulness but keep it on a serious level.Give the user possibility to affect the content.• Read QR-code to gain deeper knowledge. iPhone app?• Show calculations that show your own city’s possible energy savings etc.• Address the person and not only the worker to make him/her feel involved.• Create stories and scenarios for the world where you can guess how the story continues.• Create your own future city. Get print outs that you can bring back to your company.• Use different height levels for different installations to promote and group certain things.• Create the right experience by using lights that matches the message (Götatunneln).• Present all parts of a system in the same way to make them comparable.• Make the whole exhibition self sustained and transparent to show the technology.• Not too much selective information at one time.Session 2 – Visualizing smart grid• Use the body and blood circulation as an analogy for the smart grid.• Show the smart grid on different levels; world, country, city, household to make it easier to relate to this complex topic.• Let the visitor create a grid in a city on a large screen by using physical models of components e.g. houses, wind power plants,and electric cars.• Place a big city in the middle of the exhibition and give the message that smart grid is the core of the city. Let visitors gatheraround the city and participate in adapting it to future needs.• Use lights in the floor that turns on when someone walks on them, like the “sustainable dance floor”.• Let the visitors contribute to the electricity generation needed in the exhibition.• Have a large board/screen that shows all energy flows in a city, e.g. London. Let the visitors include new parameters/solutionsand see how the flows are changing.• Follow an electron’s way in the grid.• Visualize why smart grid is needed to enable more renewable power generation and also why it is good for me as a person.• Make it clear what the benefits are with certain investments.• Give scenarios, what happens if we don’t do the necessary investments?• Use Google earth so that the visitor can use his/her own city when building a virtual smart grid. One result can then be compared to other cities.116
Oskar Karlsson, Petter PolsonMaster <strong>Thesis</strong> 2011 at Chalmers University of Technology• Visualise the smart grid by connecting the wind, water, and solar panel parts etc. with a pulsating grid under a glass floor.• Let the visitors act as the electricity! When they reach an installation it lights up as if supplied with energy.• Smart grid on the floor: Follow it to different stations and learn about different aspects. Follow the electrons journey.• Keep a tracker on each visitor so that the exhibition senses that someone is near. This device can also provide deeper information about theinstallation.• Use real technology to power the exhibition. With transparency so that you see what powers what.• Create miniature of a city by combining a multi touch table with physical objects. Wind farms, batteries, housing etc. Use Google earth asunderlay.• Merlin railway analogy: The target group is appealed by creating miniaturised versions of city systems.• Incorporate workshop where the visitors are encouraged to build their own city. Collaboration.• Ability to see how other parties interacted with the exhibition. “How did Belgium solve this?”• Use physical model of the earth to illustrate the whole system with day and night consequences.Session 3 - Use gaming for learning• Not all people are of the same competitive nature. There can be more than one station that can stimulate different competitive personalities.• It can be an intellectual challenge e.g. a riddle that you cannot stop thinking about.• Have the visitors come up with solutions to smart grid related problems.• The visitor can bring a challenge into the exhibition or having to answer a question/make a decision at each station.• Perhaps a challenge must be solved before the visitor may enter the exhibition.• The visitor could have a personal credit that increases when succeeding at a challenge.• You should not be able to lose a game or finish last.• Make it more of a game than a competition.• The visitor could receive a receipt or price to bring home.• Create a relaxed environment to attract visitors to a game.• Have a mini game at the virtual city. Give the user 5 minutes to build a smart grid as large as possible.• Let companies compete and put the winner’s logo on a price board.• Keep it on the right level. Cannot be perceived as silly.• Have a quiz at every station. Not too hard and completely voluntary.• Present a challenge at every station. You don’t have to do all of them, you can choose the ones you’re interested in. Your results are thensummarised at the end.• A game where you are assigned a certain amount of money to start with and then try to reduce energy consumption and emissions. You then getfeedback on how you did and why things happened like they did and what services, solutions or strategies that may have helped.117
Conceptual <strong>Design</strong> of Temporary Exhibition Platform and Smart Grid Exhibitionfor Siemens Urban Sustainability Centre• The participants need to be able to communicate this to their company when they come back! They receive a give-away to take home that communicatestheir results in the game. A certificate, a trophy, a MIG-game, a video of your game, screenshot?Session 4 – Outdoor space• Make the installation big to attract interest and make it visible from above.• Relate to the green/sustainable theme by using plants, trees etc.• Make it sculptural, something to climb at or walk into.• Create a globe that symbolized the green house effect.• Make an inverted globe that you can enter and see the worlds energy use inside.• Have fewer impressions outside to make it a more relaxing place.• Use “jumping water” to get a feeling of life and action.• A garden that communicates “greenness” and that a smart grid will not reduce life quality.• A “legoland” city with a smart grid in it.• Sculptural installation with different levels to walk up into. You are directed to different viewpoints that look out over London’s different“sustainable sights”.• Something (model of the earth) where you can see the different in energy usage in the western world compared to the rest.• Show a challenge/task/question. Solution inside.• Create something spectacular that you can see from the air (airplane). E.g. huge pond with islands in the shape of a world map. At night LED lightswill show how the population is spread over the world and how the cities can be connected with a smart grid.• Create a harmonic place to go out into and reflect on the content inside. Nice to come out for a break.118
Oskar Karlsson, Petter PolsonMaster <strong>Thesis</strong> 2011 at Chalmers University of TechnologyAppendix XVIII - PUGH-MatricesPUGH-MatrixTemporary exhibition conceptsReferenceConcept 1, Circle Concept 2, Tunnel Concept 3, MingleSiemens exibitionFunction denominationWeightingCIRED Score Weighted score Score Weighted score Score Weighted scoreReliable operation 3 0 - -3 - -3 - -3Feasable design 3 0 - -3 - -3 - -3Allow mobility 3 0 0 0 - -3 0 0Fascilitate maintenace 1 0 - -1 - -1 - -1Be percieved as innovative 4 0 + 4 + 4 + 4Inform about SG 5 0 + 5 + 5 + 5Present Siemens Solutions 5 0 + 5 + 5 + 5Tell story 4 0 + 4 + 4 + 4Provide interaction 3 0 + 3 + 3 + 3Induce discussions 4 0 + 4 + 4 + 4Elicit emotions 5 0 + 5 + 5 + 5Fascilitate content flexibility 3 0 + 3 + 3 + 3Intuitive understanding for first time users 3 0 0 0 0 0 0 0Deepend functionalities for experienced users 1 0 - -1 - -1 0 0Relate information content to context 3 0 0 0 0 0 0 0Relate design to context 2 0 0 0 0 0 0 0Allow flexible placement 2 0 - -2 - -2 0 0Express Siemens core values 2 0 + 2 + 2 + 2Express innovation/futurism 2 0 + 2 + 2 + 2Fit into Siemens fascilities 1 0 - -1 - -1 - -1Catch attention 3 0 + 3 + 3 + 3Maintain attention 4 0 + 4 + 4 + 4Engage visitor 4 0 + 4 + 4 + 4Adapt content 2 0 + 2 + 2 + 2Total score: 38 Total score: 35 Total score: 41PUGH-MatrixTemporary exhibition conceptsConcept 1: 5 Concept 2: 14 Concept 3: -19Concept 1 vs Concept 2 Concept 2 vs Concept 3 Concept 3 vs Concept 1Function denomination Weighting Score Weighted score Score Weighted score Score Weighted scoreReliable operation 3 + 3 0 0 - -3Feasable design 3 0 0 - -3 + 3Allow mobility 3 0 0 - -3 + 3Fascilitate maintenace 1 0 0 - -1 0 0Be percieved as innovative 4 - -4 + 4 - -4Inform about SG 5 0 0 0 0 0 0Present Siemens Solutions 5 0 0 0 0 0 0Tell story 4 - -4 + 4 - -4Provide interaction 3 - -3 0 0 0 0Induce discussions 4 0 0 + 4 - -4Elicit emotions 5 0 0 + 5 - -5Fascilitate content flexibility 3 + 3 - -3 + 3Intuitive understanding for first time users 3 + 3 - -3 0 0Deepend functionalities for experienced users 1 0 0 0 0 0 0Relate information content to context 3 0 0 0 0 0 0Relate design to context 2 0 0 0 0 0 0Allow flexible placement 2 + 2 - -2 + 2Express Siemens core values 2 0 0 0 0 0 0Express innovation/futurism 2 0 0 + 2 - -2Fit into Siemens fascilities 1 0 0 0 0 0 0Catch attention 3 + 3 + 3 - -3Maintain attention 4 - -4 + 4 - -4Engage visitor 4 - -4 0 0 + 4Adapt content 2 0 0 - -2 + 2Total score: -6 Total score: 8 Total score: -11119
Conceptual <strong>Design</strong> of Temporary Exhibition Platform and Smart Grid Exhibitionfor Siemens Urban Sustainability CentreAppendix XIX - Concept surveyCONCept SUrveytempOrary exhibitiON ON Smart Grid &OUtdOOr exhibit fOr the USCOskar Karlsson & petter polson2011-07-11yOUr Name:Concept Survey, 2011-07-11p.1/8120
Oskar Karlsson, Petter PolsonMaster <strong>Thesis</strong> 2011 at Chalmers University of TechnologyGeNeral CONCeptSCONCept 0.1• Use modules and projectors for flexibility.• enable mobility for the entire exhibition.• maintain flexibility in content and make it easy toupdate.CONCept 0.2• include a lounge area at the end of the exhibition.• visitors can sit down, have a drink and discuss solutionsand/or cases in a relaxed atmosphere.• emphasizes that Siemens take care of their customersand is a safe and reliable collaboration partner inthe Smart Grid field.Write yOUr COmmeNtS here:Concept Survey, 2011-07-11p.2/8121
Conceptual <strong>Design</strong> of Temporary Exhibition Platform and Smart Grid Exhibitionfor Siemens Urban Sustainability CentreGeNeral CONCeptSCONCept 0.3 - Smart-paSS• Check-in counter where visitors are registered.• visitor information is stored to a Siemens account and linked to a Smart-pass.• information e.g. product descriptions and case studies etc. is stored in the Siemens account and can be accessed via theweb after the visit.• through face recognition technology a visitor’s picture can be linked to his/her Smart-pass and Siemens account.CONCept 0.4 - the path tO the Smart Grid• maze on the wall by the staircase as a metaphor for the differentchallenges in finding the right path towards the smart grid.• every project is different but Siemens offers consultation and tailormade solutions for customers all over the world.• Siemens enlightens the path when climbing the stairs towards thesmart grid solutions.Write yOUr COmmeNtS here:122Concept Survey, 2011-07-11p.3/8
Oskar Karlsson, Petter PolsonMaster <strong>Thesis</strong> 2011 at Chalmers University of TechnologyStrUCtUreCONCept 0.5• two story, round structure with lounge on 2nd floor.• room underneath the lounge and hidden room for storage under the staircase.CONCept 0.6• two story, square structure with lounge on 2nd floor.• tunnel at entrance that leads to a room underneath thelounge.CONCept 0.7• One story construction with three levels.• module based exhibition on the two first levels andlounge on third level.WhiCh CONCept dO yOU prefer? Write yOUr COmmeNtS here:Concept Survey, 2011-07-11p.4/8123
Conceptual <strong>Design</strong> of Temporary Exhibition Platform and Smart Grid Exhibitionfor Siemens Urban Sustainability CentreStatiON 1 - Smart Grid iNtrOdUCtiONCONCept 1.1• Guide presentingbackground information.• Shows that thedrivers for a smartgrid are many.CONCept 1.2• back projecteddome modulesshowing backgroundmovie.CONCept 1.3• interactive modulewith bOCi-analysis.CONCept 1.5• timeline on tunnelwalls giving historicalbackground.• putting Siemensamong famousscientists.CONCept 1.6• digital kitchenmagnets for userto write their definitionof a smartgrid.• Sentences areprojected on wallsand ceiling.CONCept 1.7• interactive modulewhere the user canestimate numbersand create futurescenario.CONCept 1.4• movie showingfuturistic vision ofworld connectedwith super grids.WhiCh CONCeptS dO yOU prefer? Write yOUr COmmeNtS here:124Concept Survey, 2011-07-11p.5/8
Oskar Karlsson, Petter PolsonMaster <strong>Thesis</strong> 2011 at Chalmers University of TechnologyStatiON 2 - aCtOrS aNd marKetSCONCept 2.1 - Smart Grid SimUlatiON Gamepurpose• induce learning by giving a real time experience.• Gain a deeper understanding how smart grid worksand what challenges there are.• meeting platform for different actors to discuss smartgrid matters.• raise important questions.Game design• four players participate at the same time, playing witheach other.• Screen showing status for the sectors, electricity balanceand monetary assets.• players interact by putting physical models on screenwith object recognition.Game idea• Create and maintain balance between supply anddemand.• earn as much money as possible by supplying electricityas efficient as possible.• Work together to build the smart grid.Game flow• movie gives the background situation and challenge.• moderator introduces rules for simulation.• Chaos-based flow with possible breaks where moderatorinduces discussions.CONCept 2.2 - iNteraCtive mOtiON deteCtiON SCreeN• interactive module showing new and old market opportunitiesas bubbles around a silhouette of the user.• possibility to compare with other businesses andusers.Write yOUr COmmeNtS here:Concept Survey, 2011-07-11p.6/8125
Conceptual <strong>Design</strong> of Temporary Exhibition Platform and Smart Grid Exhibitionfor Siemens Urban Sustainability CentreStatiON 3 - CaSeS aNd SOlUtiONSCONCept 3.1• World map with dots representing Siemens’spresence.• interactive touch screen with moreinformationabout each case.• make use of Siemens virtual city software forproduct presentation.• Siemens personnel presenting around alarge touch screen table.CONCept 3.2• posters showing Siemens cases in colourcoded categories.• Case cards to pick up at each case poster touse and bring home.• Object recognition tables to place case cardson and get case and product information.• interesting information can be stored on theexhibition account and accessed from home.CONCept 3.3• interactive modules with cases and productsrepresented by icons.• icons can be categorized in different ways forintuitive information access.• possibility to store information on exhibitionaccount by swiping the icon to the Smartpasssymbol.WhiCh CONCept dO yOU prefer? Write yOUr COmmeNtS here:126Concept Survey, 2011-07-11p.7/8
Oskar Karlsson, Petter PolsonMaster <strong>Thesis</strong> 2011 at Chalmers University of TechnologyOUtdOOr CONCeptSCONCept 4.1 – iNverted GlObe• Grass covered half sphere above ground, halfsphere below.• visitors go inside the sphere in small groups to aplatform in the centre.• earth projected on the inside wall to illustrate sustainabilityissues.-earth by night – electricity use worldwide.-Countries size proportional to resource use.-World energy supply from the desert areas.CONCept 4.2 – aUGmeNted reality• for smart phone users or by having special gogglesin place.• put virtual objects in a real environment.• Show pictures of visionary sustainable future.CONCept 4.3 –reNeWable eleCtriCity• Use water area for wind, wave and solar powerproduction.• Generate electricity to supply e.g. a plasma ballonshore.• attract attention to the fluctuation of renewableenergy.CONCept 4.4 – the eGG• large oval shaped installation with inner and outersurface.• download an app for your smart phone and answertoday’s question.• See your face and answer floating around on theinner surface.WhiCh CONCept dO yOU prefer? Write yOUr COmmeNtS here:Concept Survey, 2011-07-11p.8/8127
Conceptual <strong>Design</strong> of Temporary Exhibition Platform and Smart Grid Exhibitionfor Siemens Urban Sustainability CentreAppendix XX - Concept survey ResultsName General Concepts General StructureModules & LoungeSmart Pass & MazeWernerKruckowboth concepts are right and important -let's see what we can physicallyimplementa) the smart pass is a given to me as thisis basically the same concept as in themain exhibition hall with the RFID tags.b) I have my doubts about the practicalityof the path to the smart grid as this wilmostly happen in the corporate crystalwhich means we need to have a simpleand cost effective temporary solution orany sophisticated permanent updatablesolution.From a practcal pointof view I wouldeliminate concept 5and 6 and I am stillsceptical about concept7. Let's see ...JoHensherThe flexibility and updatability are veryimportantConcept 0.3 - it may be too much to havea separate check in counter for thisexhibition. I would suggest exploring theoption of linking with the main exhibitioncheck-in as it will also use smartcards/RFID taggingConcept 0.4 - A two-storey exhibitionmay reduce its ability to be placedelsewhere. In addition we would need tocheck that it would comply with the UK'sdisability discrimination actBettinaPeckconcept needs to be flexible to makeupdates easy. Achieved with concept 1.Idea of lounge area also good as it givesus the opportunity to have a conversationwithin a more relaxed atmospheresmart card idea very good. could belinked with the general exhibition idea.concept 0.4. in general interesting butneeds to be checked if we have enoughspace for this.concept 5 or 6 dependson how much space wehave and where.preferred option is 6concept 8 too "busy".AnnetteDiziol, PBConcept 1: Flexible, easy to transport andrelocate. Can be incorporated into almostany roof shape. very suitable for thebuilding.Concept 2: Idea to conclude a visit of thetemporary exhibition at a cafe/loungearea is very good. Use of cafe/ break outspace at level 1 over the shop advisable.Additional cafe/lounge spaces will be costintensive and not easy to incorporate atthis stage.Concept 3: Smart pass. Very appropriatefor a high tech company such as Siemens.Concept 4: Double storey temporaryarrangements are difficult to include intothe building.Unfortunately 2 storeyelements are difficultto incorporate into thebuilding height andspace wise.A level arrangementthat is coordinatedwith teh layout of thespaces in the pavilionwould work best128
Oskar Karlsson, Petter PolsonMaster <strong>Thesis</strong> 2011 at Chalmers University of TechnologyName STATION 1 - SMART GRID INTRODUCTION STATION 2 - Actors and MarketsWernerKruckowI like 1.1, 1.4, 1.6 and 1.7My favourite is 2.1 - cost?JoHensherMost prefer - 1.1, 1.3, 1,4 Prefer 2.1BettinaPeckAnnetteDiziol, PBexcept 1.2. I think all concepts are interesting. It will dependwhat we will exhibit we then should decide which concept toapply.Concept 1.5 / 1.6/1.7 are my favorite.Especially the tunnel with the time line and the kitchenmagnets is powerful, play full and intelligent. It will beremembered by visitors. Further it is an element which is notincluded in the Event exhibition designconcept 2.1. preferred optionConcept 2.1. It may be beneficial to discusswith Event the set and content of their citygame in order to expand the content and notto provide repeat experiences.Name STATION 3 - Cases and Solutions Outoor conceptsWernerKruckow3.1 is attractive to me you convinced me about 4.4 in our call4.1 won't be feasible as we cn't go underground I was told4.2 I don't see a big impact4.3 please investigate further what is feasible as we don't usethe water at all yetJoHensherLike 3.2 and 3.3 as visitor can take home theinformationThere are many things to consider when designing theoutdoor exhibits.- the majority of the land surrounding the building is not theresponsibility of Siemens, but the local authority- security could be a problem. Our cameras will mainly focuson the building and the immediate land outside it. As the restof the land is public land, we cannot prevent members of thepublic from viewing and possibility destroying these in themiddle of the nightBettinaPeckAnnetteDiziol, PBconcept 3.1 and 3.2. are the preferred optionsas they allow good common interaction withthe customerConcept 3.3 is my favouriteThis is why I really like Augmented reality - its reallyinnovative, only a handful of attractions do this in the UK. Alsoit has the ability to be applied not just for the temporaryexhibition but also for the main exhibitionConcept 4.2 is my clear favourite129