Exercise 9.pdf
Exercise 9.pdf
Exercise 9.pdf

You also want an ePaper? Increase the reach of your titles
YUMPU automatically turns print PDFs into web optimized ePapers that Google loves.
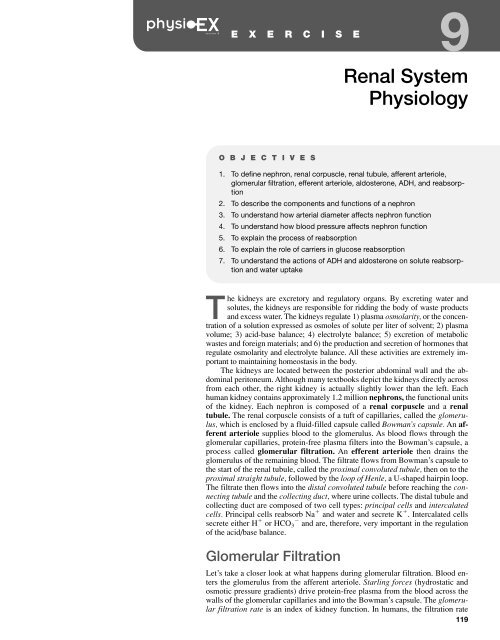
9E X E R C I S ERenal SystemPhysiologyO B J E C T I V E S1. To define nephron, renal corpuscle, renal tubule, afferent arteriole,glomerular filtration, efferent arteriole, aldosterone, ADH, and reabsorption2. To describe the components and functions of a nephron3. To understand how arterial diameter affects nephron function4. To understand how blood pressure affects nephron function5. To explain the process of reabsorption6. To explain the role of carriers in glucose reabsorption7. To understand the actions of ADH and aldosterone on solute reabsorptionand water uptakeThe kidneys are excretory and regulatory organs. By excreting water andsolutes, the kidneys are responsible for ridding the body of waste productsand excess water. The kidneys regulate 1) plasma osmolarity, or the concentrationof a solution expressed as osmoles of solute per liter of solvent; 2) plasmavolume; 3) acid-base balance; 4) electrolyte balance; 5) excretion of metabolicwastes and foreign materials; and 6) the production and secretion of hormones thatregulate osmolarity and electrolyte balance. All these activities are extremely importantto maintaining homeostasis in the body.The kidneys are located between the posterior abdominal wall and the abdominalperitoneum. Although many textbooks depict the kidneys directly acrossfrom each other, the right kidney is actually slightly lower than the left. Eachhuman kidney contains approximately 1.2 million nephrons, the functional unitsof the kidney. Each nephron is composed of a renal corpuscle and a renaltubule. The renal corpuscle consists of a tuft of capillaries, called the glomerulus,which is enclosed by a fluid-filled capsule called Bowman’s capsule. An afferentarteriole supplies blood to the glomerulus. As blood flows through theglomerular capillaries, protein-free plasma filters into the Bowman’s capsule, aprocess called glomerular filtration. An efferent arteriole then drains theglomerulus of the remaining blood. The filtrate flows from Bowman’s capsule tothe start of the renal tubule, called the proximal convoluted tubule, then on to theproximal straight tubule, followed by the loop of Henle, a U-shaped hairpin loop.The filtrate then flows into the distal convoluted tubule before reaching the connectingtubule and the collecting duct, where urine collects. The distal tubule andcollecting duct are composed of two cell types: principal cells and intercalatedcells. Principal cells reabsorb Na and water and secrete K . Intercalated cellssecrete either H or HCO 3 and are, therefore, very important in the regulationof the acid/base balance.Glomerular FiltrationLet’s take a closer look at what happens during glomerular filtration. Blood entersthe glomerulus from the afferent arteriole. Starling forces (hydrostatic andosmotic pressure gradients) drive protein-free plasma from the blood across thewalls of the glomerular capillaries and into the Bowman’s capsule. The glomerularfiltration rate is an index of kidney function. In humans, the filtration rate119
Renal System Physiology 121by clicking the () and () buttons next to the respectivetubes. You may also adjust the blood pressure of the sourcebeaker by clicking the () and () buttons next to the “Pressure(mmHg)” display.Once you have identified all the equipment on screen,click Help again and select Balloons On/Off (you cannotproceed with the experiment unless the labels are turned off).At the bottom left of the screen are two beakers. The leftbeaker, which we call the “source beaker,” represents theblood supply being delivered to the nephron. When the Startbutton is clicked, blood will flow from the source beaker tothe afferent arteriole and then to the group of small tubes representingthe glomerulus. As blood flows through theglomerulus, you will see ultrafiltration occur. (Ultrafiltrationmeans filtration from the plasma of everything except proteinsand cells.) Blood will then be drained from the glomerulusto the “drain beaker” next to the source beaker. At the endof the nephron tube, you will see the formation of urine in asmall beaker at the lower right of the screen. To watch a testrun of this process in action, click the Start button. At the endof the run, click Refill underneath the drain beaker beforeyou begin the activities that follow.ACTIVITY 1Effect of Arteriole Diameter onGlomerular FiltrationIn this activity you will investigate how the diameters of theafferent and efferent arterioles leading to and from theglomerulus can affect the glomerular filtration rate.1. The afferent radius display should be set at 0.50 mm, andthe efferent radius at 0.45 mm. If not, use the () or () buttonsnext to the afferent and efferent radius displays to adjustaccordingly.2. Be sure the left beaker is full. If not, click the Refillbutton.3. The pressure gauge above the left beaker should read90 mm Hg. If not, click the () or () buttons next to thepressure display to adjust accordingly.4. Click the Start button. As the blood flows through thenephron, watch the displays for glomerular pressure andglomerular filtration rate at the top right of the screen, as wellas the display for urine volume at the bottom right of thescreen.5. After the drain beaker has stopped filling with blood,click Record Data. This will be your baseline data for thisactivity.6. Click the Refill button.7. Increase the afferent radius by 0.05 mm and repeat steps3–6, making sure to click Record Data at the end of eachrun. Keep all the other variables at their original settings.Continue repeating the activity until you have reached themaximum afferent radius of 0.60 mm.Compare this data with your baseline data. How did increasingthe afferent arteriole radius affect glomerular filtration rate?________________________________________________8. Reduce the afferent arteriole radius to 0.30 mm, andclick Start.Under these conditions, does the fluid flow through thenephron?________________________________________________What is the glomerular filtration rate?How does it compare to your baseline data, and why?________________________________________________________________________________________________9. Using the simulation, design and carry out an experimentfor testing the effects of increasing or decreasing theefferent radius.How did increasing the efferent radius affect glomerularfiltration rate?________________________________________________________________________________________________How did decreasing the efferent radius affect glomerularfiltration rate?________________________________________________________________________________________________Physiologically, what could be the cause of a change in afferentor efferent arteriole radius?______________________________________________________________________________________________■ACTIVITY 2Effect of Pressure onGlomerular FiltrationNext you will investigate the effect of blood pressure onglomerular filtration rate.1. Under the Data Sets display, highlight Pressure. Thiswill allow you to save data in a new data set window. You canalways retrieve your data from the previous activity by highlightingthe Afferent data set.2. Make sure that the source beaker is filled with blood, andthat the drain beaker is empty. If not, click Refill.3. Adjust the pressure gauge (on top of the source beaker)to 70 mm Hg. Set the afferent radius at 0.50 mm and theefferent radius at 0.45 mm.4. Click the Start button. Watch the Glomerular Pressureand Glomerular Filtration Rate displays at the top right of thescreen.
122 <strong>Exercise</strong> 95. When the run has finished, click the Record Data button.This is your baseline data.6. Increase the pressure by 5 mm Hg and repeat the experiment.Continue increasing the pressure by 5 mm and repeatingthe experiment until you have reached the maximumpressure of 100 mm Hg. Be sure to click Record Data andRefill after each experimental run.As pressure increased, what happened to the pressure in theglomerulus?________________________________________________What happened to the glomerular filtration rate?________________________________________________Compare the urine volume in your baseline data with theurine volume as you increased the pressure.How did the urine volume change?________________________________________________How could increased urine volume be viewed as being beneficialto the body?______________________________________________________________________________________________■ACTIVITY 3Combined EffectsIn the first activity you looked at arteriole diameter and itsrole in glomerular filtration. Next you examined the effect ofpressure on glomerular filtration. In the human body, both ofthese effects are occurring simultaneously. In this activityyou will investigate the combined effects of arteriole diameterand pressure changes on glomerular filtration.1. Under the Data Sets window, highlight Combined. Thiswill allow you to save data in a new data set window. You canalways retrieve your data from previous activities by highlightingthe Afferent data set or the Pressure data set.2. Set the pressure at 90 mm Hg, the afferent arteriole at0.50 mm, and the efferent arteriole at 0.45 mm.3. Click the Start button and allow the run to complete.Then click Record Data. This is your baseline data.4. Click Refill.5. Lower the pressure to 80 mm Hg. Leave afferent arterioleat 0.50 and efferent arteriole at 0.45 mm.6. Click the Start button and allow the run to complete.Then click Record Data.7. Click Refill.What happened to the glomerular filtration rate and urine volumeafter you reduced the pressure?________________________________________________________________________________________________How could you adjust the afferent or efferent radius to compensatefor the effect of the reduced pressure on glomerularfiltration rate and urine volume? Use the simulation to determineyour answer.________________________________________________________________________________________________8. Next, click the square valve button (currently reading“valve open”) above the collecting duct. The valve shouldnow read “valve closed.”9. Click Start. At the end of the run, click Record Data.What changes are seen in nephron function when the valveis closed?________________________________________________________________________________________________Why were these changes seen?________________________________________________________________________________________________________________________________________________________________________________________________Is the kidney functional when the glomerular filtration rate iszero? Explain your answer.________________________________________________________________________________________________What is the major “ingredient” that needs to be removed fromthe blood?________________________________________________Studies on aging have demonstrated that some nephrons mayfail as we get older. Will this be a problem regarding urineformation?________________________________________________________________________________________________If blood pressure went down—for example, as the result ofblood loss—what changes would the kidney need to make tomaintain its normal filtration rate?________________________________________________________________________________________________10. Click Tools → Print Data to print your data.■
Renal System Physiology 123FIGURE 9.2Urine Formation. (a) Opening screen of the Simulating Urine Formation experiment. Part (b) follows.Simulating Urine FormationReabsorption is the movement of filtered solutes and waterfrom the lumen of the renal tubules back into the plasma.Without reabsorption, we would excrete the solutes and waterthat our bodies need. In the next activity you will examinethe process of passive reabsorption that occurs while filtratetravels through a nephron and urine is formed.Click Experiment at the top of the screen and selectSimulating Urine Formation. You will see the screenshown in Figure 9.2. The light yellow space surrounding thedark yellow nephron represents interstitial space between thenephron and peritubular capillaries that branch out from theefferent arteriole. The movement of solutes and water fromthe renal tubules to the interstitial space is dependent on theconcentration gradient—that is, the difference between theconcentration of solutes in the tubules and the concentrationof solutes in the interstitial space. Notice the display forConc. Grad. (mosm) near the bottom of the screen. By clickingthe () and () buttons next to this display and thenclicking Dispense, you can adjust the solute concentration ofthe interstitial space. When you click Start, filtrate will beginflowing through the nephron, and solute and water will movefrom the tubules to the interstitial space to the peritubularcapillaries, completing the process of reabsorption. Note thatthe capillaries are not shown on screen.Note also the two dropper bottles at the right side of thescreen, which contain the hormones aldosterone and ADH(antidiuretic hormone). For the first activity you will be dealingwith ADH only, which increases the water permeabilityof the distal convoluted tube and the collecting duct of thenephron (Figure 9.2b and c). Near the bottom left of thescreen you will notice a Probe. When the probe turns red,you can click and drag it over various parts of the nephronand over the beaker to measure the solute concentration present.Finally, notice the equipment at the very top of the screenfor adding glucose carriers. We will explain this equipment inActivity 5, when you will be studying the reabsorption of glucose.
124 <strong>Exercise</strong> 9Descending limbof loop of Henle100Collecting duct300Descending limbof loop of HenleCollecting duct100 150H 2 O300DCT100DCT300H 2 OCortexH 2 OOutermedullaH 2 O300NaCINaCI600NaCI100400900 700UreaUrea100300600900Osmolality of interstitial fluid (mOsm)CortexH 2 OOutermedullaH 2 O300600NaCINaCI100400NaCI900 700H 2 OH 2 OH 2 OUreaH 2 OUrea300400600900300600900Osmolality of interstitial fluid (mOsm)Innermedulla12001001200Innermedulla1200H 2 O12001200(b) Absence of ADH(c) Presence of ADHKey:Active transportPassive transportFIGURE 9.2 (continued) Urine Formation (b) Mechanisms for forming dilute urine (c) andconcentrated urine.ACTIVITY 4Effect of Solute Gradient onUrine Concentration1. Make sure Gradient is highlighted within the Data Setswindow.2. Click and drag the dropper top from the bottle of ADHand release it on top of the gray cap directly above the rightside of the nephron. The cap will open, and ADH will bedropped onto the collecting duct. The cap will then close.3. The Conc. Grad. (mosm) window should read 300. Ifnot, adjust the () or () buttons accordingly.4. Click Dispense to apply the 300 mosm concentration tothe interstitial fluid. It is important to note that this is also thetypical value of solute concentration in the blood.5. Click Start and allow the blood to flow through the system.Watch the Probe at the bottom left of the screen. Whenit turns red, click and drag it over to the urine collectingbeaker to measure the urine solute concentration. The valuewill appear in the Concentration window next to the probe’soriginal location.6. At the end of the run, click Record Data.7. Increase the concentration gradient by 300 mosm (i.e.,set it at 600 mosm) and repeat the experiment. Remember toadd ADH to the collecting duct before clicking Start. Continueincreasing the gradient by 300 mosm and repeating theexperiment until you reach 1200 mosm, the normal value forinterstitial solute concentration in the kidney. Be sure to clickRecord Data after each run.How did the urine solute concentration change as the concentrationgradient of the interstitial fluid increased?________________________________________________________________________________________________
Renal System Physiology 125What happened to the urine volume as the concentrationgradient increased? Why?________________________________________________________________________________________________________________________________________________By increasing the concentration gradient, what are you doingto the urine that is formed?________________________________________________________________________________________________Predict what would happen to urine volume if you did notadd ADH to the collecting duct.______________________________________________________________________________________________■What happens to the glucose concentration as you addglucose carriers to the system?________________________________________________________________________________________________At what point does the glucose concentration in the urine becomezero?________________________________________________A person with type I diabetes cannot make insulin, and a personwith type II diabetes does not respond to insulin that ismade. In either case, the diabetic person is unable to absorbglucose into the body. What would you expect to find in theurine of a diabetic person? Why?______________________________________________________________________________________________■ACTIVITY 5Reabsorption of GlucoseGlucose is not very large, and as such it is easily filtered outof the plasma into Bowman’s capsule as part of the filtrate. Toensure that glucose is reabsorbed into the body so that it canform the starting material of metabolism, glucose carriers arepresent in the nephron. There is a finite number of carriers percell, so if too much glucose is taken in, not all of it will be reabsorbedinto the body. Glucose is absorbed by secondary activetransport, the “push” of which comes from the gradient createdby the transport of sodium. The carriers that transport thesemolecules across the membrane are proteins embedded in thecell membrane. In this activity you will examine the effect ofglucose carriers on glucose reabsorption.1. Highlight Glucose within the Data Sets window.2. Set the Conc. Grad. (mosm) to 1200 and click Dispense.Recall that 1200 is the normal value for soluteconcentration in the kidney.3. Click Start.4. Click Record Data at the end of the run. This run willserve as a “control” run, with no glucose carriers present.Note that no ADH has been added, either—your focus will beon the absence or presence of glucose carriers.5. At the top of the screen, click the () button until theGlucose Carriers window reads 100. Then click Add Carriers.6. Click Start.7. At the end of the run, click Record Data.8. Continue to increase the number of glucose carriers by100 at a time and repeat the experiment until you havereached the maximum number of carriers, 500. Be sure todispense the concentration gradient before beginning eachrun, and to click Record Data after each run.ACTIVITY 6Effect of Hormones on ReabsorptionBy now you should understand how filtration occurs and howit is controlled. You should understand passive solute movementand the role of glucose carriers on glucose reabsorption.Next you will examine the actions of hormones on thenephron, most of which occur in the collecting duct.Antidiuretic hormone (ADH) is influenced by the osmolality(the concentration of a solution expressed in osmoles ofsolute particles per kilogram of solvent) of body fluids as wellas the volume and pressure of the cardiovascular system. A 1%change in body osmolality will cause this hormone to be secreted.The primary action of this hormone is to increase thepermeability of the distal tubule and the collecting duct to waterso that more water is taken up into the body. ADH binds to receptorsin the principal cells to cause this reaction by openingaquaporins, or water channels in the apical membrane. Withoutwater uptake, the body would quickly dehydrate. The kidneytightly regulates the amount of water excreted under normalconditions to maintain water balance in the body. Waterintake must precisely match water loss from the body. If waterintake is down, or if there has been a fluid loss from thebody, the kidneys work to conserve water by making theurine very hyperosmotic (having a relatively high solute concentration)to the blood. If there has been a large intake offluid, the urine is more hypo-osmotic. In the normal individual,urine osmolarity varies from 50 to 1200 milliosmoles/kgwater. The osmolality of the body must be maintained withinvery narrow limits.Aldosterone is an adrenal cortical hormone under thecontrol of the body’s renin-angiotensin system. A decrease inblood pressure is detected by cells in the afferent arterioleand triggers the release of renin. Renin acts as a proteolyticenzyme, causing angiotensinogen to be converted into angiotensinI. Endothelial cells have an enzyme, called the convertingenzyme, which converts angiotensin I into angiotensinII. Angiotensin II works on the adrenal cortex to
126 <strong>Exercise</strong> 9induce it to secrete aldosterone. Aldosterone acts on the collectingduct of the kidney to promote the uptake of sodiumfrom filtrate into the body and the release of potassium fromthe body. Coupled with the addition of ADH, this electrolyteshift also causes more water to be reabsorbed into the blood,resulting in increased blood pressure.1. Highlight Hormone within the Data Sets window.2. Set the number of Glucose Carriers to zero and clickDispense to ensure that no carriers from the previous activityremain in action.3. Set the Conc. Grad. (mosm) to 1200 and click Dispense.4. Click Start. At the end of the run, click Record Data.This is your “control” run and baseline data.Baseline Urine Volume ______________5. Click and drag the dropper top from the bottle of aldosteroneand release it on top of the gray cap directly above theright side of the nephron. The cap will close, and aldosteronewill be dropped onto the collecting duct.6. Click Start. At the end of the run, click Record Data.Urine volume with aldosterone present ______________7. Click and drag the dropper top from the bottle of ADHand release it on top of the gray cap directly above the rightside of the nephron. The cap will close, and ADH will bedropped onto the collecting duct.8. Click Start. At the end of the run, click Record Data.9. For your fourth run, dispense both ADH and aldosteroneonto the collecting duct. You should see a yellow outline appeararound the collecting duct.10. Click Start. At the end of the run, click Record Data.11. Click Tools → Print Data to print your data.Which hormone has the greater effect on urine volume?Why?________________________________________________________________________________________________How does the addition of aldosterone affect the concentrationof potassium in the urine?________________________________________________________________________________________________How does the addition of ADH affect the concentration ofpotassium in the urine? How does this compare to the effectof adding aldosterone, with respect to potassium concentrationin the urine?________________________________________________________________________________________________How does the addition of both hormones affect 1) urine concentration,2) urine volume, and 3) potassium concentration?________________________________________________________________________________________________If ADH were not used, how would the urine concentrationvary? Explain your answer.______________________________________________________________________________________________■Histology Review SupplementFor a review of renal tissue, go to <strong>Exercise</strong> H: Histology Atlas& Review on the PhysioEx website to print out the RenalTissue Review worksheet.