Student Activity Growth of a Plant - Project Maths
Student Activity Growth of a Plant - Project Maths
Student Activity Growth of a Plant - Project Maths

You also want an ePaper? Increase the reach of your titles
YUMPU automatically turns print PDFs into web optimized ePapers that Google loves.
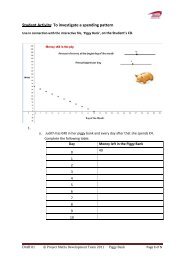
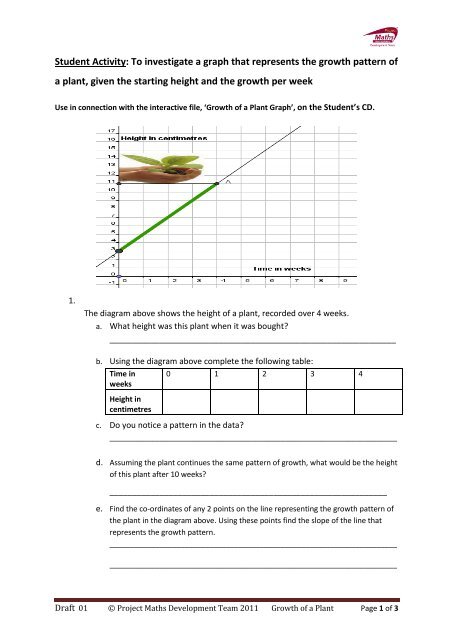
<strong>Student</strong> <strong>Activity</strong>: To investigate a graph that represents the growth pattern <strong>of</strong>a plant, given the starting height and the growth per weekUse in connection with the interactive file, ‘<strong>Growth</strong> <strong>of</strong> a <strong>Plant</strong> Graph’, on the <strong>Student</strong>’s CD.1.The diagram above shows the height <strong>of</strong> a plant, recorded over 4 weeks.a. What height was this plant when it was bought?_______________________________________________________________b. Using the diagram above complete the following table:Time inweeksHeight incentimetres0 1 2 3 4c. Do you notice a pattern in the data?_____________________________________________________________________d. Assuming the plant continues the same pattern <strong>of</strong> growth, what would be the height<strong>of</strong> this plant after 10 weeks?_____________________________________________________________e. Find the co-ordinates <strong>of</strong> any 2 points on the line representing the growth pattern <strong>of</strong>the plant in the diagram above. Using these points find the slope <strong>of</strong> the line thatrepresents the growth pattern.__________________________________________________________________________________________________________________________________________Draft 01 © <strong>Project</strong> <strong>Maths</strong> Development Team 2011 <strong>Growth</strong> <strong>of</strong> a <strong>Plant</strong> Page 1 <strong>of</strong> 3
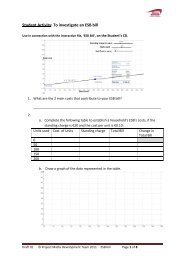
2. Draw a graph to represent a plant that was 4 cm when it was bought and grows 1 cmper week after that.3.a. Does the plant whose growth is represented by the above diagram have aregular pattern <strong>of</strong> growth? (Assume time in days is represented on the x axisand height in centimetres on the y axis.)____________________________b. Calculate the rate <strong>of</strong> growth between each <strong>of</strong> the consecutive points.______________________________________________________________________________________________________________________________4. In order for the growth pattern <strong>of</strong> a plant to be represented by a complete straightline, what type <strong>of</strong> growth pattern must the plant have throughout its life?__________________________________________________________________________________________________________________________________________5. What determines the shape <strong>of</strong> the graph that represents the growth pattern <strong>of</strong> aplant?_____________________________________________________________________________________________________________________________________Draft 01 © <strong>Project</strong> <strong>Maths</strong> Development Team 2011 <strong>Growth</strong> <strong>of</strong> a <strong>Plant</strong> Page 3 <strong>of</strong> 3