Correlation Coefficient - Project Maths
Correlation Coefficient - Project Maths
Correlation Coefficient - Project Maths
You also want an ePaper? Increase the reach of your titles
YUMPU automatically turns print PDFs into web optimized ePapers that Google loves.
Teaching & Learning PlansThe <strong>Correlation</strong> <strong>Coefficient</strong>Leaving Certificate Syllabus
The Teaching & Learning Plansare structured as follows:Aims outline what the lesson, or series of lessons, hopes to achieve.Prior Knowledge points to relevant knowledge students may already have and alsoto knowledge which may be necessary in order to support them in accessing this newtopic.Learning Outcomes outline what a student will be able to do, know and understandhaving completed the topic.Relationship to Syllabus refers to the relevant section of either the Junior and/orLeaving Certificate Syllabus.Resources Required lists the resources which will be needed in the teaching andlearning of a particular topic.Introducing the topic (in some plans only) outlines an approach to introducing thetopic.Lesson Interaction is set out under four sub-headings:i. Student Learning Tasks – Teacher Input: This section focuses on possible linesof inquiry and gives details of the key student tasks and teacher questions whichmove the lesson forward.ii.Student Activities – Possible Responses: Gives details of possible studentreactions and responses and possible misconceptions students may have.iii. Teacher’s Support and Actions: Gives details of teacher actions designed tosupport and scaffold student learning.iv.Assessing the Learning: Suggests questions a teacher might ask to evaluatewhether the goals/learning outcomes are being/have been achieved. Thisevaluation will inform and direct the teaching and learning activities of the nextclass(es).Student Activities linked to the lesson(s) are provided at the end of each plan.
Teaching & Learning Plan:The <strong>Correlation</strong> <strong>Coefficient</strong>Aims• To familiarise students with scatter plots and the concept of correlationPrior Knowledge• Plotting points on the x and y axis• Finding the slope between two points• Finding the equation of a line• Linear RelationshipsLearning OutcomesAs a result of studying this topic, students will be able to:• use scatter plots to determine the relationship between variables (OL)• recognise that correlation is a value from -1 to +1 (OL)• match correlation coefficients to appropriate scatter plots (OL)• understand that correlation does not imply causality (OL)• draw the line of best fit (HL)• use the line of best fit to make predictions (HL)• calculate the correlation coefficient by calculator (HL)Catering for Learner DiversityIn class, the needs of all students whatever their ability level are equally important. Indaily classroom teaching, teachers can cater for different abilities by providing studentswith different activities and assignments graded according to levels of difficulty so thatstudents can work on exercises that match their progress in learning. Some studentsmay only be able to engage in activities which are relatively straightforward, whileothers may be able to engage in more open-ended and challenging activities. Selectingand assigning activities appropriate to a student’s ability will cultivate and sustain his/her interest in learning.In interacting with the whole class, teachers can employ effective and inclusivequestioning. Questions can be pitched at different levels and can move from basicquestioning to ones which are of a higher order nature. In this T & L Plan, some studentsmay be required to answer a question such as: Estimate the correlation coefficientfrom a particular scatter plot? A more challenging question can be reserved forothers: Interpret the correlation coefficient in the context of the variables?Besides whole-class teaching, teachers can consider different grouping strategies – suchas group and pair work – to encourage student interaction, help students to verbalise© <strong>Project</strong> <strong>Maths</strong> Development Team 2011 www.projectmaths.ie 1
Teaching & Learning Plan: The <strong>Correlation</strong> <strong>Coefficient</strong>their mathematical understanding and help to build student self-confidence andmathematical understanding. During the activities in this T&L students are encouragedto work in pairs and discuss the context.Relationship to Leaving Certificate SyllabusStudents learnabout1.6 Representingdatagraphicallyand numericallyStudents working at OLshould be able toGraphical• determine therelationship betweenvariables usingscatterplots• recognise that correlationis a value from -1 to +1and that it measuresthe extent of the linearrelationship between twovariables• match correlationcoefficient values toappropriate scatter plots• understand thatcorrelation does notimply causalityIn addition, studentsworking at HL should beable toGraphical• draw the line of best fitby eye• make predictions basedon the line of best fit• calculate the correlationcoefficient by calculatorNumerical• recognise the effect ofoutliers• use percentiles to assignrelative standingTeacher NotesThere are many situations where we may want to investigate the relationship betweenvariables e.g. the capacity of an engine and the fuel efficiency of an engine, the sales ofice cream and the temperature and the number of hours studied by a student and theirsubsequent performance in an exam etc.The correlation coefficient is a mathematical way of measuring the linear relationshipbetween variables.Some terms:Bivariate data:Scatter plots:<strong>Correlation</strong>:Outlier(s):Bivariate data is a fancy way to say, ‘two-variable data.’ The easiestway to visualize bivariate data is through a scatter plotScatter plots show the relationships between two variablesmeasured on the same casesThe correlation coefficient is a measure of the direction and strengthof a linear relationshipOne or more points that do not fit the overall pattern as seen in thescatter plot© <strong>Project</strong> <strong>Maths</strong> Development Team 2011 www.projectmaths.ie 2
Teaching & Learning Plan: The <strong>Correlation</strong> <strong>Coefficient</strong>Line of best fit:Causation:A line on a scatter plot which can be drawn near the points to moreclearly show the trend between two sets of data<strong>Correlation</strong> does not imply causation i.e. a high correlation doesnot automatically imply that changes in one variable cause thechanges in the other variableNoteInformation and Communication Technologies (ICT) are used whenever andwherever appropiate to help support stunent learning. In this Teaching & Learning Planthe CD icon appears at the corresponding position of the content to indicate that aninteractive ICT module is available on the <strong>Project</strong> <strong>Maths</strong> Student’s CD.© <strong>Project</strong> <strong>Maths</strong> Development Team 2011 www.projectmaths.ie 3
Teaching & Learning Plan: The <strong>Correlation</strong> <strong>Coefficient</strong>Student Learning Tasks:Teacher Input»»Do you think thereis a link between thesize of an engine andthe fuel efficiency of aparticular car?»»»Why is fuel efficiencyimportant?»Student Activities: PossibleResponses• Engine size influences fuelefficiency.»• Larger engines use morefuel.»• The bigger the engine sizethe more fuel is needed.»Lesson InteractionTeacher’s Support and Actions»»Get students, in pairs, to writedown a sentence about fuelefficiency and engine size.»»»Write students’ statements on theboard.Assessing the Learning»»Are studentsinteracting with eachother?»»»Can students verbalisetheir reasoning?Teacher Reflections»»What does yoursentence mean?»»»Would fuel efficiencyinfluence your choiceof car?»»Can you think of otherpairs of variables thatmay be linked? »• The engine size does nothave a big influence on theamount of fuel a car uses.»»Why do you think thereis a link between thevariables you havechosen?• Ice cream sales andtemperature.»• Hours spent studying andmarks in exams.»• The amount of hours youwork and the amount ofmoney you earn.»»You may have to lead studentsinto answering this question e.g.Is there a link between ice creamsales and temperature?»»Are students able toprovide examples ofpairs of variable?»»»Are their pairs ofvariables reasonable totry and link together?»» » Are students able tomake clear statementsabout the potentiallinks betweenvariables?© <strong>Project</strong> <strong>Maths</strong> Development Team 2011 www.projectmaths.ie KEY: » next step • student answer/response 4
Teaching & Learning Plan: The <strong>Correlation</strong> <strong>Coefficient</strong>Student Learning Tasks: TeacherInput»»How could you measure thestrength of the relationship?»»»To check mathematically ifthere is a relationship wecalculate or are given thecorrelation coefficient.»»»The correlation coefficient(r) measures the linearrelationship betweenvariables. The coefficientlies between 1 and -1 and ifthe coefficient is greater 0.6than we say there is a strongpositive correlation and ifthe coefficient is smaller -0.6than we say there is a strongnegative correlation.»Student Activities:Possible Responses»»»»»»»»»»»»»»»»»»»Teacher’s Support and ActionsNote: There is no universally acceptedcriterion for applying the adjectives“strong”, “moderate” and “weak”to correlation coefficients. StateExaminations Commission (January2010). Report on the Trialling ofLeaving Certificate Sample Papers forPhase 1 <strong>Project</strong> <strong>Maths</strong>, 33. http://www.examinations.ie/schools/Report_on_Trial_final.pdf [accessed September 2011]. Thefollowing is a guide:»»Range of values of correlationcoefficient -1≤ r ≤1»»Strong positive correlation »0.6≤ r ≤1»»Weak positive correlation»0< r
Teaching & Learning Plan: The <strong>Correlation</strong> <strong>Coefficient</strong>Student Learning Tasks: Teacher InputStudent Activities: PossibleResponses• Weak negative.»»Teacher’s Support andActions»»Get the students todraw scatter plotsthat might have thesevalues for r.Assessing theLearning»»Are students able torelate the decimalsto the scale?»»»What type of correlation do we have ifthe correlation coefficient is -0.43?»»»What type of correlation do we have ifthe correlation coefficient is 0.74?»»»What type of correlation do we have ifthe correlation coefficient is 0.03?»»»What type of correlation do we have ifthe correlation coefficient is -0.81?»»»What type of correlation do we have ifthe correlation coefficient is -0.61?»»What do you think the correlationcoefficient would be for the scatter plotin Student Activity 1?• Strong positive.»»• Weak positive.»»• Strong negative.»»• Strong negative.»»Do studentsunderstand decimalsin the range -1≤ r ≤1»»Are students ableto link the r valuesto the correctmathematicalstatement e.g. strongpositive etc.»»Are studentsable to make areasonable andmeaningful estimateof the correlationcoefficient?»Teacher Reflections»»Why is the coefficient here negative?»»»Could it be -0.4?• Students here may give avariety of responses.Note: The correlationcoefficient for StudentActivity 1 is -0.91.»»Discuss the correctvalue with thestudents.» » Are students ableto take the valueof the correlationcoefficient andrelate it back totheir mathematicalconclusions?© <strong>Project</strong> <strong>Maths</strong> Development Team 2011 www.projectmaths.ie KEY: » next step • student answer/response 7
Teaching & Learning Plan: The <strong>Correlation</strong> <strong>Coefficient</strong>Student Learning Tasks:Teacher Input»»Draw a scatter plot thatwould have a strongpositive correlation?»Student Activities: PossibleResponses• Students may give a variety ofanswers here.Teacher’s Support andActions»»Get students in pairs todraw their own plots.Assessing the Learning»»Are students drawing plotsthat make sense?Teacher Reflections»»Draw a scatter plot thatwould have a strongnegative correlation?»»»Draw a scatter plot thatwould have a correlationclose to 0?»»Here are some numberlines. Can you shadeon the lines the valuesof the correlationcoefficient which indicatedifferent types ofcorrelation?»»»Complete StudentActivity 2A.• Student responses here willbe dependent on their priorknowledge of inequalities.»»Distribute StudentActivity 2 A.»»Circulate the room.»»»Get students in groups toput their answers on theboard.»»»Some extra work maybe required here oninequalities e.g. ages inthe classroom today are15≤ A ≤17»»Are students shading thelines correctly?»» » Are students able tointerpret the sets from thenow shaded number lines?© <strong>Project</strong> <strong>Maths</strong> Development Team 2011 www.projectmaths.ie KEY: » next step • student answer/response 8
Teaching & Learning Plan: The <strong>Correlation</strong> <strong>Coefficient</strong>Student Learning Tasks: TeacherInput»»Here are some scatter plots withtheir corresponding correlationcoefficients. Can you matcheach graph with its correlationcoefficient?Student Activities:Possible Responses• Students may askabout slope andattempt to calculatethe slope.Teacher’s Support andActions»»Distribute StudentActivitiy 2B and StudentActivitiy 2C.Assessing the Learning»»Circulate the room and askstudents to justify theirselections.»»»Use the slope as an aid tounderstanding positiveand negative correlation.»»Are students matching thecoefficients correctly to thegraphs?»»»Do students understandthat the value of slopeis not the value of thecorrelation coefficient?»»»For extra work use http://istics.net/stat/<strong>Correlation</strong>s/Teacher Reflections»»What do we mean by linearrelationships?»»»In Student Activities 2B andStudent Activitiy 2C we werematching correlation coefficientsto graphs now we are going tointerpret the correlation so wecan make statements about thelinear links between variables.»»»»»»»»»»»»»What is a linear relationship?»»• A line.»A formula.»»»What is a variable?• Something that canvary in value.© <strong>Project</strong> <strong>Maths</strong> Development Team 2011 www.projectmaths.ie KEY: » next step • student answer/response 9
Teaching & Learning Plan: The <strong>Correlation</strong> <strong>Coefficient</strong>Student Learning Tasks:Teacher Input»»Now we are going to lookat three activities that testyour understanding of thecorrelation coefficient scale.»Student Activities:Possible ResponsesTeacher’s Support andActions»»Distribute Student Activity3A.Assessing the Learning»»Complete the scatter plotand answer the questions onthe correlation coefficient.»»Circulate and take noteof students’ difficulties.Encourage students todiscuss these difficulties andtalk them through.»»Are students labellingtheir axes correctly?»»»Can students explaintheir choices and giveclear reasons to supportthose choices?»»»Are students usingcorrelation terminologyin a suitable context?»»Are students able tointerpret the correlationscorrectly?»Teacher Reflections»»Match each correlationcoefficient with the correctstatement in StudentActivity 3B.»»In Student Activity 3B writea sentence based on thevalue of the correlationcoefficient.• Students may chooserandom answers.Compare answersaround the room.»»Distribute Student Activity3B and Student Activity 3C.»»Give students time todiscuss their choices.»»Can students justify eachselection?»» » Are students able toidentify what is wrongwith the other answers?© <strong>Project</strong> <strong>Maths</strong> Development Team 2011 www.projectmaths.ie KEY: » next step • student answer/response 10
Teaching & Learning Plan: The <strong>Correlation</strong> <strong>Coefficient</strong>Student Learning Tasks: Teacher Input»»The next activity is about how tocalculate the correlation coefficientusing a calculator and causation.Student Activities: PossibleResponsesTeacher’s Supportand ActionsAssessing the Learning»»For information oncalculator use go to »www.projectmaths.ie»Teacher Reflections»»For an applet thatcalculates the correlationcoefficient go to: http://www.easycalculation.com/statistics/correlation.php»»Look back at Student 3A. In thisactivity there was a strong correlationbetween temperature and ice creamsales. Are there any other variablesthat can influence ice cream sales?»»»It does however seem reasonablethat the rise in temperature doeshave an effect on ice cream sales.We can say here that the strongpositive correlation does indicate thattemperature rises causes increasedsales of ice cream.• Schools may be closed andstudents are buying moreice cream.»• There may be more sales ata weekend.»• There may be more salesduring a holiday period.© <strong>Project</strong> <strong>Maths</strong> Development Team 2011 www.projectmaths.ie KEY: » next step • student answer/response 11
Teaching & Learning Plan: The <strong>Correlation</strong> <strong>Coefficient</strong>Student Learning Tasks: Teacher InputStudent Activities:Possible Responses• Students reportback to the rest ofthe class.»Teacher’s Support and ActionsAssessing theLearning»»Are student’scalculatingthe coefficientcorrectly?»• Discuss with classtheir answersto and theirinterpretationof the answer toquestion (ii).»»Distribute Student Activity 4.»»Read the introduction with theclass and ask students to fill inthe activity sheet. »»»Calculator use: Teacher hands outinstructions or writes instructionson the board. An emulator canbe used here if it is available.»»»Are studentsinterpretingthe correlationcoefficientscorrectly?»Teacher Reflections»»For Ordinary Level studentsthe correlation coefficients forStudent Activity 4 arei 0.91ii -0.93iii 0.97iv -0.73»»Compare students’ work and letthem discuss where they drewtheir lines.»»»Are studentsdiscussingcausationalong with thecorrelationcoefficient?»»What pattern is emerging from the scatterplots you have drawn? See Student Activity1A and Student Activity 3A.»»If you were to draw a line to show thedirection in these patterns where would youdraw them?»» » Arrive at a decision for which linegives the best indication of thepattern.»»The lines we have been trying to find arecalled the line of best fit. This is the line thatis the closest fit to the data. »Note: We draw this line only when we have astrong positive or strong negative correlation.© <strong>Project</strong> <strong>Maths</strong> Development Team 2011 www.projectmaths.ie KEY: » next step • student answer/response 12
Teaching & Learning Plan: The <strong>Correlation</strong> <strong>Coefficient</strong>Student Learning Tasks:Teacher Input»»We are now going to tryand draw the line of bestfit. We are also going touse the line and interpretits slope.»Student Activities: PossibleResponses»»Compare student answersand discuss with the class theanswers to questions (viii),(ix), (x) and (xi).Teacher’s Support andActions»»Distribute Student Activity5.Assessing the Learning»»Ask students to draw thescatter plot and followthe steps to draw the lineof best fit.»»When is it appropriate todraw this line?»»»»Encourage discussionamongst the students.»»Are students able to drawthe line of best fit?»»»For an interesting appleton the line of best fit goto: http://staff.argyll.epsb.ca/jreed/math9/strand4/scatterPlot.htmTeacher Reflections»»Why would it be useful?»»»»Is this line always acorrect measure of therelationship between thevariables?• When there is a high positiveor negative correlation andwhen the relationship lookslinear.»• It can help to estimateoutcomes. »• It is not exact but it is thebest “fit”.»»Do students understand theusefulness of the line ofbest fit?»» » Do students understand thelimitations of the line ofbest fit?© <strong>Project</strong> <strong>Maths</strong> Development Team 2011 www.projectmaths.ie KEY: » next step • student answer/response 13
Teaching & Learning Plan: The <strong>Correlation</strong> <strong>Coefficient</strong>Student Learning Tasks:Teacher Input»»Sometimes when we doa scatter plot we cancome across a result thatis out of step with therest of the data. Justbecause the piece of datadoes not “fit” this doesnot mean it is wrong.Data like this are calledoutliers and can havea major effect on thecorrelation coefficientand the line of best fit.»»We are now going tolook at Student Activity6.Student Activities: PossibleResponsesTeacher’s Support andActionsAssessing the LearningTeacher Reflections»»Outliers can distort thecorrelation dramatically.An outlier(s) can makea weak correlation lookbig or hide a strongcorrelation.»»»Distribute Student Activity6.»»Write on the board thefollowing notes about whatto do with outliers:- Do the calculation with or»without the outlier.- Check for error in data.- Investigate the data point.»»»In this activity Identifythe outlier(s)?»»»What effect does it have?Note: This piece of data wasinvestigated and found to becorrect. Can students explainhow there can be such a pieceof data?© <strong>Project</strong> <strong>Maths</strong> Development Team 2011 www.projectmaths.ie KEY: » next step • student answer/response 14
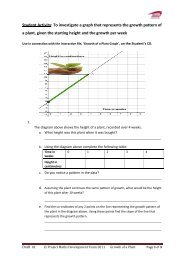
Teaching & Learning Plan: Introduction to EquationsStudent Activity 1Drawing a Scatter PlotBelow is some recent research about engine sizes. This data shows theengine size and the fuel economy of a range of petrol car.Engine Size (cc) 1.0 1.1 1.2 1.3 1.4 1.6 1.7 2.0 3.0 3.5 4.0Fuel Economy 18 16 14 16 13 12 12.5 12 11 8.8 6.5(k.p.l.)iShow this information on a scatter diagram.kpl201816141210864200.25 0.5 0.75 1.0 1.25 1.5 1.75 2.0 2.25 2.5 2.75 3.0 3.25 3.5 3.75 4.0 Engine Size (cc)ii Describe, in your own words the relationship between the engine sizeand fuel economy of these cars. ______________________________________ ___________________________________________________________________ ___________________________________________________________________ __________________________________________________________________iii A car manufacturer produces a new car with a 1.8 litre engine and afuel efficiency of 17 kilometres per litre. Plot this car’s performance onyour scatter plot. If you were interested in buying a new car that wasfuel efficient with this size engine would you buy this car? Write a shortcomment. __________________________________________________________ ___________________________________________________________________ ___________________________________________________________________ ___________________________________________________________________ __________________________________________________________________© <strong>Project</strong> <strong>Maths</strong> Development Team 2011 www.projectmaths.ie 15
Teaching & Learning Plan: The <strong>Correlation</strong> <strong>Coefficient</strong>Student Activity 2A<strong>Correlation</strong> Coefficent: The scaleOn the number line below shade in the possible values of the correlationcoefficent.-2 -1 0 1 2On the number line below shade in the possible values of the correlationcoefficent that indicate a strong positive correlation.-2 -1 0 1 2On the number line below shade in the possible values of the correlationcoefficent that indicate a weak positive correlation.-2 -1 0 1 2On the number line below shade in the possible values of the correlationcoefficent that indicate a strong negative correlation-2 -1 0 1 2On the number line below shade in the possible values of the correlationcoefficent that indicate a weak negative correlation-2 -1 0 1 2© <strong>Project</strong> <strong>Maths</strong> Development Team 2011 www.projectmaths.ie 16
Teaching & Learning Plan: The <strong>Correlation</strong> <strong>Coefficient</strong>Student Activity 2BMatching <strong>Correlation</strong> <strong>Coefficient</strong>s to Scatter PlotsThe table shows the correlations for the four graphs below. Match each graph to thecorrelation coefficient.<strong>Correlation</strong> -0.72 1 -1 0GraphGraph AGraph BGraph CGraph D© <strong>Project</strong> <strong>Maths</strong> Development Team 2011 www.projectmaths.ie 17
Teaching & Learning Plan: The <strong>Correlation</strong> <strong>Coefficient</strong>Student Activity 2CMatching <strong>Correlation</strong> <strong>Coefficient</strong>s to Scatter PlotsThe table shows the correlations for the four graphs below. Match each graph to itscorrelation coefficient.<strong>Correlation</strong> 0.72 -0.90 0.96 -0.42GraphGraph AGraph BGraph CGraph DFor extra work use http://istics.net/stat/<strong>Correlation</strong>s/© <strong>Project</strong> <strong>Maths</strong> Development Team 2011 www.projectmaths.ie 18
Teaching & Learning Plan: The <strong>Correlation</strong> <strong>Coefficient</strong>Teacher Answers for 2B & 2CSolutionsActivity 2B<strong>Correlation</strong> -0.72 1 -1 0Graph D A B CActivity 2C<strong>Correlation</strong> 0.72 -0.90 0.96 -0.42Graph C B A D© <strong>Project</strong> <strong>Maths</strong> Development Team 2011 www.projectmaths.ie 19
Teaching & Learning Plan: The <strong>Correlation</strong> <strong>Coefficient</strong>Student Activity 3AInterpreting the data and the<strong>Correlation</strong> <strong>Coefficient</strong>An ice cream seller records the maximum daily temperature and the number of icecreams she sells each day. Her results for a period of ten days are shown in the table.Maximumtemperature (°C)Number of icecreams sold22 26 25 27 25 20 24 26 28 2785 102 94 103 92 72 89 100 107 105(i) Display the data in a way that allows you to examine the relationship between thetwo variables.© <strong>Project</strong> <strong>Maths</strong> Development Team 2011 www.projectmaths.ie 20
Teaching & Learning Plan: The <strong>Correlation</strong> <strong>Coefficient</strong>Student Activity 3A (continued)(ii) The correlation coefficient here is 0.98. With this in mind and looking at the scatterplot which of the following statements is correct. Give a reason for your answer.A. As the temperature increases ice cream sales increase.B. As the temperature increases ice cream sales tend to increase.C. There is no evidence of a linear relationship between temperature and ice creamsales.D. As the temperature increases ice cream sales decrease.E. As the temperature increases ice cream sales tend to decrease.Choice: __________________________________________________________________________Reason for your answer:_______________________________________________________________________________________________________________________________________________________________________________________________________________________________________________________________________________________________________________________________________________________________________________________________________________________________________________________________________________If the correlation coefficient had been 0.4 which of the above statements would becorrect.Choice: __________________________________________________________________________If the correlation coefficient had been -0.7 which of the above statements would becorrect?Choice: __________________________________________________________________________Identify two statements that are always incorrect no matter what the value of thecorrelation coefficient is. Give a reason for your answer.Choices: _________________________________________________________________________Reason for your answer:_______________________________________________________________________________________________________________________________________________________________________________________________________________________________________________________________________________________________________________________________________________________________________________________________________________________________________________________________________________© <strong>Project</strong> <strong>Maths</strong> Development Team 2011 www.projectmaths.ie 21
Teaching & Learning Plan: The <strong>Correlation</strong> <strong>Coefficient</strong>Student Activity 3BInterpreting the data andthe <strong>Correlation</strong> <strong>Coefficient</strong>Here are the results of some other research with their correlation coefficients:Pick the appropriate statement for each survey and give a reason for your answer.1. In a survey the correlation coefficient between engine size and fuel economy wasfound to be -0.9.A. As the engine size increases fuel efficiency increases.B. As the engine size increases fuel efficiency tends to increase.C. There is no evidence of a linear relationship between engine size and fuel efficiency.D. As the engine size increases fuel efficiency decreases.E. As the engine size increases fuel efficiency tends to decrease.Choices: _________________________________________________________________________Reason for your answer:_____________________________________________________________________________________________________________________________________________________________________________________________________________________________________________________________________________________________________________2. In a survey the correlation between the numbers of hours per week students spentstudying and their performance in an exam was 0.7.A. As the number of hours spent studying increases student exam performanceincreases.B. As the number of hours spent studying increases student exam performance tendsto increase.C. There is no evidence of a linear relationship between the number of hours spentstudying and student exam performance.D. As the number of hours spent studying increases student exam performancedecreases.E. As the number of hours spent studying increases student exam performance tendsto decrease.Choices: _________________________________________________________________________Reason for your answer:_____________________________________________________________________________________________________________________________________________________________________________________________________________________________________________________________________________________________________________© <strong>Project</strong> <strong>Maths</strong> Development Team 2011 www.projectmaths.ie 22
Teaching & Learning Plan: The <strong>Correlation</strong> <strong>Coefficient</strong>Student Activity 3CInterpreting the data andthe <strong>Correlation</strong> <strong>Coefficient</strong>Here are the results of some other research with their correlation coefficients:(i) In a survey the correlation between the heights of male students and their shoesizes was -0.01.(ii) In the 1960’s the U.S. army undertook research into the relationship between aman’s height and the chances of him receiving a promotion. The results showed thatthe correlation between a man’s height and his chance of promotion was 0.8.Pretend you are a journalist, write a sentence based on the value of the correlationcoefficients in (i) and (ii) above._____________________________________________________________________________________________________________________________________________________________________________________________________________________________________________________________________________________________________________________________________________________________________________________________________________________________________________________________________________________________________________________________________________________________________________________________________________________________________________________________________________________________________________________________________________________________________________________________________________________________________________________________________________________________________________________________________________________________________________________________________________________________________________________________________________________________________________________________________________________________________________________________________________________________________________________________________________________________________________________________________________________________________________________________________________________________________________________________________________________________________________________________________________________________________________________________________________________________________________________________________________________________________________________________________________________________________© <strong>Project</strong> <strong>Maths</strong> Development Team 2011 www.projectmaths.ie 23
Teaching & Learning Plan: The <strong>Correlation</strong> <strong>Coefficient</strong>Student Activity 4Calculating the <strong>Correlation</strong> <strong>Coefficient</strong> (HL)and Causation (OL)For each of the following sets of data calculate the correlation coefficient and write aconclusion.Note: In some of the surveys below there are strong correlations but this does notalways imply causation. In some cases there may be a lurking variable that can explainthe strong correlation. For example in the last 10 years there is a strong positivecorrelation between the sales of cars and the sales of electrical items. Can we say a risein the sale of cars tends to lead to a rise in the sale of electrical items? No we cannot.The lurking variable here is the performance of the economy as a whole.<strong>Correlation</strong> does not always imply causation.Using your calculator calculate the correlation coefficient and write a conclusion.iRoller coasters get their speed as a result of dropping down a steep incline. Thetable below gives height of a drop and the speed achieved for different rollercoasters around the world.Drop in Metres (m) 25 30 28 58 55 40 90 10080 90 78 93 90 93 105 128Speed of the coaster(k.p.h)<strong>Correlation</strong> <strong>Coefficient</strong>: ___________________________________________________________Conclusion:__________________________________________________________________________________________________________________________________________________________________________________________________________________________________________________________________________________________________________________________iiThe table shows the number of units of electricity used in heating a house on tendifferent days and the average temperature for each day.AveragetemperatureUnits of electricityused6 2 0 6 3 5 10 8 9 1228 38 41 34 31 31 22 25 23 22<strong>Correlation</strong> <strong>Coefficient</strong>: ___________________________________________________________Conclusion:__________________________________________________________________________________________________________________________________________________________________________________________________________________________________________________________________________________________________________________________© <strong>Project</strong> <strong>Maths</strong> Development Team 2011 www.projectmaths.ie 24
Teaching & Learning Plan: The <strong>Correlation</strong> <strong>Coefficient</strong>Student Activity 4 (continued)iii The table shows the number washing machines sold on 8 different months inan electrical supply shop and the number of dishwashers sold for each of thosemonths.Number of WashingMachines soldNumber ofDishwashers sold42 65 80 110 28 40 120 4828 38 41 58 10 26 72 22<strong>Correlation</strong> <strong>Coefficient</strong>: ___________________________________________________________Conclusion:______________________________________________________________________________________________________________________________________________________________________________________________________________________________________________________________________________________________________________________________________________________________________________________________________________________________________________________________________________________________________________________________________________________________________________________________________________________________________________________________iv The table shows the average number of hours spent daily by students watchingtelevision and the average mark they achieved in their summer exams.Hours spentwatching T.V. dailyAverage scores intheir exams6 2 0 6 3 5 10 8 9 1228 38 41 34 31 31 22 25 23 22<strong>Correlation</strong> <strong>Coefficient</strong>: ___________________________________________________________Conclusion:______________________________________________________________________________________________________________________________________________________________________________________________________________________________________________________________________________________________________________________________________________________________________________________________________________________________________________________________________________________________________________________________________________________________________________________________________________________________________________________________© <strong>Project</strong> <strong>Maths</strong> Development Team 2011 www.projectmaths.ie 25
Teaching & Learning Plan: The <strong>Correlation</strong> <strong>Coefficient</strong>Student Activity 5Line of Best Fit (HL only)The following table shows the weekly rainfall (x cm) and the number of tourists(y thousand) visiting a certain beauty spot, for 9 successive weeks.Rainfall (x cm) 4.5 3.0 5.2 5.0 2.1 0 0 1.2 3.25.0 8.0 0.8 4.2 4.8 7.4 9.4 8.6 2.6No. of tourists(y thousand)iDraw a scatter plot for this data.ii Find the mean rainfall ._ ____________________________________________________iii Find the mean number of tourists.__________________________________________iv Plot the point. Draw lines parallel to the x-axis and y-axis through this point.vThis splits the scatter plot into 4 quadrants. In which quadrants do you find themost points?________________________________________________________________________________________________________________________________________________© <strong>Project</strong> <strong>Maths</strong> Development Team 2011 www.projectmaths.ie 26
Teaching & Learning Plan: The <strong>Correlation</strong> <strong>Coefficient</strong>Student Activity 5 (continued)Line of Best Fit (HL only)vi Draw a line of best fit. Draw an oval around the data. The line must go through. The line of best fit should go through the two quadrants that contain the mostdata points.vii On the 10th week there was 4cm of rainfall. Use your line of best fit to estimate thenumber of tourists that had visited the beauty spot in the 10th week.__________________________________________________________________________________________viii By picking appropriate points find the slope of the line of best fit.________________ix Interpret the slope in the context of rainfall and number of tourists.______________________________________________________________________________________________________________________________________________________________________________________________________________________________________________________________________________________________________________________________________xFind the equation of the line of best fit and use it to check your answer to part vii._________________________________________________________________________________________________________________________________________________________________________________________________________________________________________________________________________________________________________________________xi The manager of the café at this beauty spot has to plan staffing levels. A mix offull time and part time staff are employed. In the light of the information aboveand the fact that the correlation coefficient is -0.78 what advice would you give themanager?____________________________________________________________________________________________________________________________________________________________________________________________________________________________________________________________________________________________________________________________________________________________________________________________________________________________________________________________________________________________________________________________________________________________________________________________________________________________________________________________________________________________________________________________________________________________________________________________________________________________________________________________________________________________________________________________________________________________________________________________________________________________________________© <strong>Project</strong> <strong>Maths</strong> Development Team 2011 www.projectmaths.ie 27
Teaching & Learning Plan: The <strong>Correlation</strong> <strong>Coefficient</strong>Student Activity 6OutliersA Company surveyed 12 of its employees. Below is a table of their year’s experiencewith the company and their income.Full Yearsexperience10 8 4 12 7 6 1 3 4 5 12 7Salary (€ 000’s) 41 33 27 46 29 33 20 27 44 32 38 32iDraw a scatter plot of the data.iiCircle one or more outliers.iii Calculate the correlation coefficient for all the data._ ____________________________iv Remove the outlier and calculate the correlation coefficient._____________________vWhat do you notice?_ ___________________________________________________________________________________________________________________________________________________________________________________________________________________________________________________________________________________________________Draw your line of best fit for all the data and draw the line of best fit when theoutlier is removed.vi What effect, if any, does removing the outlier have on the line of best fit?__________________________________________________________________________________________________________________________________________________________________________________________________________________________________________________© <strong>Project</strong> <strong>Maths</strong> Development Team 2011 www.projectmaths.ie 28


