Correlation Coefficient - Project Maths
Correlation Coefficient - Project Maths
Correlation Coefficient - Project Maths

Create successful ePaper yourself
Turn your PDF publications into a flip-book with our unique Google optimized e-Paper software.
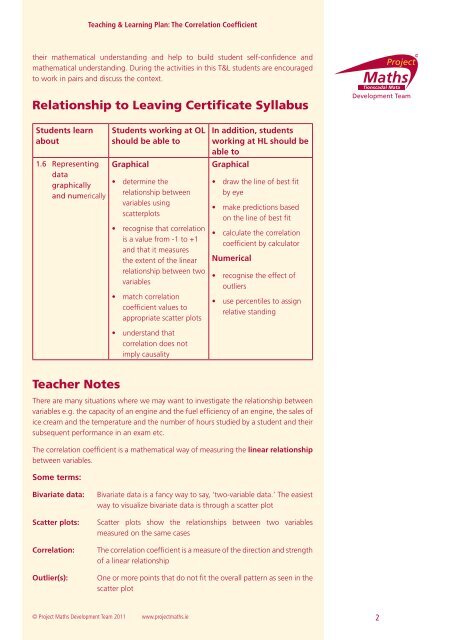
Teaching & Learning Plan: The <strong>Correlation</strong> <strong>Coefficient</strong>their mathematical understanding and help to build student self-confidence andmathematical understanding. During the activities in this T&L students are encouragedto work in pairs and discuss the context.Relationship to Leaving Certificate SyllabusStudents learnabout1.6 Representingdatagraphicallyand numericallyStudents working at OLshould be able toGraphical• determine therelationship betweenvariables usingscatterplots• recognise that correlationis a value from -1 to +1and that it measuresthe extent of the linearrelationship between twovariables• match correlationcoefficient values toappropriate scatter plots• understand thatcorrelation does notimply causalityIn addition, studentsworking at HL should beable toGraphical• draw the line of best fitby eye• make predictions basedon the line of best fit• calculate the correlationcoefficient by calculatorNumerical• recognise the effect ofoutliers• use percentiles to assignrelative standingTeacher NotesThere are many situations where we may want to investigate the relationship betweenvariables e.g. the capacity of an engine and the fuel efficiency of an engine, the sales ofice cream and the temperature and the number of hours studied by a student and theirsubsequent performance in an exam etc.The correlation coefficient is a mathematical way of measuring the linear relationshipbetween variables.Some terms:Bivariate data:Scatter plots:<strong>Correlation</strong>:Outlier(s):Bivariate data is a fancy way to say, ‘two-variable data.’ The easiestway to visualize bivariate data is through a scatter plotScatter plots show the relationships between two variablesmeasured on the same casesThe correlation coefficient is a measure of the direction and strengthof a linear relationshipOne or more points that do not fit the overall pattern as seen in thescatter plot© <strong>Project</strong> <strong>Maths</strong> Development Team 2011 www.projectmaths.ie 2