Correlation Coefficient - Project Maths
Correlation Coefficient - Project Maths
Correlation Coefficient - Project Maths

Create successful ePaper yourself
Turn your PDF publications into a flip-book with our unique Google optimized e-Paper software.
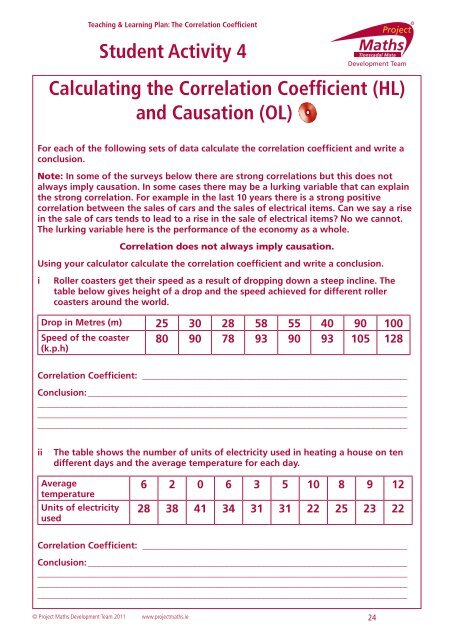
Teaching & Learning Plan: The <strong>Correlation</strong> <strong>Coefficient</strong>Student Activity 4Calculating the <strong>Correlation</strong> <strong>Coefficient</strong> (HL)and Causation (OL)For each of the following sets of data calculate the correlation coefficient and write aconclusion.Note: In some of the surveys below there are strong correlations but this does notalways imply causation. In some cases there may be a lurking variable that can explainthe strong correlation. For example in the last 10 years there is a strong positivecorrelation between the sales of cars and the sales of electrical items. Can we say a risein the sale of cars tends to lead to a rise in the sale of electrical items? No we cannot.The lurking variable here is the performance of the economy as a whole.<strong>Correlation</strong> does not always imply causation.Using your calculator calculate the correlation coefficient and write a conclusion.iRoller coasters get their speed as a result of dropping down a steep incline. Thetable below gives height of a drop and the speed achieved for different rollercoasters around the world.Drop in Metres (m) 25 30 28 58 55 40 90 10080 90 78 93 90 93 105 128Speed of the coaster(k.p.h)<strong>Correlation</strong> <strong>Coefficient</strong>: ___________________________________________________________Conclusion:__________________________________________________________________________________________________________________________________________________________________________________________________________________________________________________________________________________________________________________________iiThe table shows the number of units of electricity used in heating a house on tendifferent days and the average temperature for each day.AveragetemperatureUnits of electricityused6 2 0 6 3 5 10 8 9 1228 38 41 34 31 31 22 25 23 22<strong>Correlation</strong> <strong>Coefficient</strong>: ___________________________________________________________Conclusion:__________________________________________________________________________________________________________________________________________________________________________________________________________________________________________________________________________________________________________________________© <strong>Project</strong> <strong>Maths</strong> Development Team 2011 www.projectmaths.ie 24