Deutsche Bank Latin America Renewable Power Day
Deutsche Bank Latin America Renewable Power Day
Deutsche Bank Latin America Renewable Power Day

Create successful ePaper yourself
Turn your PDF publications into a flip-book with our unique Google optimized e-Paper software.
Tractebel Energia | GDF SUEZ – All Rights Reserved<br />
<strong>Deutsche</strong> <strong>Bank</strong><br />
<strong>Latin</strong> <strong>America</strong> <strong>Renewable</strong> <strong>Power</strong> <strong>Day</strong><br />
January 24, 2012<br />
1
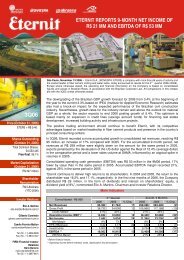
Tractebel Energia: market position<br />
� Largest private sector electricity generating company in Brazil, with 6.6% generating<br />
market share.<br />
� ISO 9.001 and ISO 14.000 at its plants.<br />
� Shares on BOVESPA – 68.7% owned by GDF SUEZ – Novo Mercado (TBLE3).<br />
� ISE – Corporate Sustainability Index.<br />
8.9<br />
2.0 3<br />
6.9 4<br />
Private Sector – Installed Capacity (GW)<br />
2.7<br />
2.8<br />
0.2 3<br />
2.6<br />
2.2<br />
1.8<br />
0.4 3<br />
1.8 3<br />
1.4 1.3<br />
Tractebel AES Tietê CPFL Duke Energy EdP Neoenergia Endesa<br />
3.1<br />
Source: ANEEL, company websites and internal studies.<br />
Notes:<br />
¹ Value corresponds to SIN – National Interlinked System.<br />
² Includes only the Brazilian tranche of Itaipu.<br />
3 Installed capacity under construction. For Tractebel, the figure includes the holding company’s share (50.1%) in Jirau HPP.<br />
4 The complete motorization of Estreito HPP is expected for 2012.<br />
2<br />
1.0<br />
Brazil – Existing Installed Capacity 1,2<br />
Others<br />
24.9%<br />
Duke Energy<br />
2.1%<br />
CPFL<br />
2.5%<br />
AES Tietê<br />
2.5%<br />
Copel<br />
4.4%<br />
Petrobras<br />
5.7% Cemig Tractebel<br />
6.6% 6.6%<br />
Itaipu<br />
6.7%<br />
Eletrobrás<br />
30.9%<br />
CESP<br />
7.1%
Tractebel is controlled by GDF SUEZ, world leader in energy<br />
99.99%<br />
50.10%<br />
SUEZ Energia<br />
Renovável<br />
40.07%<br />
99.99%<br />
Companhia<br />
Energética São<br />
Salvador<br />
99.99%<br />
Lages<br />
Bioenergética<br />
99.99%<br />
3<br />
100%<br />
Energy <strong>Latin</strong> <strong>America</strong><br />
Participações Ltda<br />
68.71%<br />
Tractebel<br />
Trading<br />
Company<br />
99.90% 99.99%<br />
78.53%<br />
Energy Brasil<br />
48.75% 2.82%<br />
87.99% 99.99% 99.99% 99.99% 99.99% 99.99%<br />
Ibitiúva<br />
Bioenergética<br />
Tractebel<br />
Complementary<br />
Energy<br />
Ponte de Pedra<br />
Energética<br />
Tupan Hidropower Areia Branca Pedra do Sal Beberibe<br />
NB: Simplified structure
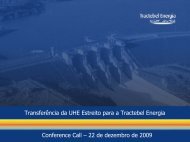
Tractebel Energia: generating complex<br />
Installed capacity of 6,907.6 1 MW from 22 plants operated by Tractebel Energia: 81% hydro, 17% thermal and 2%<br />
complementary. This capacity has seen a 86% increase since 1998.<br />
Thermal <strong>Power</strong> Plants<br />
Installed<br />
Capacity (MW)<br />
Commercial<br />
Capacity (aMW)<br />
19<br />
Pedra do Sal (Wind)<br />
2<br />
Jorge Lacerda Complex4 10<br />
857.0 649.9<br />
11 William Arjona 190.0 136.1<br />
12 Charqueadas 72.0 45.7<br />
13 Alegrete 66.0 21.1<br />
Total 1,185.0 852.8<br />
Complementary <strong>Power</strong> Installed Commercial<br />
Plants<br />
Capacity (MW) Capacity (aMW) 2<br />
Hydro <strong>Power</strong> Plants<br />
Installed<br />
Capacity (MW)<br />
Commercial<br />
Capacity (aMW)<br />
14 Lages (Biomass) 28.0 25.0<br />
15 Rondonópolis (SHP) 26.6 10.1<br />
16 Beberibe (Wind) 25.6 7.8<br />
17 José Gelazio da Rocha (SHP) 23.7 9.2<br />
2<br />
Salto Santiago 1,420.0 723.0<br />
Itá 1,126.93 544.23 Salto Osório 1,078.0 522.0<br />
Cana Brava 450.0 273.5<br />
Estreito1 435.63 256.93 1<br />
2<br />
3<br />
4<br />
5<br />
Machadinho 403.9<br />
7 São Salvador 243.2 148.5<br />
9 Ponte de Pedra 176.1 131.6<br />
Total 5,559.7 2,865.9<br />
3 147.23 6<br />
18 Ibitiúva (Biomass) 21.2<br />
Areia Branca (SHP)<br />
19.8 11.1<br />
20<br />
18.0 5.7<br />
3 12.83 8 Passo Fundo 226.0 119.0<br />
Total 162.9 81.7<br />
4<br />
Key<br />
<strong>Power</strong> Plants<br />
Under Construction<br />
Installed<br />
Capacity (MW)<br />
Commercial<br />
Capacity (aMW) 2<br />
1,094.55 1,878.85 21 Jirau (Hidro)<br />
74.7<br />
Total 2,024.2 1,169.2<br />
7<br />
22 Wind Projects 145.4<br />
6<br />
Notes:<br />
21<br />
Hydro<br />
Thermal<br />
Complementary<br />
Under Construction<br />
15 17<br />
9<br />
13<br />
11<br />
3 1<br />
14<br />
8 2<br />
6 10<br />
12<br />
1 The complete Estreito HPP ramp-up is expected for 2012.<br />
2 Figures following specific legislation.<br />
3 Portion owned by Tractebel Energia.<br />
4 Complex consists of 3 power plants.<br />
5 Portion owned by the Parent Company, based on 3,750 MW total installed capacity.<br />
6 Includes the Porto do Delta and Trairi Complex projects which is comprised of the<br />
Mundaú, Fleixeiras I, Trairi and Guajirú wind farms.<br />
7 Estimated value (awaiting MME definition).<br />
7<br />
4<br />
18<br />
5<br />
20<br />
19<br />
22<br />
16
Ten-year Energy Growth Plan (PDE 2020)<br />
� PDE 2020 estimates that renewable sources<br />
will account for 83% of electricity<br />
�<br />
generation (HPP, SHP, WIND, BIO).<br />
Biomass’s share of the energy matrix is<br />
expected to increase from 4.1% in 2010 to<br />
5.4% in 2020.<br />
� In this scenario, 34% of Non-Conventional<br />
<strong>Renewable</strong> Energy (ERNC) will be supplied<br />
from biomass plants, an increase from 4.4<br />
GW in 2010 to 9.1 GW in 2020.<br />
5<br />
Installed Capacity ERNC 2010‐2020<br />
SHP Biomass Wind<br />
9 GW 27 GW<br />
9%<br />
49%<br />
42%<br />
42%<br />
34%<br />
24%<br />
2010 2020
Ten-year Energy Growth Plan (PDE 2020)<br />
� Increase in annual installed capacity by source:<br />
� The Government intends to reduce share of thermoelectric plants<br />
� A question mark over nuclear<br />
� Growth is expected from hydro plants and alternative sources<br />
Increase in installed <strong>Power</strong> by Source<br />
(MW)<br />
SOURCE: EPE.<br />
11,000<br />
10,000<br />
9,000<br />
8,000<br />
7,000<br />
6,000<br />
5,000<br />
4,000<br />
3,000<br />
2,000<br />
1,000<br />
ALTERNATIVE SOURCES<br />
MINERAL COAL<br />
Contracted Growth Planned Growth<br />
42,177 MW 19,383 MW<br />
PROCESSED GAS<br />
NATURAL GAS<br />
6<br />
DIESEL OIL<br />
URANIUM<br />
FUEL OIL<br />
HYDROELECTRIC
<strong>Renewable</strong> energy: potential in Brazil<br />
Potential of renewable sources by region<br />
North<br />
Hydro<br />
Midwest:<br />
Biomass<br />
Hydro<br />
South:<br />
Wind<br />
Biomass<br />
Northeast:<br />
Wind<br />
Solar<br />
Wave<br />
Southeast:<br />
Biomass<br />
7
Hydroelectric potential – 246 GW<br />
� Installed capacity in operation: ~83 GW<br />
� 32 GW in HPPs will be added to the generating complex by 2020, totaling 115 GW<br />
� USD 50 billion will be invested in the construction of new HPPs<br />
� Main projects:<br />
� Under construction: Jirau (3.7 GW), Santo Antonio (3.1GW), Belo Monte (11 GW)<br />
� In development: Teles Pires Complex (3.6 GW), Tapajós Complex (10.7 GW)<br />
North: 40.1%<br />
Midwest: 14.6%<br />
South 17.5%<br />
North<br />
Midwest<br />
8<br />
South<br />
Southeast<br />
Northeast<br />
Region Potential %<br />
Northeast 10.1%<br />
Southeast 17.8%
Wind potential – 143 GW<br />
� Installed capacity in operation: ~1GW<br />
� Under construction: 4.5GW<br />
� 8.5% of new capacity to be installed will be wind<br />
� Average price of wind power at Auction of Aug/2011: 99.54 BRL/MWh<br />
� Greatest potential (capacity factor): Northeast and South<br />
North: 12.8 GW<br />
Midwest: 3.1 GW<br />
South: 22.8 GW<br />
9<br />
Northeast 75.1GW<br />
Southeast 29.7 GW
Solar and wave potential<br />
� The Northeast Region has the greatest<br />
potential for solar energy generation.<br />
� First solar plant in operation in the state of<br />
Ceará – 1MW<br />
10<br />
� Wave Energy Prototype – R&D project<br />
� In operation since 2011<br />
� First plant in <strong>Latin</strong> <strong>America</strong><br />
� Installed Capacity: 100 kW<br />
� Location: Porto de Pecém, state of<br />
Ceará
Main sources of biomass in Brazil<br />
� NORTH:<br />
Firewood<br />
Coal<br />
Agricultural waste<br />
Vegetable oils<br />
� MIDWEST:<br />
Firewood<br />
Industrial Waste<br />
Agricultural Waste and Vegetable Oils<br />
� SOUTH:<br />
Sugarcane bagasse and ethanol<br />
Cattle-related waste<br />
Industrial waste<br />
11<br />
� NORTHEAST:<br />
Sugarcane bagasse and ethanol<br />
Agricultural waste and vegetable oils<br />
Firewood<br />
Coal<br />
In major cities,<br />
urban waste<br />
� SOUTHEAST:<br />
Sugarcane bagasse and ethanol<br />
Firewood<br />
Coal<br />
Industrial waste<br />
Agricultural waste
Sugarcane bagasse<br />
� The sugar-ethanol sector provides the largest quantities of biomass for electricity<br />
�<br />
production in Brazil.<br />
Brazil is the largest producer of sugarcane in the world.<br />
12<br />
� The potential supply of energy from<br />
sugarcane waste is greater than 10 GW in<br />
2019;<br />
� This potential is equal to two Belo Montes<br />
(4,571 average MW).<br />
average MW<br />
6,143<br />
Technical potential of extracting electricity<br />
from bagasse to the SIN, 2010-2019<br />
Bagasse Energy (average MW)<br />
10,174
Share of renewables in Auctions<br />
Government focused on renewable<br />
sources<br />
ACR<br />
(Mwavg)<br />
13<br />
The latest Auctions confirm it!<br />
Coal Natural Gas Process Gas Fuel Oil Diesel Hydro Biomass Wind Small Hydro Total NCRE % NCRE<br />
2005 292 1.391 0 0 244 1,006 83 0 0 3,016 83 2.8%<br />
2006 0 200 200 291 241 1,530 131 0 67 2,660 198 7.4%<br />
2007 930 351 0 1,620 0 2,269 140 0 46 5,356 186 3.5%<br />
2008 276 968 0 2,801 0 1,504 583 0 0 6,132 583 9.5%<br />
2009 0 0 0 0 0 0 10 752 1 763 763 100.0%<br />
2010 0 0 0 0 0 4,456 191 899 109 5,654 1,198 21.2%<br />
2011 0 866 0 0 0 209 96 832 0 2,004 929 46.3%<br />
Total 1,498 3,776 200 4,712 485 10,973 1,234 2,483 223 25,585 3,940 15.4%<br />
% 5.9% 14.8% 0.8% 18.4% 1.9% 42.9% 4.8% 9.7% 0.9%
Competitiveness at Auctions<br />
� More attractive prices and regulatory<br />
developments have determined<br />
growth from biomass generation as of<br />
2007:<br />
� Seasonality – contracting and delivery<br />
according to harvest;<br />
� ICGs – Shared transmission installations;<br />
� Accounting rules at the CCEE;<br />
� Reserve Energy – substituting more<br />
expensive thermoelectrics.<br />
� Wind is the most competitive among the ERNC:<br />
� Reduction in the price of wind power equipment; factories idles in Europe (mainly) due to the<br />
financial crisis, since 2008; constant technological improvements (technology maturation curve);<br />
and increase in Brazilian suppliers;<br />
� At the most recent Auctions, significant reduction in energy prices: < 100 R$/MWh.<br />
14<br />
Average price of energy at auction<br />
(Base: Oct/11)<br />
140 583 - 191 96 MW Average médio MW<br />
- - 752 899 832 MW Average médio MW<br />
� As biomass generation has partipated in recent Auctions alongside wind power, and with<br />
wind project sales prices ever lower, this competition implies that biomass has the<br />
challenge of achieving market viability, as fewer and fewer biomass projects are willing to<br />
sell energy for 100 R$/MWh.<br />
Biomass<br />
Wind
Free Market – Incentivized Energy and Special Consumers<br />
• On the free market, consumers contract energy directly with a generating or trading<br />
company, and must agree with distribution and transmission companies the right to use the<br />
system (paying a tariff for use);<br />
• Types of Free Market consumers:<br />
• Free clients: contracted demand greater than 3MW and connected with tension<br />
greater or equal to 69kV. May buy energy from any source;<br />
• Special consumers: contracted demand greater than 0.5 MW and connection with<br />
tension of 13.8kV or more. May only buy energy from alternative sources;<br />
• 50% discount on Tariffs for Use of the System for<br />
incentivized energy: so as to incentivize an increase in<br />
alternative energy generation, the government has introduced<br />
a 50% discount on the tariff for use of the system for<br />
alternative energy generators and for free and special<br />
consumers that contract this energy.<br />
15<br />
Current Scenario<br />
100%<br />
TUSD<br />
Price of<br />
captive<br />
energy<br />
>=<br />
Proposed Situation<br />
50%<br />
TUSD<br />
Price of<br />
Alternative<br />
Energy
Energy sales to Special Consumers<br />
• Tractebel Comercializadora has already<br />
prospected the Special Consumers market<br />
and has clients interested in purchasing<br />
this energy in excess of 150 average MW;<br />
• The prices on the incentivized energy<br />
market are more attractive than the<br />
energy prices at the latest auctions;<br />
• Some clients are interested in showing<br />
that they buy energy from wind sources;<br />
• The contract periods should vary from<br />
2-10 years;<br />
• Just as in the Conventional Free Market,<br />
Tractebel should use this window of<br />
opportunity to be one of the first entrants<br />
in this market and gain a competitive<br />
advantage.<br />
16<br />
CAPTIVE<br />
GENERATOR<br />
Price defined at<br />
Government auction<br />
Tariff defined by<br />
Government (ANEEL)<br />
CAPTIVE<br />
CONSUMER<br />
GENERATOR<br />
FREE<br />
CONSUMER<br />
FREE<br />
Price negotiated<br />
between parties*<br />
DISTRIBUTOR TRADER<br />
Price negotiated<br />
between parties<br />
In the case of state generator: a transparent process<br />
(auction/public offering/ public announcement)
Lages Bioenergética<br />
17<br />
17
Lages Bioenergética: business model<br />
Battistella<br />
Collection: Rio Caveiras<br />
< 1.7% of minimum river flow<br />
Water<br />
Steam Process – 25 ton/h<br />
18<br />
Energy<br />
Generation: 28 MW<br />
Sale: CELESC 22 MW; ACL 3 MW<br />
Carbon Credits: ~ 220 thousand CERs/year<br />
Wood Waste: Industry and Forests
Ibitiúva Bioenergética: sugarcane bagasse<br />
� Partnership with Açúcar Guarani, at the Andrade Sugar and Alcohol Plant<br />
� Located in Pitangueiras, state of São Paulo<br />
� Operational Startup: May 2010<br />
� Installed Capacity: 33 MW<br />
� PPA: 15 years LER 2008<br />
19
Features of the partnership<br />
� The partnership model is based on a Consortium, formed of the Sugar and Ethanol<br />
Plant and a SPE controlled by Tractebel Energia, to generate energy for sale on the<br />
market.<br />
� The Consortium structure allows companies to contribute funds toward the Consortium<br />
objectives and in return receive their corresponding share of results.<br />
� This business model frees the Plant to focus on expanding and growing its core<br />
business while Tractebel Energia makes investments related to supplying the required<br />
energy.<br />
20
Features of the partnership in biomass<br />
Sugar and Ethanol<br />
Plant<br />
� Land<br />
� Water<br />
� O&M (routine)<br />
� Licences<br />
� Biomass<br />
� Electricity<br />
� Steam<br />
Consortium<br />
Cogeneration Plant<br />
21<br />
SPE controlled by<br />
Tractebel<br />
� Financing<br />
� Investment<br />
� Insurance<br />
� Authorizations<br />
� EPC<br />
� O&M (advance)<br />
� Electricity
Wind plants in operation<br />
1. Pedra do Sal WPP<br />
• Installed Capacity: 18 MW<br />
• 20 WTG Enercon E‐44 of 0.9 MW<br />
• PROINFA Contract<br />
• Contracted Energy: 52,360 MWh/year<br />
• Location: Parnaíba, state of Piauí<br />
• Tower height: 55m<br />
• Rotor diameter: 44 m<br />
• COD: ‐85% on 12/31/2008<br />
‐ 15% on 02/15/2008<br />
2. Beberibe WPP<br />
• Installed Capacity: 25.6 MW<br />
• 32 WTG Enercon E‐48 of 0.8 MW<br />
• PROINFA Contract<br />
• Contracted Energy: 73,574 MWh/year<br />
• Location: Beberibe, state of Ceará<br />
• Tower height: 75 m<br />
• Rotor diameter: 48 m<br />
• COD: 09/11/2008<br />
Hydro plants<br />
Thermo plants<br />
Complementary<br />
plants<br />
Under construction<br />
UEBB<br />
UEPS<br />
UEBB
Wind plants in operation<br />
Installed Capacity: 145.4 MW<br />
Energy for Sale: 74.67 average MW<br />
Capex value: R$ 641 million<br />
Equipment: 63 x Siemens SWT 2.3‐101<br />
Tower height: 80 m<br />
Rotor diameter: 101 m<br />
1. Trairí Complex<br />
Installed Capacity: 114,5 MW<br />
Wind turbines: 50<br />
Location: Trairí, state of Ceará<br />
•Mundaú Wind Farm (30 MW)<br />
• Guajirú Wind Farm (30 MW)<br />
• Trairi Wind Farm (25.4 MW)<br />
• Fleixeiras Wind Farm (30 MW)<br />
2. Porto do Delta Wind Farm<br />
Installed Capacity: 30 MW<br />
Wind turbines: 13<br />
Location: Parnaíba, state of Piauí<br />
PORTO DO DELTA WIND COMPLEX<br />
Installed capacity:<br />
Municipality:<br />
State:<br />
Installed capacity:<br />
Municipality:<br />
State:<br />
TRAIRI COMPLEX
Solar R&D project<br />
Photovoltaic solar plant (PV) of 3MW and assessment of the technical<br />
and economic performance of PV generation in different climatic<br />
conditions in the Brazilian energy matrix.<br />
Duration: 36 months TOTAL value: R$ 56,301,400<br />
Applicant Company: Tractebel Energia<br />
Cooperating Companies:<br />
1. Energética Barra Grande - BAESA<br />
2. Campos Novos Energia - ENERCAM<br />
3. Centrais Elétricas Cachoeira Dourada - CDSA (Endesa)<br />
4. Central Geradora Termoelétrica Fortaleza - CGTF (Endesa)<br />
5. Companhia Energética Rio das Antas - CERAN<br />
6. COPEL<br />
7. Foz do Chapecó - FCE<br />
8. Light SESA<br />
9. Light Energia<br />
10. CPFL Paulista<br />
11. CPFL Piratininga<br />
12. Rio Grande Energia - RGE<br />
24
Solar R&D project<br />
� To design, install, monitor and analyze the performance of 8 Assessment<br />
Modules (MA) with 7 PV technologies and solarimetric stations in 8 locations<br />
with different climates:<br />
1. Crystalline silicon with tracking (c‐Si)<br />
2. Crystalline silicon without tracking (c‐Si)<br />
3. Amorphous silicon (a‐Si)<br />
4. Microcrystalline silicon (a‐Si/mc‐Si)<br />
5. Cadmium Tellurate (CdTe)<br />
6. Diselenide of Copper, Indium and Gallium (CIGS)<br />
7. Photovoltaic concentrator with tracking<br />
25<br />
SOLAR RADIATION ON THE<br />
INCLINED PLANE, ANNUAL<br />
AVERAGE
26<br />
Carlos Gothe<br />
Business Development Manager<br />
Tel.: (+55) 48 3221-7072<br />
cgothe@tractebelenergia.com.br<br />
www.tractebelenergia.com.br