Satellite oceanography
Satellite oceanography
Satellite oceanography
- No tags were found...

You also want an ePaper? Increase the reach of your titles
YUMPU automatically turns print PDFs into web optimized ePapers that Google loves.
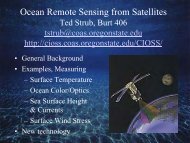
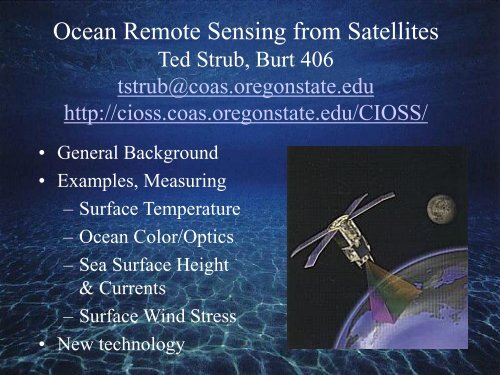
Ocean Remote Sensing from <strong>Satellite</strong>sTed Strub, Burt 406tstrub@coas.oregonstate.eduhttp://cioss.coas.oregonstate.edu/CIOSS/• General Background• Examples, Measuring– Surface Temperature– Ocean Color/Optics– Sea Surface Height& Currents– Surface Wind Stress• New technology
http://response.restoration.noaa.gov/Gulf Coast oil spill: <strong>Satellite</strong> “images” may “track” surface features: IR surfacetemperatures, visible features, …??? What can we really see?
Remote Sensing PioneersEarly Days 1888
Why <strong>Satellite</strong>s?• Oceans are vast, sparsely occupied – satellites provide uniformsampling, daily-to-monthly fields.• Ship time is expensive• <strong>Satellite</strong>s can acquire measurements quickly over large areasBUT…• Space: a harsh environment for acquiring measurements• Cost – <strong>Satellite</strong>s are also expensive, but “global” (international)• Risk – If satellites fail, service calls are even more expensive• Must measure through intervening atmosphere• Can‟t acquire sub-surface measurements• Can only measure a half-dozen variables, at the “surface” –• But: We can measure wind forcing and response
Ships take time to “map out” an area.The blue ship tracks take ~ 1-2 weeks in the case below. Patterns of cold water(whiter shades) and currents change in 4 days between images.
The temperature field constructed from ship observations (circles, belowright) over a 1-week period shows some of the features evident in theinstantaneous satellite image (below left), without the detailed filaments andswirls caused by jets and eddies in the currents, which the satellite fieldcaptures in a “snapshot” (clouds allowing?) (August, 2000).
Components of a passive “SST” remote sensing systemUsing IR or Microwave WavelengthsTwo types ofremote sensing:sensorPassivesignalraw datacalibration/validationprocessing /disseminationIR or μ-waveEmission
Components of an active radar “altimeter” systemFor sea level: Transmit at nadir (directly beneath satellite)Two types ofremote sensing:Activesource and sensorsignalraw datacalibration/validationμ-wave radarReflectionprocessing /dissemination
Orbits Determine SamplingGeostationary Orbit - GEO36,000km altitude (wide view)Stays over same locationCan document evolving systemsHigh temporal resolutionLower spatial resolution?Not necessarily – can “stare”for longer exposures.No polar coverage“Polar” Orbit (Low Earth Orbit LEO)850-1000 km altitudeTravels nearly over polesSees almost whole globeLower temporal resolutionHigher spatial resolution?Not necessarily – limited time overeach point.
Examples of several types of orbits.The Earth’s center of mass must be in the orbital plane – so Geostationary orbitsmust be in the Equatorial plane. Low Earth Orbits are inclined from theequatorial plane. Specialized orbits are used for different purposes.• Sun-synchronous orbits cross the equator at the same time each solar day.• Low inclination orbits are used to look more closely at tropical processes.• Exact-repeat orbits fill in a grid of orbit tracks over X days, then repeat exactly.
A Global System of Geosynchronous <strong>Satellite</strong>sGeostationary Sampling: Easy to picture – a sequence ofimages/fields from a fixed viewing geometry. Five satellites coverthe globe, maintained by nations that need the data. The first“weather satellites” were essentially TV cameras in space. For thefirst time, we could see distant storms developing andapproaching. The very first satellites carried film cameras andwere not looking at weather. How did the film get to earth?
Low Earth Orbits (“Polar Orbiting”): The orbital plane of thesatellite remains fairly constant while the earth rotates toward the east.Subsurface tracks migrate to the west, ~ 25º longitude (2750 km).
What SeaWiFS (visible) sees in one day:Swaths leave gaps at low latitudes:Clouds cover >50% of the ocean and obscurevisible and IR radiation.
“Space Junk”1958-200850 Years of Orbital Trash“Who you gonna call?”WALL-E
Space Debris
Space Debris
Space Debris
Space Debris
Space Debris
Space Debris
Specific ExamplesSea Surface Temperature (SST)Perhaps the most „standard‟ measurement from satellitesPassive meaurement. Traditionally used infrared (IR) emission- strong signal, obscured by cloudsMore recently using Microwave- can see through clouds, but the signal is weak- microwave also provides other data such as wind speed,water vapor, rain, iceTemperature is important because of its relationship to the heatbudget (global warming) and because it‟s diagnostic ofcurrents, upwelling etc…
Components of a passive “SST” remote sensing systemUsing IR or Microwave Wavelengthssensorsignalraw datacalibration/validationprocessing /disseminationIR or μ-waveEmission
Why Use Microwave?Clouds!Two-days of InfraredTwo-days of Microwave
Surface Temperature: 1 kmIR SST: 26 Sept. 1998Bathymetry
Passive measurementSpecific ExamplesOcean color (chlorophyll)Measures light scattered and transmitted upward through theocean surface - its „color‟ (careful to distinguish between„transmission‟ and „reflection‟)PROBLEM: Most of the signal (>90%) at the satellite is NOTocean color – It is atmospheric interference: sunlight that hasbeen scattered or reflected by molecules or aerosols in theatmosphere back into the satellite‟s field-of-view.
Components of a passive “ocean color” remote sensing systemUsing Visible wavelengthssourcesensorsignalraw datacalibration/validationAbsorption and scatteringof visible light – dependson pigments in the waterThe “color” is thewavelength that isnot absorbed!processing /dissemination
Surface Temperature and Chlorophyll: 1 kmSST: 26 Sept. 1998BathymetryChl-a Pigment:26-27 Sept. 1998
Specific ExamplesSea Surface Height (SSH)Active measurement using microwave radarPulse sent from satellite to earth, measure return timeWith appropriate processing and averaging, it is possibleto calculate:• Ocean currents, eddies (scales > 60-100 km)• Deviations in ocean surface due to bathymetry• Gradual sea level rise due to global warming• Deviations in ocean surface due to internal physicalvariability (heat, salinity)
Components of an active radar “altimeter” systemFor sea level: Transmit at nadir (directly beneath satellite)source and sensorsignalraw dataprocessing /disseminationcalibration/validation
Active Radar – Altimeter: Measures SSH ?what is that?=SSH dSSH=
Surface Height, Temperature and Chlorophyll: 1 kmSST: 26 Sept. 1998SSH: 2 AltimetersSept. 1998Chl-a Pigment:26-27 Sept. 1998
Specific ExamplesWind & Wind Stress (“tau” - τ)Active measurement, using microwave radar to get “vectorwinds” – speed and direction.• Pulse sent from satellite to ocean surface, then scattereddepending on surface roughness• Surface roughness (capillary waves) depends on windstress• Strength of return to satellite gives wind stress anddirection
Components of an active radar “scatterometer” systemFor wind: Transmit at an anglesource and sensorsignalraw datacalibration/validationprocessing /dissemination
QuikSCAT Science:Ocean CirculationQuikSCAT’s high resolution, extensive, andfrequent wind velocity measurements areused to understand upper ocean circulationfrom regional to global scales• Wind stress is the largest momentuminput to the upper ocean• Wind stress curl drives large-scalesurface currents• Small-scale wind variability modifieslarge-scale ocean circulation• Coastal regions exhibit amplifiedphysical/biological response• Wind forcing complements dynamicand thermodynamic responsemeasurements
Altimeter and Scatterometer
Ocean Eddies as Habitat for Marine Mammals, Turtles, …
Altimeter Estimates ofGlobal Sea Level Rise:This signal (the rise) is due to two effects:1) Thermal expansion as the water heats;2) Increased volume of water as the glacialice melts.
Animations of Ocean Sea Surface Heights:• “3-Pacific_SSH_1993-2011.mpg” This animation from NASA of seasurface height (SSH) in the Pacific from 1993-2010 shows theeastward movement of high SSH along the equator during the onsetof El Niño conditions (1997-98, 2006, 2009) and the westwardmovement of eddies nearly everywhere else.The animations described below may be available from Dudley Chelton(dchelton@coas.oregonstate.edu)• An eddy next to California traps a subsurface float and carries it withthe eddy as it moves to the west. Passive plankton ecosystems arealso carried in this same fashion.• Eddies in the global ocean are everywhere, mostly moving from eastto west, unless they are caught in a current moving more quickly tothe east.
Computer Models of 3-D Currents and Temperature:Fishermen at Coos Bay use these fields to direct cruises8-day composites of GOES SST (right) and MODIS chlorophyll (left) over radarsurface velocities during the period leading up to the forecast. (Middle) 2-dayforecast SST and surface velocity (without data assimilation).
Computer Models of 3-D Currents and TemperatureAlongtrack altimeter SSH data (dots) are used to “correct” themodel. GOES satellite SST is used to verify the improvement of themodel SST fields.prior (free-run) modelSSTmodel SST after SSHassimilationGOES daily SST (7/20/08),independent of model.48
Future Technologies“Next generation” satellite sensors are being developed by NASA and NOAA.• “Swath altimeters” will provide higher resolution SSH fields, closer to thecoast.• “Interferometer” scatterometers will provide higher resolution wind fields,closer to the coast.• “Hyper-spectral” ocean color sensors will sample the full visible radiationspectrum, allowing the identification of different types of phytoplankton,including those responsible for “harmful algal blooms” that close regions tothe harvest of shellfish. These will also have higher resolution to retrievedata farther up into rivers and estuaries.• SST sensors will combine the IR and Microwave channels to provide allweatherSST fields with higher resolution.• These satellite data and in-water data from subsurface “observatories” willbe “assimilated” into 3-D models of the ocean‟s circulation to providepredictions of currents, temperatures, oxygen (to warn of “dead zones”).Need more skilled people to analyze data from these systems!!
SummaryOceanography has traditionally faced a sampling limitation.<strong>Satellite</strong>s allow us to observe large areas quickly, but:Only see the ocean surface;Careful data calibration required for long term data sets.Parameters include: SST, Surface Height, Winds, Ice, Chlorophyll,Fluorescence (Productivity).In the Atmosphere: Profiles: Temperature, Water Vapor, Rain, Ozone, CO 2 .Recent Advances: Salinity (this year), Wind and Height data closer to thecoast and higher resolution; All-Weather SST; Hyperspectral dataNew technologies collect subsurface data in the water – gliders, AUV.Smaller and more power efficient sensors, more chemistry, more biology.Computer models use all of these to predict accurate currents andtemperaturesNeed skilled people to analyze data and advance the science!!
Web SitesOSU/COAS: Cooperative Institute for Oceanographic <strong>Satellite</strong> Studieshttp://cioss.coas.oregonstate.edu/CIOSS/OSU/COAS/Ocean Optics/Color:http://picasso.coas.oregonstate.edu/ORSOO/NOAA Global Sea Level Rise: http://ibis.grdl.noaa.gov/SAT/slr/U. Wisconsin Madison: Coop. Institute for Meteorological <strong>Satellite</strong> Studieshttp://cimss.ssec.wisc.edu/Jet Propulsion Laboratory (JPL/NASA) Physical Oceanography Data Centerhttp://podaac.jpl.nasa.gov/NOAA <strong>Satellite</strong> Research & West Coast <strong>Satellite</strong> Data: “CoastWatch”http://www.star.nesdis.noaa.gov/star/ &http://coastwatch.pfel.noaa.gov/NASA Goddard Science Center – <strong>Satellite</strong> Data and Info & Ocean Colorhttp://disc.sci.gsfc.nasa.gov/ & http://oceancolor.gsfc.nasa.gov/NASA Tutorial: http://rst.gsfc.nasa.gov/Front/overview.html
The End