Perceptions and Expenditure Patterns - Social Policy Research ...
Perceptions and Expenditure Patterns - Social Policy Research ...
Perceptions and Expenditure Patterns - Social Policy Research ...

Create successful ePaper yourself
Turn your PDF publications into a flip-book with our unique Google optimized e-Paper software.
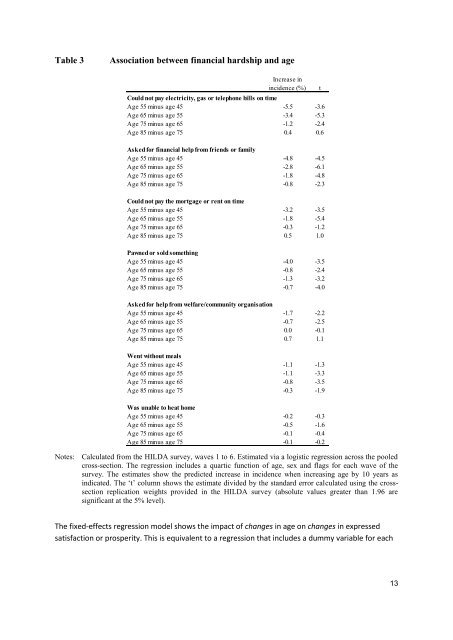
Table 3Association between financial hardship <strong>and</strong> ageIncrease inincidence (%)Could not pay electricity, gas or telephone bills on timeAge 55 minus age 45 -5.5 -3.6Age 65 minus age 55 -3.4 -5.3Age 75 minus age 65 -1.2 -2.4Age 85 minus age 75 0.4 0.6Asked for financial help from friends or familyAge 55 minus age 45 -4.8 -4.5Age 65 minus age 55 -2.8 -6.1Age 75 minus age 65 -1.8 -4.8Age 85 minus age 75 -0.8 -2.3Could not pay the mortgage or rent on timeAge 55 minus age 45 -3.2 -3.5Age 65 minus age 55 -1.8 -5.4Age 75 minus age 65 -0.3 -1.2Age 85 minus age 75 0.5 1.0Pawned or sold somethingAge 55 minus age 45 -4.0 -3.5Age 65 minus age 55 -0.8 -2.4Age 75 minus age 65 -1.3 -3.2Age 85 minus age 75 -0.7 -4.0Asked for help from welfare/community organisationAge 55 minus age 45 -1.7 -2.2Age 65 minus age 55 -0.7 -2.5Age 75 minus age 65 0.0 -0.1Age 85 minus age 75 0.7 1.1Went without mealsAge 55 minus age 45 -1.1 -1.3Age 65 minus age 55 -1.1 -3.3Age 75 minus age 65 -0.8 -3.5Age 85 minus age 75 -0.3 -1.9Was unable to heat homeAge 55 minus age 45 -0.2 -0.3Age 65 minus age 55 -0.5 -1.6Age 75 minus age 65 -0.1 -0.4Age 85 minus age 75 -0.1 -0.2Notes: Calculated from the HILDA survey, waves 1 to 6. Estimated via a logistic regression across the pooledcross-section. The regression includes a quartic function of age, sex <strong>and</strong> flags for each wave of thesurvey. The estimates show the predicted increase in incidence when increasing age by 10 years asindicated. The ‘t’ column shows the estimate divided by the st<strong>and</strong>ard error calculated using the crosssectionreplication weights provided in the HILDA survey (absolute values greater than 1.96 aresignificant at the 5% level).tThe fixed-effects regression model shows the impact of changes in age on changes in expressedsatisfaction or prosperity. This is equivalent to a regression that includes a dummy variable for each13