Download Environmental Report PDF - Maersk Drilling
Download Environmental Report PDF - Maersk Drilling
Download Environmental Report PDF - Maersk Drilling
- No tags were found...

Create successful ePaper yourself
Turn your PDF publications into a flip-book with our unique Google optimized e-Paper software.
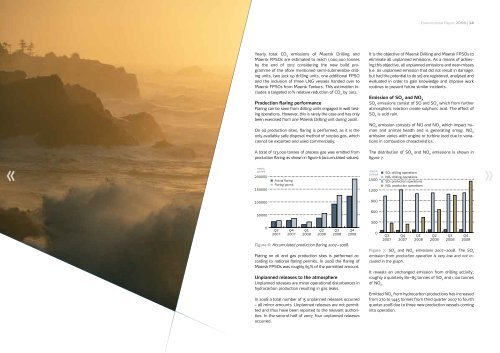
Yearly total CO 2emissions of <strong>Maersk</strong> <strong>Drilling</strong> and<strong>Maersk</strong> FPSOs are estimated to reach 1,000,000 tonnesby the end of 2012 considering the new build programmeof the afore mentioned semi-submersible drillingunits, two jack up drilling units, one additional FPSOand the inclusion of three LNG vessels handed over to<strong>Maersk</strong> FPSOs from <strong>Maersk</strong> Tankers. This estimation includesa targeted 10 % relative reduction of CO 2by 2012.Production flaring performanceFlaring can be seen from drilling units engaged in well testingoperations. However, this is rarely the case and has onlybeen exercised from one <strong>Maersk</strong> <strong>Drilling</strong> unit during 2008.On oil production sites, flaring is performed, as it is theonly available safe disposal method of surplus gas, whichcannot be exported and used commercially.It is the objective of <strong>Maersk</strong> <strong>Drilling</strong> and <strong>Maersk</strong> FPSOs toeliminate all unplanned emissions. As a means of achievingthis objective, all unplanned emissions and near-misses(i.e. an unplanned emission that did not result in damage,but had the potential to do so) are registered, analysed andevaluated in order to gain knowledge and improve workroutines to prevent future similar incidents.Emission of SO Xand NO XSO Xemissions consist of SO and SO 2which from furtheratmospheric reaction create sulphuric acid. The effect ofSO Xis acid rain.NO Xemission consists of NO and NO 2which impact humanand animal health and is generating smog. NO Xemission varies with engine or turbine load due to variationsin combustion characteristics.A total of 123,000 tonnes of process gas was emitted fromproduction flaring as shown in figure 6 (accumulated values).The distribution of SO Xand NO Xemissions is shown infigure 7.metrictonnes200000Actual flaringFlaring permitmetrictonnes1500SOx drilling operationsNOx drilling operationsSOx production operationsNOx production operations1500001200100000900500006003000Q32007Q42007Q12008Q22008Q32008Q420080Q32007Q42007Q12008Q22008Q32008Q42008Figure 6: Accumulated production flaring 2007 – 2008.Flaring on oil and gas production sites is performed accordingto national flaring permits. In 2008 the flaring of<strong>Maersk</strong> FPSOs was roughly 65 % of the permitted amount.Unplanned releases to the atmosphereUnplanned releases are minor operational disturbances inhydrocarbon production resulting in gas leaks.In 2008 a total number of 15 unplanned releases occurred– all minor amounts. Unplanned releases are not permittedand thus have been reported to the relevant authorities.In the second half of 2007, four unplanned releasesoccurred.Figure 7: SO Xand NO Xemissions 2007 – 2008. The SO Xemission from production operation is very low and not includedin the graph.It reveals an unchanged emission from drilling activity;roughly a quarterly 80 – 85 tonnes of SO Xand 1,100 tonnesof NO X.Emitted NO Xfrom hydrocarbon productions has increasedfrom 270 to 1445 tonnes from third quarter 2007 to fourthquarter 2008 due to three new production vessels cominginto operation.