Download Environmental Report PDF - Maersk Drilling
Download Environmental Report PDF - Maersk Drilling
Download Environmental Report PDF - Maersk Drilling
- No tags were found...
Create successful ePaper yourself
Turn your PDF publications into a flip-book with our unique Google optimized e-Paper software.
Index0304050607081011121518202122PrefaceScope of reportA message from Claus V. Hemmingsen<strong>Maersk</strong> <strong>Drilling</strong> and <strong>Maersk</strong> FPSOs environmental policy<strong>Environmental</strong> legislationPursuing environmental efficiency<strong>Environmental</strong> performance 2008Impact on the environment caused by offshore activitiesAtmospheric emissionsPlanned and unplanned dischargesWaste generationResource consumptionStrategy and objectives for 2009 – 2013Conclusion 2008
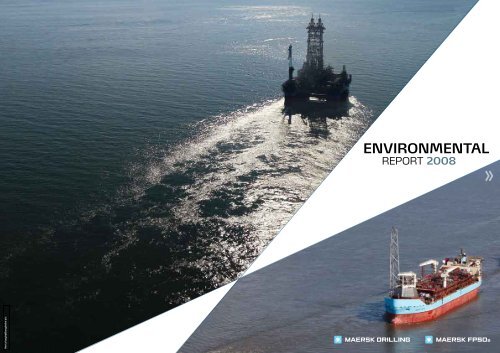
PrefaceThis environmental report 2008 covers two of the businessunits within the A. P. Moller – <strong>Maersk</strong> Group :<strong>Maersk</strong> <strong>Drilling</strong> and <strong>Maersk</strong> FPSOs.<strong>Maersk</strong> <strong>Drilling</strong> and <strong>Maersk</strong> FPSOs are engaged in theoil and gas industry providing worldwide offshore drillingand production services.In December 2008 <strong>Maersk</strong> <strong>Drilling</strong> operated a fleet of 25mobile offshore drilling units (MODU) including a combineddrilling and production unit in the North Sea, while<strong>Maersk</strong> FPSOs operated five mobile vessels for floatingproduction, storage and offloading services.As part of the modernisation and growth of the fleet, anextensive new building programme was initiated in 2005and further expanded during 2006 – 2007. In 2008, oneFPSO and three jack-up drilling units were commissionedfor operation. Two older jack-up rigs left the fleet, leaving<strong>Maersk</strong> <strong>Drilling</strong> with one of the youngest and most modernfleet in the industry. Furthermore, the reconstructionof a drilling unit to combine both drilling and productionwas completed in 2008.During 2009 two deepwater semi-submersible drillingunits and one jack up drilling unit are to be delivered foroperation, while in 2010 one FPSO and one deepwatersemi-submersible drilling unit are to be delivered.Second corporate environmental report – 2008This report covering 2008 is the second annual environmentalreport for <strong>Maersk</strong> <strong>Drilling</strong> and <strong>Maersk</strong> FPSOs.The 2007 report covered Q3 and Q4 only.This 2008 report:• Highlights environmental performance data• Identifies areas where changes have taken place comparedto 2007 and• Identifies potential areas for improvementIndustry practiceAs general practice within the offshore drilling industry,the legal environmental requirements are divided betweencontractors and operators which to a great extentinfluences the way operation is conducted. Therefore,the environmental performance of <strong>Maersk</strong> <strong>Drilling</strong> and<strong>Maersk</strong> FPSOs is dependent on close cooperation withthe operators.Compliance with environmental regulations and requirementsare divided between contractual requirements andgeneral maritime environmental regulations.The general maritime regulations primarily focus on compliancewith the MARPOL Convention dealing with oilywater and sewage discharges, waste management andatmospheric emission control.In the North Sea, drilling and production related dischargesare regulated through the North East Atlantic OSPARConvention.<strong>Drilling</strong> or production related discharges to the marineenvironment take place in accordance with governmentlicensed discharge permits which are always owned bythe operator. As a general rule, fuel oil, drilling fluids andproduction chemicals are provided by the operator for aparticular operation, providing the contractor with thefoundation to comply with the discharge permit.Shipment of waste products to shore for final treatmentand disposal is managed in accordance with contractualrequirements stipulated by the operator in order to meetlocal landfill capacities and opportunities for recycling ofwaste products.
Scope of reportAs per A. P. Moller – <strong>Maersk</strong> Group requirements, environmentalperformance data is reported for all assetsunder direct operational control to the business unit regardlessof ownership.This report presents the environmental operational datareported by the organisation covering the areas of:• Greenhouse gas emissions and flaring performance• SO X, NO Xand other operational emissions• Accidental and controlled discharges tothe marine environment• Waste generation and recycling of waste products• Resource consumptionThe data has been compiled based on reports from thefollowing operational areas:<strong>Maersk</strong> <strong>Drilling</strong>• North Sea drilling operations from Denmark and Norway• Caspian Sea drilling operations from Azerbaijan• America drilling operations from Venezuela andTrinidad & Tobago• Middle East drilling operations fromthe United Arab Emirates• South East Asian drilling operations from Brunei• Australian drilling operations from Western Australia<strong>Maersk</strong> FPSOs• North Sea floating hydrocarbon production fromthe UK and Norway• Australian floating hydrocarbon production fromWestern AustraliaExcluded in the scope of reportingExempt from this report is environmental performancedata originating from assets or construction work :• Egyptian <strong>Drilling</strong> Company – joint venture operationwith Egyptian General Petroleum Corporation• Mobile offshore drilling unit <strong>Maersk</strong> Endurer– on bareboat charter to EDC• FGSO NKOSSA II – technical management outsourcedto A. P. Moller – <strong>Maersk</strong> Technical Organisation• Continuous new building construction worksin SingaporePrinciples of reportingThe data in the report is extracted from <strong>Maersk</strong> <strong>Drilling</strong>and <strong>Maersk</strong> FPSOs’ global environmental performancemonitoring programme and incidents registered in thecompanies’ reporting system, Synergi.The global environmental performance monitoring programmewas initiated in 2007 in order to consolidate keyenvironmental performance data corresponding to theimpacts caused by operations. The programme also providesbaseline data for the future measurement of improvementsof environmental performance.The programme consists of widespread data collectionand quarterly reports submitted by each operationalarea.<strong>Environmental</strong> data presented in this report has beenaligned with the ‘Oil and Gas Industry Guidance for VoluntarySustainability <strong>Report</strong>ing’ by the International PetroleumIndustry <strong>Environmental</strong> Conservation Association(IPIECA) and the American Petroleum Institute (API).Since the system for collecting data is still being developed,uncertainty may occur. Through improved data collectionuncertainty will be reduced over the next years.
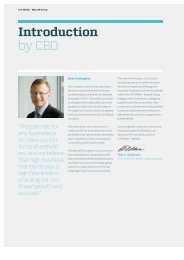
Claus V. HemmingsenCEO, <strong>Maersk</strong> <strong>Drilling</strong>Partner & Member of the Group Executive Board,A. P. Moller – <strong>Maersk</strong> A/S(<strong>Maersk</strong> <strong>Drilling</strong>, <strong>Maersk</strong> Supply Service,<strong>Maersk</strong> FPSOs, Svitzer and <strong>Maersk</strong> LNG)A message fromCLaus V. Hemmingsen<strong>Environmental</strong>ly sustainable performance is becomingmore important to us than ever. Reducing our environmentalfootprint has become part of our overall strategy.In 2008, the A. P. Moller – <strong>Maersk</strong> Group launched its firstever Eco-Efficiency strategy. The strategy, which coversa general commitment to performance beyond compliance,is primarily focusing on reducing energy consumptionand green house gas emissions.In <strong>Maersk</strong> <strong>Drilling</strong> and <strong>Maersk</strong> FPSOs we are fully engagedin implementing this strategy to improve our environmentalperformance, Three central elements haveour full attention; equipment & technology, managementsystems and culture.Blow out and spill prevention measures have been implementedin the industry for many years and maintenanceprograms become ever more advanced to ensure the integrityof our equipment. In addition, energy efficiency ofpumps and machinery etc. is constantly being improved.Due to these initiatives, CO 2and other emissions are beingreduced.Within the framework of the ‘Green Rig project’, equipmentand technology are being evaluated and promotedhelping improvement of design of new units as well asmodification of existing units.With regards to management and reporting, we are conductinga total revamp of our management system includingenvironmental management to focus our effortsin the most environmentally beneficial areas. Our environmentalmanagement system is developed and maintainedin compliance with our ISO 14001 certification.<strong>Environmental</strong> culture and awareness is one of our keyfocus areas. Without awareness we can not succeed.Through education and campaigns we are striving tobuild a strong and proactive environmental culture.Going forward, I am confident that over the next coupleof years we will see an environmental culture that willmatch our high level of the existing safety culture.But it does not stop there. In order for us to succeed weneed to work closely with the oil companies. We have acommon interest in protecting the environment, and thiscalls for further cooperation, better knowledge sharingincluding knowing each others requirements and capabilitieswill enable us to find environmentally friendly andsustainable solutions together.It is our ambition to prepare for the future by increasingour technical capabilities and by continuously training andeducating our employees – in order for us to improve ourenvironmental performance thus supporting the sustainablegrowth of our company.
<strong>Maersk</strong> <strong>Drilling</strong>and <strong>Maersk</strong> FPSOsenvironmental policy<strong>Maersk</strong> <strong>Drilling</strong> and <strong>Maersk</strong> FPSOs’ environmental policylays down the fundamental principles regulating the environmentalperformance of all our organisational unitsregardless of activity or geographical location.These principles provide a general outline for the activitiesof the various organisational units, which adapt themto their own particular situation being either oil exploratorydrilling activities, floating production or offshore relatedservice activities.• While maintaining safety integrity, compliance with applicablelegislation and class requirements, as well asthose stipulated by clients, will be upheld. Guidelinesissued by associations in which <strong>Maersk</strong> <strong>Drilling</strong> and<strong>Maersk</strong> FPSOs maintain memberships shall be followed.• <strong>Environmental</strong> protection concerns shall be incorporatedinto all stages of activities. This includes the design andconstruction of new buildings and modifications of units,during operational or demobilisation activities.• The organisational units shall continuously seek to reducethe environmental impacts of the specific operationsthrough emphasising pollution prevention and implementingmeasures for mitigating consequences ofaccidental pollution. The best-available-technology principlewill be used when found economically viable.• It shall be ensured that all employees and contractedstaff are aware of their duty to act responsibly on environmentalissues and are sufficiently trained and competentto meet the requirements of the environmentalmanagement system.• <strong>Report</strong>ing of environmental incidents shall be donethrough formalised channels ensuring that communicationto parties involved are made and appropriate remedialactions initiated.• Verification of the implementation of the environmentalmanagement system as well the adherence to establishedenvironmental management programmes shallbe performed through frequent inspections and audits.
<strong>Environmental</strong> legislationMobile offshore drilling units (MODU) and FPSO vesselsare subject to the regulations of the continental shelf (i.e.the extended perimeter of each continent and associatedcoastal plain) authorities for activities associated with explorationof oil and gas. FPSO vessels and self propelledMODUs are, however, also ships and the principal environmentallegislation applicable to <strong>Maersk</strong> <strong>Drilling</strong> and<strong>Maersk</strong> FPSOs in this context is the International Conventionfor the Prevention of Pollution from Ships; widelyknown as the MARPOL Convention under the InternationalMaritime Organization (IMO). Many continental shelfAuthority regulations refer to MARPOL Annex II and VI.MARPOL Annex VIThe adopted amendments to the MARPOL Annex VIregulations are expected to be entered into force in 2010in the North Sea, the Baltic and North America are expectedto adopt them in 2010.NO Xemissions will be further reduced by introduction ofmulti-tier design criteria.Ship recyclingThe Ship Recycling Convention provides regulations fordesign, construction, operation and preparation for therecycling of ships. It serves to facilitate safe and environmentallysound recycling, without compromising thesafety and operational efficiency of ships, to ensure forthe operation of ship recycling facilities in a safe and environmentallysound manner and establish an appropriateenforcement mechanism for ship recycling, incorporatingcertification and reporting requirements. The conventionis pending ratification by member states before it can enterinto force.Ballast water conventionRegardless of the BWM Convention which is not yet ratified,the self-propelled mobile offshore units in the fleethave been equipped with ballast water managementplans approved by the vessel classification society.Anti fouling systemsOn 17 September 2008 IMO's International Anti-FoulingSystems Convention was ratified, putting a global banon the use of TBT based anti-fouling paint systems (i.e.system based on tributylin oxide).
Green rig what?Our operationshave an impactinput- Fuel oil- Lube oil- Water / air- Ballast water- Paints- Mud- Brine- Food / paper- Spare parts- BariteGreen rig how?You can makea difference!outputVisual impactNoiseEmissions to air:- CO2- SOx- NOx- VOC- Particulate mattersReleases to water:- Grey water- Bilge water- Ballast water- Toxic substances- Accidental discharges- Sewage- CuttingsDischarges to land:- Garbage- Sludge- Hazardous waste- Scrap spare parts- <strong>Drilling</strong> fluids- Cuttings1. Switch off electronic devices when they are not used2. Switch off the light when you leave a room3. Take short showers4. Turn off water tap while you brush your teeth5. Reuse your towel6. Print with care7. Consider risk of spills to environment when you do a job8. Consider risk of gas leaks when you do a job9. Separate waste according to the setup on your unit10. Keep spill prevention in placePursuing environmental efficiency<strong>Maersk</strong> <strong>Drilling</strong> and <strong>Maersk</strong> FPSOs offshore operationgoes beyond compliance in regards to local and internationalrules and regulation and to requirements fromclients. <strong>Environmental</strong> efficiency is pursued by:• A systematic approach to identify potential for moreefficient use of resources, lower emissions and optimisationof cost• Proactive mitigation of environmental risk• Anticipation of regulatory changes as well as customerand competitor strategy<strong>Environmental</strong> improvement is part of the companystrategy and built into the management system. A comprehensiveenvironmental programme covering ‘eco-efficiency’focusing on atmospheric emissions, discharges tothe marine environment, waste management, chemicalmanagement, tools and reporting, training of personneland formalised monitoring of environmental incidents toinitiate necessary preventative action has been setup.The programme forms the baseline for our initiatives toreduce the total impact on the environment from offshoreoperations. <strong>Maersk</strong> <strong>Drilling</strong> and <strong>Maersk</strong> FPSOseco-efficiency and objectives for 2009 – 2013 can be foundin the conclusion on page 21.In this section of the report you can read more aboutsome of the ongoing environmental initiatives.savings and emissions, but the project also includeddischarges, accidental spills and waste management.• A systematic identification, assessment and evaluationof all relevant environmental improvement opportunitiesthroughout the entire drilling fleet will be part ofthe project.• A Green Rig campaign has been developed and will belaunched in 2009.• Different software solutions are presently being evaluatedwith the purpose to implement a ‘decision tool’looking into risk, cost and environmental advantage.Together with an environmental key performance program,it sets the base for choosing the right improvements.• <strong>Maersk</strong> <strong>Drilling</strong> seeks to engage in cooperation with oilcompanies regarding environmental improvements.In 2010, a Green FPSO project similar to the current GreenRig project will be initiated. Improvements initiatives followingthe two projects will be the main driver in the ecoefficiencystrategy in the years to come.<strong>Maersk</strong> <strong>Drilling</strong> and <strong>Maersk</strong> FPSOs’ objective is to reducethe relative amount of CO 2emissions according to thefollowing plan:2009 2010 2011 2012Green rig why?We share theresponsibilityGlobal warmingOzone depletionImpact on human healthAir pollution (smog and acid rain)BiodiversityMarine pollutionOcean acidificationResource useGreen Rigcampaign postersEco-efficiency – main focus areas in 2008For <strong>Maersk</strong> <strong>Drilling</strong>, the Green Rig project was the mostimportant initiative in 2008, supporting eco-efficiencywhile a green Methanol project was the focus for<strong>Maersk</strong> FPSOs.Green Rig projectThe project was launched with the purpose of reducingthe environmental impact from the fleet, including newbuildings,and to increase employee awareness in the environmentalprogress of <strong>Maersk</strong> <strong>Drilling</strong>.• The project took place as an interdisciplinary assignmentwithin the organisation focusing mainly on energy0 % 2 % 5 % 10 %Green Methanol projectOn the <strong>Maersk</strong> FPSOs side, a Green Methanol projectwas investigated in 2008, by evaluating gas-to-liquid(GTL) technologies. With <strong>Maersk</strong> LNG joining <strong>Maersk</strong>FPSOs this has opened further possibilities.• The project includes evaluation of producing methanoloffshore based on a flaring from the oil and gas productionand thereby reducing CO 2and other emissions relatedto oil production. The methanol project continuesto be developed within <strong>Maersk</strong> FPSOs.
Global chemical management system<strong>Maersk</strong> <strong>Drilling</strong> and <strong>Maersk</strong> FPSOs' goal is to improvechemical management and to limit both the use of environmentallyharmful chemicals in operation, and thedischarge of chemicals into the sea.• In 2007 a new chemical management system was initiated,both to ensure compliance with to national dischargepermits and OSPAR regulations and to improveperformance throughout the operations.• In 2008 registration and evaluation of currently usedchemicals was initiated. The registration includes essentialchemical information, global legal compliancechecks and relevant documentation such as MaterialSafety Data Sheets. Furthermore, chemical workinginstructions can be created from the system in five differentlanguages.• Registration of all chemicals used in the Danish andNorwegian sector has been initiated and the informationwill be available to all units and local shorebases supportingimprovement across the entire organisation.• Chemicals discharged into the sea are colour coded accordingto the guidelines of the OSPAR Commission(see table below). <strong>Maersk</strong> <strong>Drilling</strong> and <strong>Maersk</strong> FPSOs’goal is to establish global substitution programmes forblack and red chemical products.• The goal for 2009 is to register black and red dischargechemicals onboard the units on the Danish and Norwegiancontinental shelf and to prepare a substitution plan.The long term goal is zero black and red chemical discharges– only yellow and green wherever <strong>Maersk</strong> <strong>Drilling</strong>and <strong>Maersk</strong> FPSOs operate.New management system with focuson environmental performanceA revamp of the <strong>Maersk</strong> <strong>Drilling</strong> and <strong>Maersk</strong> FPSOs paperbased management system was initiated in 2007 tocreate a simpler, transparent, user-friendly and flexiblesystem. All environmental processes, the environmentalpolicy and key applications have been revised accordingly.The new process based management system,SIRIUS, will support the environmental performance andimprovement.<strong>Environmental</strong> improvement in the headquartersIn the autumn of 2008 an improvement project for theestablishment of waste paper recycling in the corporateHQ covering shared premises with <strong>Maersk</strong> <strong>Drilling</strong>,<strong>Maersk</strong> FPSOs and <strong>Maersk</strong> Supply Services was established.It is recognised, that compared to the offshore environmentalimpact the potential onshore improvement mayseem marginal, however, for environmental awarenessonshore the project is deemed highly important consideringthe political signal of involving approximately 400employees directly in an environmental improvementproject. The project will be launched in February 2009with a three month test period ending in April.Increase environmental awareness throughcampaigns and training programmesAn environmental awareness training programme wasdeveloped in 2008 as part of a total HSE & Security trainingpackage. The programmes were in use on all newunits (six in all) as e-learning and class room training.Our objectives for 2009 and the years forward are tolaunch environmental awareness campaigns in connectionwith Green Rig and Green FPSO projects.Colour codes for chemicalsBlack chemicals are the most environmentally damagingamong chemicals used in the offshore industry.Red chemicals give cause for concern as they containseveral environmentally harming properties.Yellow chemicals have only one environmentallyharming property.Green chemicals either do not contain any environmentallydamaging properties, or they contain propertieswhich have only minimal impact on the environment.
<strong>Environmental</strong>performance 2008The environmental performance of <strong>Maersk</strong> <strong>Drilling</strong> and<strong>Maersk</strong> FPSOs can be seen in this section providing datafrom 2008. The focus areas are:• Atmospheric emissions• Planned and un-planned discharges• Waste generation• Resource consumptionRead more about these four areas on page 12, 15, 18 and 20.The data will be reviewed and compared to data from thesecond half of 2007 in order to assess the environmentalperformance of 2008.Key Performance Indicators (KPIs)The international offshore oil and gas industries generallylack greenhouse gas KPIs to evaluate and measure theimpact on the environment over time.The International Association of <strong>Drilling</strong> Contractors (IADC)is investigating how to set up relevant and valid KPIs thatcan be agreed upon across the drilling industry.In 2007 <strong>Maersk</strong> <strong>Drilling</strong> introduced the concept of CO 2emissions measured per kilometre of drilled well in theenvironmental report, while in this report CO 2emission ismeasured per man hour. Both measures have proved tobe fluctuating but still give an indication of development.<strong>Maersk</strong> <strong>Drilling</strong> puts continuous effort into establishing reliableand valid environmental KPIs for drilling operation.In <strong>Maersk</strong> FPSOs CO 2emissions related to the productionactivities are measured in comparison to productivityi.e. produced oil equivalents.
Impact on the environment causedby offshore activitiesAtmospheric emissionsPrimary gas released into the atmosphere include carbondioxide (CO 2), methane (CH4), sulphur oxides (SO X),nitrogen oxides (NO X) and volatile organic compound(VOC).Carbon dioxide and methane are green house gassesleading affecting global warming, SO Xcreates acid rain,while NO Xhas a negative effect on health.Among these gasses, CO 2is the one with highest influencedue to a high volume of emission. The other gassesare considered less significant in relation to the drillingand gas and oil production due to low volumes of emissions.Gas emissions are the result of onboard combustion offuel for power production or flaring of excess gas.<strong>Drilling</strong> units consume marine diesel oil for the main enginesdriving the power generators and, to a lower extent,diesel driven deck cranes and well cementing units.Production units consume marine diesel and during peakperiods additional power generation from diesel drivengenerators. However, the main contributor is turbinesfuelled by gas for powering up the hydrocarbon productionplant.As with flaring from drilling operations, the flaring fromproduction is managed in accordance with the operator’sflaring permit.DischargesDischarges of effluents originate in drilling operationsas well as oil and gas production. The main substanceto be discharged into the sea is produced water, whichis a bi-product from the processing of hydrocarbon condensate.<strong>Maersk</strong> <strong>Drilling</strong> has some drilling operations where drillcuttings are processed and mixed with waste drilling fluidsand re-injected into the formation (rock in the undergroundsurrounding the borehole). The process is knownas ‘slurry reinjection’ and enables a drilling operation tominimise the discharge.Other aqueous drill cuttings are discharged to the sea –depending on the chemical composition of the drill fluid.Prior to the discharge, the cuttings will undergo a processof cleaning and drying out the cuttings.All offshore units produce other discharges that originatefrom disposal of sanitary water (sewage), bilge waterfrom engine room compartments and deck bilge.Chemicals are used offshore for various purposes mainlyin drilling mud and for processing reservoir fluids. Theuse and discharge of chemicals are performed under thecustomer’s discharge permit, as it is for produced waterand drill cutting discharges.Waste generationRegardless of type of operation, a large variety of wasteproducts are generated and segregated on board for furtheronshore treatment and disposal. In some areas recyclingis performed.Main waste products are drilling waste (non fluid cuttings),household waste, scrap metals, electrical waste,packing materials and chemical waste (paints, oils productionand drilling chemicals) which are normally managedin accordance with contractual requirements stipulatedby the operator.Aqueous drill cuttings are discharged to the sea or reinjectedinto the formation, while non-fluid drill cuttingare shipped to shore for further treatment and disposal.This is normally the responsibility of the operator. In certainareas the cuttings are further crushed and treated onboard and re-injected back into the reservoir.Resource consumption<strong>Maersk</strong> <strong>Drilling</strong> and <strong>Maersk</strong> FPSOs depend on fossilfuels to power the drilling operations and hydrocarbonproduction. Fresh water and drill water (used for onboardmixing of drilling fluid) are other vital resources, however,in most operations this is water produced onboard bymeans of water makers. Poor onshore water resourceswill thus not be affected in the first instance.
Atmospheric emissions<strong>Maersk</strong> <strong>Drilling</strong> and <strong>Maersk</strong> FPSOs collect data on emissionof three gasses: CO 2, NO Xand SO X. In the tablebelow can be seen the emission of these three gasses.The figure 1 shows the quarterly CO 2emission from drillingoperation in Q3 and Q 4 in 2007 and full 2008.Total atmospheric emissions<strong>Drilling</strong> operationsCO 2796,235 metric tonnesNO x7,986 metric tonnesSO x348 metric tonnesUnplanned releases 15Table 1: Total volume of atmospheric emissions andnumber of unplanned gas releases in 2008 covering both<strong>Maersk</strong> <strong>Drilling</strong> and <strong>Maersk</strong> FPSOs.The total increase in CO 2emission volume compared to2007 is approximately 500,000 metric tonnes.Q32007Q42007Q12008Q22008Q32008Q42008Figure 1: CO 2emission from drilling operation in 2007 and 2008.In figure 2 is shown CO 2emissions per million man hoursin drilling operation 2008.<strong>Drilling</strong> operationsmetric tonnes of CO ²per million man hour0Q32007Q42007Q12008Q22008Q32008Q42008Figure 2: CO 2emission measured per million man hours.<strong>Drilling</strong> operations benchmark a steady 33,000 metrictonnes of CO 2per million man hours throughout the period.
In figure 3 is shown the quarterly CO 2emission from productionoperation in Q 3 and Q4 2007 and 2008.metrictonnes250000200000Production operationsMeasuring total CO 2emission compared to productivity,the period has shown a relative improvement as seenin figure 4. The reduction of CO 2emission compared to2007 is roughly 30 % relative to produced tonnes of oilequivalents.200The percentage distribution of total CO 2emissions fromfuel usage and flaring on FPSOs and drilling units is illustratedin figure 5.150000100000500000Q32007Q42007Q12008Q22008Q32008Q42008Figure 3: CO 2emission from production operation in 2007and 2008.This increase has been caused mainly due to commissioningof two new production units (one FPSO and oneproduction module installed onboard a drilling unit) duringthe second half of 2008.kg of CO ²per produced tonnesof oil equivalent (toe)150100500Q32007Q42007Q12008Q22008Q32008Q42008Figure 4: CO 2Hydrocarbon production intensity for<strong>Maersk</strong> FPSOs 2007 – 2008. The fourth quarter of 2008 hasrecorded an 84 kg of emitted CO 2per produced tonnes of oilequivalent (toe).Fuel consumption – productionFlaring – productionFuel consumption – drillingFlaring – drillingFigure 5: Distribution of CO 2emissions from fuel usage andflaring. The volume of flaring in drilling operation was almostzero in 2008.Compared to 2007, the percentage of flaring in productionoperation has increased from 8 % to 36 % in 2008.
Yearly total CO 2emissions of <strong>Maersk</strong> <strong>Drilling</strong> and<strong>Maersk</strong> FPSOs are estimated to reach 1,000,000 tonnesby the end of 2012 considering the new build programmeof the afore mentioned semi-submersible drillingunits, two jack up drilling units, one additional FPSOand the inclusion of three LNG vessels handed over to<strong>Maersk</strong> FPSOs from <strong>Maersk</strong> Tankers. This estimation includesa targeted 10 % relative reduction of CO 2by 2012.Production flaring performanceFlaring can be seen from drilling units engaged in well testingoperations. However, this is rarely the case and has onlybeen exercised from one <strong>Maersk</strong> <strong>Drilling</strong> unit during 2008.On oil production sites, flaring is performed, as it is theonly available safe disposal method of surplus gas, whichcannot be exported and used commercially.It is the objective of <strong>Maersk</strong> <strong>Drilling</strong> and <strong>Maersk</strong> FPSOs toeliminate all unplanned emissions. As a means of achievingthis objective, all unplanned emissions and near-misses(i.e. an unplanned emission that did not result in damage,but had the potential to do so) are registered, analysed andevaluated in order to gain knowledge and improve workroutines to prevent future similar incidents.Emission of SO Xand NO XSO Xemissions consist of SO and SO 2which from furtheratmospheric reaction create sulphuric acid. The effect ofSO Xis acid rain.NO Xemission consists of NO and NO 2which impact humanand animal health and is generating smog. NO Xemission varies with engine or turbine load due to variationsin combustion characteristics.A total of 123,000 tonnes of process gas was emitted fromproduction flaring as shown in figure 6 (accumulated values).The distribution of SO Xand NO Xemissions is shown infigure 7.metrictonnes200000Actual flaringFlaring permitmetrictonnes1500SOx drilling operationsNOx drilling operationsSOx production operationsNOx production operations1500001200100000900500006003000Q32007Q42007Q12008Q22008Q32008Q420080Q32007Q42007Q12008Q22008Q32008Q42008Figure 6: Accumulated production flaring 2007 – 2008.Flaring on oil and gas production sites is performed accordingto national flaring permits. In 2008 the flaring of<strong>Maersk</strong> FPSOs was roughly 65 % of the permitted amount.Unplanned releases to the atmosphereUnplanned releases are minor operational disturbances inhydrocarbon production resulting in gas leaks.In 2008 a total number of 15 unplanned releases occurred– all minor amounts. Unplanned releases are not permittedand thus have been reported to the relevant authorities.In the second half of 2007, four unplanned releasesoccurred.Figure 7: SO Xand NO Xemissions 2007 – 2008. The SO Xemission from production operation is very low and not includedin the graph.It reveals an unchanged emission from drilling activity;roughly a quarterly 80 – 85 tonnes of SO Xand 1,100 tonnesof NO X.Emitted NO Xfrom hydrocarbon productions has increasedfrom 270 to 1445 tonnes from third quarter 2007 to fourthquarter 2008 due to three new production vessels cominginto operation.
Planned and unplanned discharges<strong>Drilling</strong> and production activities create a variety of dischargesto the sea, mainly produced water containingoil, drill cuttings (formation of rock and soil) and chemicals.In general, discharges of all kinds are controlled and managedaccording to regulations and permits. However, dischargescan also result from unplanned events and resultin spills to the sea or the deck. Unplanned discharge tothe sea is not permitted and therefore reported to therelevant authorities.This report includes figures of produced water, drill cuttingsand accidental discharges of oily products andchemicals – see table 2.Total aqueous dischargesProduced water 1,592,638 m 3Drill cuttings 22,574 m 3Unplanned discharges 28 (122 m 3 )Table 2: Total amount of discharges including number of accidentalspills in 2008.Produced waterProduced water contains oily particles and some productionadditives. The water is subject to a purificationprocess prior to being discharged into the marine environment.All water discharges are monitored and theconcentration of oil in the produced water is measuredbefore discharge.Figure 8 shows the actual average oil content pertained in thedischarged produced water (after the purification) in 2008.oil content - mg/loil discharged - metric tonnes4035302520151050Actual oil contentOil content limitAccumulated oil dischargedQ32007Q42007Q12008Q22008Q32008Q42008Figure 8: Oil concentration (quarterly average, mg/l) in dischargedproduced water compared to permitted concentration and accumulateddischarged oil (kg). <strong>Maersk</strong> FPSOs 2007 – 2008.A seasonal fluctuation in oil content in discharged producedwater is seen and it is frequently experienced onfloating production units in harsh environments. Thisphenomenon is caused by vessel motion in rough autumnand winter seas that reduces the efficiency of the oil andwater separation processes.The significant increase of oil content in Q4 in 2008 wascaused due to a general increase in volume of producedwater on one of the units.An average of 15.4 mg oil per litre discharged producedwater was measured for 2008.Re-injection of produced waterAn alternative solution regarding produced water has beenintroduced recently in the industry: re-injection of producedwater back into the reservoir. This method is gaining widespreadapplication with new oil field developments andhas the further advantage of stabilising and optimising theoil field reservoir and production capacity. Re-injection ofproduced water is less harmful to the marine environmentthan discharge. However, there are also challenges relatedto this method and it is not applicable on all oil fields.
Currently, two production units in <strong>Maersk</strong> FPSOs operateusing this technique. A third unit is planned to convert tore-injection during 2009.Accidental dischargesAlthough every effort is made to prevent accidental discharges,incidents still happen. A formally approved OilSpill Contingency plan needs to be in place for each offshoreoperation, describing procedures in the event of aspill. Through continuous monitoring, adherence to proceduresand planning, <strong>Maersk</strong> <strong>Drilling</strong> and <strong>Maersk</strong> FPSOsseek to keep unplanned discharges to a minimum – strivingto reach the target of zero spills zero spills.In figure 9 the numbers of spills in 2007 – 2008 is seen.76543210Oil & Fuel spills<strong>Drilling</strong> fluid spillsChemical / Other spillsQ32007Q42007Q12008Q22008Q32008Q42008Figure 9: Number of accidental spills to the sea 2007 – 2008distributed among oil & fuel spills, drilling fluid spills andchemical/other spills.Three major accidental spills occurred in late 2008 on twodrilling rigs. These spills account for the major part of thetotal amount of discharges. Out of the total spillage, 86 %consist of seawater spillage from mud pits and thus witha low environmental impact. For details see figure 10.litres10000080000600004000020000Oil & Fuel<strong>Drilling</strong> fluidChemicalsThe total number of spills in 2008 was 28 with a total volumeof 122m3. In the second half of 2007 10 spills occurred.0Q32007Q42007Q12008Q22008Q32008Q42008Figure 10: Quantity and content of accidental discharges in2007 – 2008.The objectives for 2008 were to reduce accidental spillsby 20 % compared to 2007. This target has not beenreached due to these three major spills.
The objective for 2009 is to reduce accidental spills by atleast 20 per cent compared to 2008, while the long termgoal is to reach zero spills.The primary causes of spills to the sea during 2008 areshown in figure 11.Lack of planningImplementation of safty rulesand work permitLeadership and supervisionEducation and trainingDesign & engineering controlsOtherFigure 11: Distribution of six primary causes to the spills in 2008.The main reason for the spills in 2008 is within the category‘leadership and supervision’. Further examinationof the data shows that the most common denominator is‘human error’. However, ‘planning’ as cause has improvedfrom 61 % in 2007 to 12 % in 2008.A part from spills to the sea, unplanned spills to the deckand near miss spills are monitored as shown in figure 12.30252008200720151050Accidental spillsto seaAccidental spillsto deckNear-miss spillsFigure 12: Spills to sea, spills to deck and near miss spillscompared to normalised 2007(i.e. the actual numbers of spillsin the second half of 2007 has been multiplied by two).
Waste generationA large variety of waste products are generated and segregatedon board for further onshore treatment, recyclingand disposal.The transportation of waste and its treatment and disposalresult in environmental impacts, which vary in sizeand nature depending on the disposal method.Implementing waste segregation at the source optimisespotential recycling and minimises the environmental impactsfrom waste generation. Waste segregation is performedat all <strong>Maersk</strong> <strong>Drilling</strong> and <strong>Maersk</strong> FPSOs’ installationsaccording to requirements from the customer andlocal rules and regulations.Waste products are generally divided in the two categories:hazardous and non-hazardous. The reported hazardouswaste comprises materials such as chemical and oilywastes, batteries and fluorescent light tubes or any otherwaste material harmful to human health or the environment.Non-hazardous waste comprises wood, plastics,scrap metals, packing materials, paper and cardboardmaterials, clothing, electrical components and other nonharmfulmaterials.
In table 3 figures on general waste and recycling isshown.Drill cuttingsA special waste category is non-fluid drill cuttings.Total generated wasteHazardous waste materialsNon-hazardous waste materialsRecycled waste materials1406 metric tonnes2411 metric tonnes1555 metric tonnesIn 2008 <strong>Maersk</strong> activities produced total of approximately81,000 m3 of drill cuttings – both fluid and non-fluid. Infigure 14, the distribution of the total amount in regardsof disposal is shown.Recycling factor (yearly average) 29 %Table 3: total generated waste materials in 2008.The graph in figure 13 shows the quarterly distribution ofwaste products and the recycling factor.DischargeRe-injectionBack loadtonnes15001200HazardousNon-hazardousRecycledRecycling factor%5040Figure 14: Drill cuttings disposal distribution. Disposal methodschange due to operational terms with clients.90030In 2008 67 % of the drill cuttings were back loaded, whilein 2007 it was only 15 %.6003000Q32007Q42007Q12008Q22008Q32008Q4200820100This implies fuel consumption transport and further treatmentand disposal at shore. Therefore, back load is theleast environmentally friendly solution, even though theimpact is minor.Figure 13: distribution of waste generation 2007 – 2008.The period shows a moderately increasing recycling factorending at 33 % in the fourth quarter of 2008. Theyearly average has improved from 21 % in 2007 to 29 %in 2008.The volume of hazardous waste has decreased dramaticallysince Q3 2007 and has remained stable for 2008at a relatively low level, even with increasing productionlevels.It is noted that onboard segregation is undertaken inaccordance with client requirements which are tailoredfor local onshore recycling capacity and infrastructure.
Resource consumption<strong>Maersk</strong> <strong>Drilling</strong> and <strong>Maersk</strong> FPSOs depend on fossil fuelsfor powering drilling and hydrocarbon production.The gas used for power is produced offshore at the FPSOvessels. The same goes for the drill and fresh water,which is produced using water makers on board. Onshorewater resources will thus not be affected immediately.Principal resources in quantities are given in table 4.Total principal resourceDiesel oil74,010 metric tonnesFuel gas11,3890 metric tonnesOnshore activities<strong>Maersk</strong> <strong>Drilling</strong> and <strong>Maersk</strong> FPSOs operate local onshoreadministrations with warehouse facilities in all areas ofoperation. The primary environmental concern is the impactfrom electrical consumption, generated waste productsand water consumption.As some of <strong>Maersk</strong> <strong>Drilling</strong> and <strong>Maersk</strong> FPSOs officepremises are shared with other business entities and/or rented, it has not been possible to obtain valid datafrom all entities. Where data is missing local estimateshave been given to establish overall total consumption.Water *279,509 metric tonnesPrincipal impact in quantities is given in table 5.Table 4: Total principle resources in 2008.* Includes both household fresh water usage and raw water(drill water) for drilling fluid composition (approx. 42 % of totalconsumption).In figure 15 is shown the distribution of recourse usage.metrictonnes80000700006000050000400003000020000Diesel (<strong>Drilling</strong>)Diesel (Production)Fuel gas (Production)Water consumptionTotal principal onshoreElectrical consumption 3,796,900 kWh *Household waste products 161 metric tonnes **Water consumption 22,500 cubic metres ***Table 5: total principle onshore impact 2008.* Based on measured six offices/warehouses and four localestimates** Based on measured four offices/warehouses and six localestimates*** Based on measured two offices/warehouses and eightlocal estimatesThe electrical consumption roughly equals 875 metrictonnes of CO 2calculated based on local emission factorssupplied from the International Energy Agency (IEA).100000Q32007Q42007Q12008Q22008Q32008Q42008Figure 15: Distribution of resource usage 2007 – 2008.The period shows an increase in diesel and fuel gas consumptionfrom the newly commissioned hydrocarbonproduction units in the fourth quarter of 2008.
Strategy and objectivesfor 2009 – 2013<strong>Maersk</strong> <strong>Drilling</strong> and <strong>Maersk</strong> FPSOs’ goal is to continuouslyimprove the environmental performance with regardsto:• Emissions to the air• Unplanned spills into the sea and releases into the air• Chemical management• Waste generationThese focus areas are applicable for onshore premisesas well.To support a continuously environmental improvement astrategy has been established covering 2009 – 2013.Eco-efficiency strategy 2009 – 2013Metrics and targets• Comply with and go beyond legislative andregulative requirements including performancepermits owned by customers• Establish environmental KPIs and benchmarkingLeadership & commitment• Through management support, training andawareness campaigns promote an environmentalculture that match our current safety culture• Continuously improvement of the Green Rig andGreen FPSOs projects• Establish environmental group in all shorebases• Publish yearly sustainability report• Perform process excellence methods on relevantenvironmental processesStakeholder management• Establish partnerships with selected customersand other A. P. Moller – <strong>Maersk</strong> business units• Promote Green Rig and Green FPSO projectsthrough cooperation with selected customersMarketing & Communication• Initiate environmental campaign following samepatterns as safety campaigns• Yearly sustainability report• Increase media coverageTechnical Operation and innovation• Initiate green technologies and innovation basedon the Green Rig and Green FPSO projects• Continuously development of the Methanol project• Improvement projects following Green Rig andGreen FPSO projects<strong>Maersk</strong> <strong>Drilling</strong> and <strong>Maersk</strong> FPSOstarget for 2009 are:• Continued development of reporting systems,KPIs and the settingof new benchmarks where relevant• Continuous progress on the Green Rig project andcompletion of three concrete environmentalimprovements• ISO 14001 certification of <strong>Maersk</strong> <strong>Drilling</strong> in Venezuela• Implementation of the revamped businessmanagement system• Continuous implementation of chemical managementsystem globally and substitution of chemicalsThe target for 2009 is to substitute at least threeblack and red chemicals with yellow or green• Reduce spills with at least 20 % compared to2008 baseline figure striving for zero spills• Continuous progress regarding Methanol project andGreen FPSO project• Target for reduction of relative CO 2emission in 2009is zero, but the long term goal is to archive 10 %in 2012
Conclusion 2008A new environmental strategy was implemented inthe APMM Group as well as in <strong>Maersk</strong> <strong>Drilling</strong> and<strong>Maersk</strong> FPSOs during 2008. The strategy is based on ‘Eco-Efficiency’ and covers a general commitment to performancebeyond compliance. Part of the strategy is to reduceemissions and to limit the environmental footprint.A number of initiatives have been taken to support thenew strategy. The most important initiative is the GreenRig project. The Green Rig project covers systems, equipmentand awareness and contains a very systemic approachto environmental improvements rig by rig andsystem by system in <strong>Maersk</strong> <strong>Drilling</strong>. A number of improvementprojects, awareness campaigns and managementsystem improvements have been initiated underthe umbrella of the Green Rig project.The environmental management system in <strong>Maersk</strong> <strong>Drilling</strong>and <strong>Maersk</strong> FPSOs is being updated as part of a total revampof the overall QHSE management system and theISO 14001 certification is being maintained. The revampedmanagement system is expected to be more simple,transparent and user-friendly than the existing system.A new global environmental training program has beendeveloped focusing on new building crews.In 2008 the CO 2emissions were reduced by around 30 % relativeto produced tonnes of oil equivalents in <strong>Maersk</strong> FPSOs.In <strong>Maersk</strong> <strong>Drilling</strong> the CO 2emissions were steady comparedto 2007 relative to man-hours. The total emissions were increasedby half a million tonnes of CO 2due to the companygrowth and commissioning of new buildings.The objective in <strong>Maersk</strong> <strong>Drilling</strong> and <strong>Maersk</strong> FPSOs isto reach a relative reduction of CO 2emissions of 10 % by2012 compared to 2008 result.The recycling factor of waste has improved from 21 % in2007 to 29 % in 2008. Further improvement is expectedover the next years.Regarding discharges the volume of accidental spills increasedin 2008 mainly due to three bigger spills of drillfluid. Fortunately the environmental impact from thesehas been limited since the fluid mostly consists of water.It is the target of <strong>Maersk</strong> <strong>Drilling</strong> and <strong>Maersk</strong> FPSOs toreduce the number of accidental spills to zero.


