The record 19.1 million tonne <strong>AWB</strong> National Poolexport program severely tested the Australian grain<strong>supply</strong> <strong>chain</strong>.The large export program, coupled with an increase indemand from the mineral sector for rail assets, causeda marked reduction in the nation’s capacity to movegrain to port. To counter this, <strong>AWB</strong> implementedextensive asset utilisation planning and executionmanagement. This logistics program moved more than90% of the export task within nine months of harvest,setting grain movement and shipping records in theprocess.Sales exceeded the nominal capacity of the <strong>supply</strong><strong>chain</strong> for most of the year, but <strong>AWB</strong>’s logisticalmanagement ensured efficiency measures wereintroduced to maximise the tonnes shipped whileholding costs at appropriate levels for <strong>AWB</strong> NationalPool participants.In improving <strong>supply</strong> <strong>chain</strong> efficiency, <strong>AWB</strong> faces amajor challenge due to the poor state of much ofAustralia’s grain <strong>supply</strong> <strong>chain</strong> infrastructure. <strong>AWB</strong>is encouraging greater competition and investmentto counter the inefficiencies prevalent in thedomestic grain <strong>supply</strong> <strong>chain</strong>, and is also developinga <strong>supply</strong> <strong>chain</strong> optimisation strategy to best utiliseexisting assets.MANAGING SUPPLY CHAIN COSTSFor the 2003–04 <strong>AWB</strong> National Pool, real <strong>supply</strong> <strong>chain</strong>service provider charges (covering the transport, storageand handling, and port-related services that <strong>AWB</strong>negotiates on behalf of the Pool) were reduced for theseventh consecutive year.Growers paid an average (standardised) of $42.54 pertonne in site-to-sea <strong>supply</strong> <strong>chain</strong> costs, down from$43.32 the previous year. However, in terms of actualexpenditure, many growers would have experienced anincrease in costs due to continued nation-wide problemswith the congestion and degradation of the <strong>supply</strong> <strong>chain</strong>infrastructure.Critical to <strong>AWB</strong>’s achievements in cost reduction werenew contracts with transport service providers in thestates that enjoyed strong seasons – Western Australiaand South Australia. For example, <strong>AWB</strong> amended throughnegotiation the Western Australian rail contract in 2003–04, resulting in a better position for the <strong>AWB</strong> NationalPool. This renegotiation resulted in a 7.5% rail freightsaving for <strong>AWB</strong> National Pool participants and reducedthe Pool’s exposure to rail costs by $15 million a year.A new rail contract was also negotiated in South Australiawhich introduced a more cost-reflective site-based pricestructure for grain receival sites and in so doing reducingSouth Australian freight rates by 3%.A number of long-term road contracts were alsore-negotiated during 2003–04 with favourable outcomes,especially in the Albany region where rate reductions ofup to 10% were achieved at some sites.Despite these successes, some <strong>supply</strong> <strong>chain</strong> serviceproviders still do not have cost–reflective prices, that is,their charges do not differentiate between efficient assetsand those with high operating costs. This is true for bothup-country storages and ports, which distorts the pricingsignals to growers thereby increasing costs.Recognising the importance of having cost–reflectivecharging structures, <strong>AWB</strong> is continually striving to havebulk handling and rail companies reflect the actual costof providing a service at individual sites and ports.CREATING EFFICIENCIESTHROUGH PARTNERSHIPSThe 2003–04 Pool life saw further consolidation of theAustralian <strong>supply</strong> <strong>chain</strong> infrastructure. For example, CooperativeBulk Handling of Western Australia (CBH)merged with the Grain Pool of Western Australia andGrainCorp purchased the Queensland bulk handlerGrainCo. This has contributed to an environment whereservice providers have obtained even stronger bargainingpositions with grain producers and exporters.To meet this challenge and to drive improved assetutilisation, <strong>AWB</strong> has explored a number of joint ventureopportunities with <strong>supply</strong> <strong>chain</strong> service providers.After successful negotiations between <strong>AWB</strong> andGrainCorp, the two companies joined together to form‘Export Grain Logistics’, a joint venture designed toimprove coordination of the grain export task and toincrease efficiencies. The joint venture will manage theoperation of the export grain <strong>supply</strong> <strong>chain</strong> on behalf of<strong>AWB</strong> and GrainCorp in New South Wales, Queenslandand Victoria.It is expected that the joint venture will enable existinginfrastructure to be more efficient by improving railscheduling, whilst lowering vessel demurrage costs at19
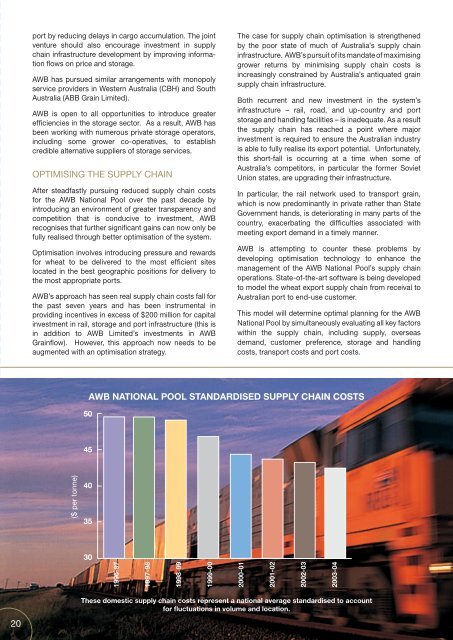
port by reducing delays in cargo accumulation. The jointventure should also encourage investment in <strong>supply</strong><strong>chain</strong> infrastructure development by improving informationflows on price and storage.<strong>AWB</strong> has pursued similar arrangements with monopolyservice providers in Western Australia (CBH) and SouthAustralia (ABB Grain <strong>Limited</strong>).<strong>AWB</strong> is open to all opportunities to introduce greaterefficiencies in the storage sector. As a result, <strong>AWB</strong> hasbeen working with numerous private storage operators,including some grower co-operatives, to establishcredible alternative suppliers of storage services.OPTIMISING THE SUPPLY CHAINAfter steadfastly pursuing reduced <strong>supply</strong> <strong>chain</strong> costsfor the <strong>AWB</strong> National Pool over the past decade byintroducing an environment of greater transparency andcompetition that is conducive to investment, <strong>AWB</strong>recognises that further significant gains can now only befully realised through better optimisation of the system.Optimisation involves introducing pressure and rewardsfor wheat to be delivered to the most effi cient siteslocated in the best geographic positions for delivery tothe most appropriate ports.<strong>AWB</strong>’s approach has seen real <strong>supply</strong> <strong>chain</strong> costs fall forthe past seven years and has been instrumental inproviding incentives in excess of $200 million for capitalinvestment in rail, storage and port infrastructure (this isin addition to <strong>AWB</strong> <strong>Limited</strong>’s investments in <strong>AWB</strong>Grainflow). However, this approach now needs to beaugmented with an optimisation strategy.The case for <strong>supply</strong> <strong>chain</strong> optimisation is strengthenedby the poor state of much of Australia’s <strong>supply</strong> <strong>chain</strong>infrastructure. <strong>AWB</strong>’s pursuit of its mandate of maximisinggrower returns by minimising <strong>supply</strong> <strong>chain</strong> costs isincreasingly constrained by Australia’s antiquated grain<strong>supply</strong> <strong>chain</strong> infrastructure.Both recurrent and new investment in the system’sinfrastructure – rail, road, and up-country and portstorage and handling facilities – is inadequate. As a resultthe <strong>supply</strong> <strong>chain</strong> has reached a point where majorinvestment is required to ensure the Australian industryis able to fully realise its export potential. Unfortunately,this short-fall is occurring at a time when some ofAustralia’s competitors, in particular the former SovietUnion states, are upgrading their infrastructure.In particular, the rail network used to transport grain,which is now predominantly in private rather than StateGovernment hands, is deteriorating in many parts of thecountry, exacerbating the difficulties associated withmeeting export demand in a timely manner.<strong>AWB</strong> is attempting to counter these problems bydeveloping optimisation technology to enhance themanagement of the <strong>AWB</strong> National Pool’s <strong>supply</strong> <strong>chain</strong>operations. State-of-the-art software is being developedto model the wheat export <strong>supply</strong> <strong>chain</strong> from receival toAustralian port to end-use customer.This model will determine optimal planning for the <strong>AWB</strong>National Pool by simultaneously evaluating all key factorswithin the <strong>supply</strong> <strong>chain</strong>, including <strong>supply</strong>, overseasdemand, customer preference, storage and handlingcosts, transport costs and port costs.50<strong>AWB</strong> NATIONAL POOL STANDARDISED SUPPLY CHAIN COSTS45($ per tonne)4035301996-971997-981998-991999-002000-012001-022002-032003-0420These domestic <strong>supply</strong> <strong>chain</strong> costs represent a national average standardised to accountfor fluctuations in volume and location.