
You also want an ePaper? Increase the reach of your titles
YUMPU automatically turns print PDFs into web optimized ePapers that Google loves.
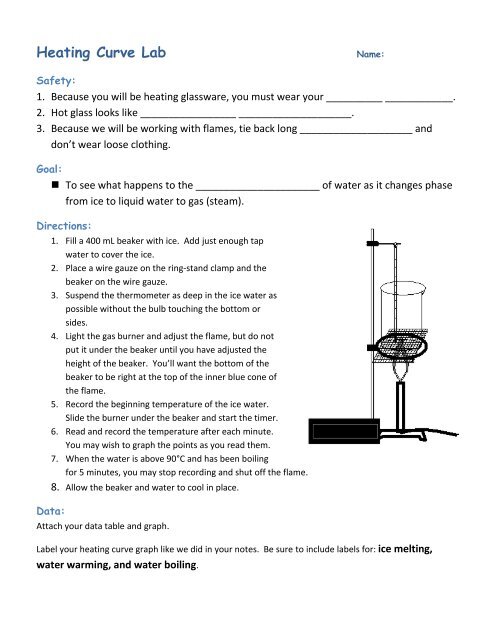
<strong>Heating</strong> <strong>Curve</strong> <strong>Lab</strong>Name:Safety:1. Because you will be heating glassware, you must wear your __________ ____________.2. Hot glass looks like _________________ ____________________.3. Because we will be working with flames, tie back long ____________________ anddon’t wear loose clothing.Goal:• To see what happens to the ______________________ of water as it changes phasefrom ice to liquid water to gas (steam).Directions:1. Fill a 400 mL beaker with ice. Add just enough tapwater to cover the ice.2. Place a wire gauze on the ring-stand clamp and thebeaker on the wire gauze.3. Suspend the thermometer as deep in the ice water aspossible without the bulb touching the bottom orsides.4. Light the gas burner and adjust the flame, but do notput it under the beaker until you have adjusted theheight of the beaker. You’ll want the bottom of thebeaker to be right at the top of the inner blue cone ofthe flame.5. Record the beginning temperature of the ice water.Slide the burner under the beaker and start the timer.6. Read and record the temperature after each minute.You may wish to graph the points as you read them.7. When the water is above 90°C and has been boilingfor 5 minutes, you may stop recording and shut off the flame.8. Allow the beaker and water to cool in place.Data:Attach your data table and graph.<strong>Lab</strong>el your heating curve graph like we did in your notes. Be sure to include labels for: ice melting,water warming, and water boiling.
Temperature (degrees Celsius)Conclusions:1. What temperature did your ice melt at? Explain how you know.2. What temperature did your water boil at? Explain how you know.3. Were the phase changes you observed today exothermic or endothermic and why?4. If you were adding thermal energy the whole time, why did you have periods where yourtemperature did not change much? (What was the thermal energy doing during those timeperiods?)<strong>Heating</strong> <strong>Curve</strong> of Lauric Acid905. Look at this graph of a waxy materialcalled Lauric Acid. At what temperaturedoes Lauric acid change from a solid to aliquid? ____________ Describe whyyou chose this temperature from thegraph.807060504030201000 5 10 15 20 25 30<strong>Heating</strong> Time (minutes)