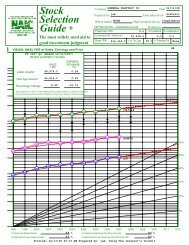
Stock Selection Guide - Stockherd
Stock Selection Guide - Stockherd
Stock Selection Guide - Stockherd

Create successful ePaper yourself
Turn your PDF publications into a flip-book with our unique Google optimized e-Paper software.
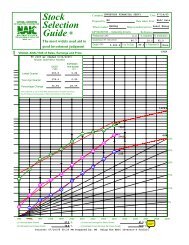
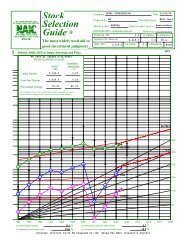
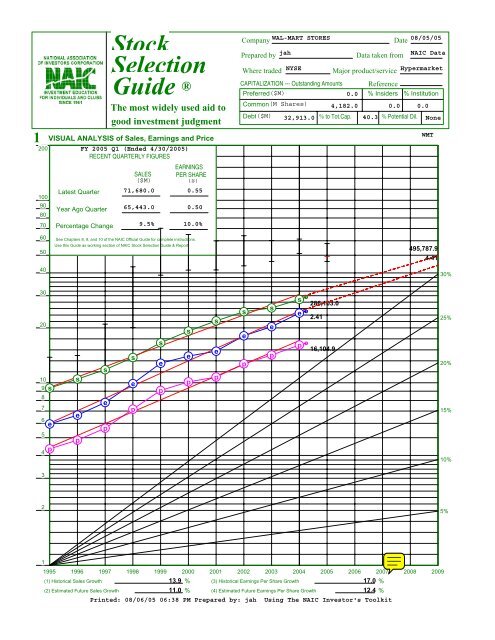
1VISUAL ANALYSIS of Sales, Earnings and Price200FY 2005 Q1 (Ended 4/30/2005)RECENT QUARTERLY FIGURES100908070605040Latest QuarterYear Ago QuarterPercentage Change<strong>Stock</strong><strong>Selection</strong><strong>Guide</strong> ®The most widely used aid togood investment judgmentEARNINGSSALES PER SHARE($M) ($)71,680.0 0.5565,443.0 0.509.5% 10.0%See Chapters 8, 9, and 10 of the NAIC Official <strong>Guide</strong> for complete instructions.Use this <strong>Guide</strong> as working section of NAIC <strong>Stock</strong> <strong>Selection</strong> <strong>Guide</strong> & Report.CompanyWAL-MART STORES Date 08/05/05Prepared by jahData taken from NAIC DataWhere tradedNYSEMajor product/serviceHypermarketCAPITALIZATION --- Outstanding Amounts ReferencePreferred($M)0.0 % Insiders % InstitutionCommon(M Shares) 4,182.0 0.0 0.0Debt($M) 32,913.0 % to Tot.Cap. 40.3 % Potential Dil. NoneWMT495,787.94.4130%3020109 s876e54 psepsepsepsepsepsepsepsepsep286,103.02.4116,104.925%20%15%10%325%11995 1996 1997 1998 1999 2000 2001 2002 2003 2004 2005 2006 2007 2008 2009(1) Historical Sales Growth(2) Estimated Future Sales Growth13.9 %11.0 %(3) Historical Earnings Per Share Growth(4) Estimated Future Earnings Per Share Growth17.0 %12.4 %Printed: 08/06/05 06:38 PM Prepared by: jah Using The NAIC Investor's Toolkit
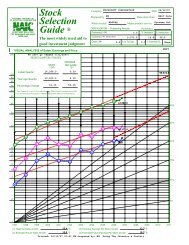
23234574165ABEVALUATING MANAGEMENT% Pre-tax Profit on Sales(Net Before Taxes ÷ Sales)% Earned on Equity(E/S ÷ Book Value)PRICE-EARNINGS HISTORY as an indicator of the futureThis shows how stock prices have fluctuated with earnings and dividends. It is a building block for translating earnings into future stock prices.PRESENT PRICE 49.320 HIGH THIS YEAR 57.890 46.2008 AVERAGE PRICE EARNINGS RATIO 26.4 9 CURRENT PRICE EARNINGS RATIO20.0Proj. P/E [17.84] Based on Next 4 qtr. EPS [2.76]Current P/E Based on Last 4 qtr. EPS [2.46]EVALUATING RISK and REWARD over the next 5 yearsPEG=162A HIGH PRICE -- NEXT 5 YEARSAvg. High P/E 30.1 25.3 X Estimate High Earnings/Share4.41 = Forecast High Price $111.6(3D7 as adj.)(4A1)B LOW PRICE -- NEXT 5 YEARS(a) Avg. Low P/E 22.7 17.5 X Estimated Low Earnings/Share 2.41 2.46 = $43.1(3E7 as adj.)(b) Avg. Low Price of Last 5 Years =44.8(3B7)(c) Recent Severe Market Low Price =46.2Present Divd. =0.600=59.0(d) Price Dividend Will SupportHigh Yield (H)0.010Selected Estimate Low Price= $ 43.1(4B1)C ZONING111.6 High Forecast Price Minus 43.1 Low Forecast Price Equals 68.5 Range. 1/3 of Range = 17.1(4A1)(4B1)(C)(4CD)(4C2) Lower 1/3 = (4B1) 43.1 to60.2(Buy) Note: Ranges changed to 25%/50%/25%(4C3) Middle 1/3 =60.2 to94.5(Maybe)(4C4) Upper 1/3 =94.5 to 111.6 (4A1) (Sell)Present Market Price of 49.320 is in the BuyRange(4C5)D UP-SIDE DOWN-SIDE RATIO (Potential Gain vs. Risk of Loss)High Price (4A1) 111.6 Minus Present Price 49.320=62.3 = 10.0Present Price 49.320 Minus Low Price (4B1) 43.1 6.2(4D)E PRICE TARGET (Note: This shows the potential market price appreciation over the next five years in simple interest terms.)High Price (4A1) 111.6= ( 2.263 ) X 100 = ( 226.3 ) - 100 = 126.3 % AppreciationPresent Market Price 49.320(4E)Relative Value: 75.8% Proj. Relative Value: 67.6%This combines price appreciation with dividend yield to get an estimate of total return. It provides a standard for comparing income and growth stocks.5-YEAR POTENTIALA Present Full Year's Dividend $Present Price of <strong>Stock</strong>1995$4.618.519964.617.719974.818.9Company=19985.220.919995.522.10.012 X 100 = 1.2(5A)LOW THIS YEARFGDividend % PayoutPerShare F ÷ C X 100YearABCDEPRICEEarningsPrice Earnings RatioPerHIGHLOWHIGHLOWShareA ÷ CB ÷ C2000 64.9 41.4 1.40 46.4 29.6 0.240 17.1 0.62001 60.0 41.5 1.49 40.3 27.9 0.280 18.8 0.72002 63.9 43.7 1.81 35.3 24.1 0.300 16.6 0.72003 60.2 46.3 2.03 29.7 22.8 0.360 17.7 0.82004 61.3 51.1 2.41 25.4 21.2 0.520 21.6 1.0TOTAL224.0 90.4 68.1 91.8AVERAGE44.8 30.1 22.7 18.4Present Yield or % Returned on Purchase PriceH% High YieldF ÷ B X 100B AVERAGE YIELD OVER NEXT 5 YEARSAvg. Earnings Per Share Next 5 Years 3.49 X Avg. % Payout (3G7) 18.4 = 64.2 = 1.3 %(5B)Present Price $ 49.320C ESTIMATED AVERAGE ANNUAL RETURN OVER NEXT FIVE YEARS5 Year Appreciation Potential (4E) 126.3P.A.R. Tot. Ret.525.3Average Yield 0.9% 0.7%%Average Yield (5B)Annual Appreciation 13.9% 17.7%1.3 %Average Total Annual Return Over the Next 5 Years(5C)26.6% Compd Ann Rate of Ret 14.7% 18.5%%© 1996. National Association of Investors Corporation; 711 West Thirteen Mile Road, Madison Hgts., Michigan 48071WAL-MART STORES (WMT) 08/05/05LAST 5YEAR AVG.Assuming one recession and one business boom every 5 years, calculations are made of how high and how low the stock might sell. The upside-downside ratio is the key to evaluating risk and reward.0.60049.32020005.320.020014.918.920025.220.220035.520.120045.620.7Note: Results are expressed as a simple rate; use the table below to convert to a compound rate.UP5.3 EVEN20.0 UPPrinted: 08/06/05 06:38 PM Prepared by: jah Using The NAIC Investor's ToolkitTRENDTo 1DOWN
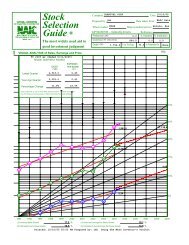
Trailing 4 quartersPERT Worksheet-A GraphCompany WAL-MART STORES (WMT)29.6%12.4%11.0%e e epepeeppppssepsspeeeeesees sseepep psp p p e pseesppps sp s ssss ppsesssppseespss% % % % % % % % % % % % % % % % % e % % % % % % % % % % % % %e epp22.2%14.8%7.4%0.0%4th 1st 2nd 3rd 4th 1st 2nd 3rd 4th 1st 2nd 3rd 4th 1st 2nd 3rd 4th 1st 2nd 3rd 4th 1st 2nd 3rd 4th 1st 2nd 3rd 4th 1st1997199819981998199819991999199919992000200020002000200120012001200120022002200220022003200320032003200420042004200420050.0%Printed: 08/06/05 06:38 PM Prepared by: jah Using The NAIC Investor's Toolkit