
You also want an ePaper? Increase the reach of your titles
YUMPU automatically turns print PDFs into web optimized ePapers that Google loves.
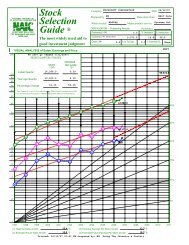
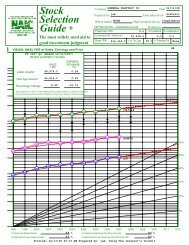
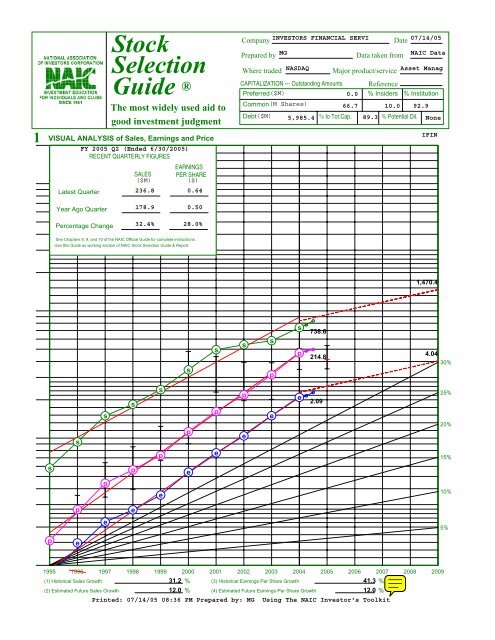
23234574165ABEVALUATING MANAGEMENT% Pre-tax Profit on Sales(Net Before Taxes ÷ Sales)% Earned on Equity(E/S ÷ Book Value)PRICE-EARNINGS HISTORY as an indicator of the futureThis shows how stock prices have fluctuated with earnings <strong>and</strong> dividends. It is a building block for translating earnings into future stock prices.PRESENT PRICE 41.520 HIGH THIS YEAR 53.440 35.0008 AVERAGE PRICE EARNINGS RATIO 22.8 9 CURRENT PRICE EARNINGS RATIO18.1Proj. P/E [16.19] Based on Next 4 qtr. EPS [2.56]Current P/E Based on Last 4 qtr. EPS [2.29]EVALUATING RISK <strong>and</strong> REWARD over the next 5 yearsPEG=151A HIGH PRICE -- NEXT 5 YEARSAvg. High P/E 29.4 22.0 X Estimate High Earnings/Share4.04 = Forecast High Price $88.9(3D7 as adj.)(4A1)B LOW PRICE -- NEXT 5 YEARS(a) Avg. Low P/E 16.3 16.6 X Estimated Low Earnings/Share 2.09 2.15 = $35.7(3E7 as adj.)(b) Avg. Low Price of Last 5 Years =21.7(3B7)(c) Recent Severe Market Low Price =20.2Present Divd. =0.080=24.0(d) Price Dividend Will SupportHigh Yield (H)0.003Selected Estimate Low Price= $ 35.0(4B1)C ZONING88.9 High Forecast Price Minus 35.0 Low Forecast Price Equals 53.9 Range. 1/3 of Range = 13.5(4A1)(4B1)(C)(4CD)(4C2) Lower 1/3 = (4B1) 35.0 to48.5(Buy) Note: Ranges changed to 25%/50%/25%(4C3) Middle 1/3 =48.5 to75.4(Maybe)(4C4) Upper 1/3 =75.4 to88.9 (4A1) (Sell)Present Market Price of 41.520 is in the BuyRange(4C5)D UP-SIDE DOWN-SIDE RATIO (Potential Gain vs. Risk of Loss)High Price (4A1) 88.9 Minus Present Price 41.520=47.4 =7.3Present Price 41.520 Minus Low Price (4B1) 35.0 6.5(4D)E PRICE TARGET (Note: This shows the potential market price appreciation over the next five years in simple interest terms.)High Price (4A1) 88.9= ( 2.141 ) X 100 = ( 214.1 ) - 100 = 114.1 % AppreciationPresent Market Price 41.520(4E)Relative Value: 79.4% Proj. Relative Value: 71.0%This combines price appreciation with dividend yield to get an estimate of total return. It provides a st<strong>and</strong>ard for comparing income <strong>and</strong> growth stocks.5-YEAR POTENTIALA Present Full Year's Dividend $Present Price of Stock199512.424.3$199613.512.5199713.615.1Company=199814.116.6199914.015.20.002 X 100 = 0.2(5A)LOW THIS YEARFGDividend % PayoutPerShare F ÷ C X 100YearABCDEPRICEEarningsPrice Earnings RatioPerHIGHLOWHIGHLOWShareA ÷ CB ÷ C2000 48.0 9.0 0.54 88.9 16.7 0.030 5.6 0.32001 43.8 23.0 0.77 57.3 30.1 0.040 5.2 0.22002 39.4 19.7 1.04 37.9 18.9 0.050 4.8 0.32003 39.1 20.2 1.50 26.1 13.5 0.060 4.0 0.32004 50.4 34.7 2.09 24.1 16.6 0.070 3.3 0.2TOTAL86.9 88.1 49.0 22.9AVERAGE21.7 29.4 16.3 4.6Present Yield or % Returned on Purchase PriceH% High YieldF ÷ B X 100B AVERAGE YIELD OVER NEXT 5 YEARSAvg. Earnings Per Share Next 5 Years 3.22 X Avg. % Payout (3G7) 4.6 = 14.8 = 0.4 %(5B)Present Price $ 41.520C ESTIMATED AVERAGE ANNUAL RETURN OVER NEXT FIVE YEARS5 Year Appreciation Potential (4E) 114.1P.A.R. Tot. Ret.522.8Average Yield 0.2% 0.2%%Average Yield (5B)Annual Appreciation 13.4% 16.4%0.4 %Average Total Annual Return Over the Next 5 Years(5C)23.2% Compd Ann Rate of Ret 13.7% 16.7%%© 1996. National Association of Investors Corporation; 711 West Thirteen Mile Road, Madison Hgts., Michigan 48071INVESTORS FINANCIAL SERVI (IFIN) 07/14/05LAST 5YEAR AVG.Assuming one recession <strong>and</strong> one business boom every 5 years, calculations are made of how high <strong>and</strong> how low the stock might sell. The upside-downside ratio is the key to evaluating risk <strong>and</strong> reward.0.08041.520200015.118.1200115.114.3200218.615.2200324.918.2200429.119.5Note: Results are expressed as a simple rate; use the table below to convert to a compound rate.UP20.5 UP17.0 UPPrinted: 07/14/05 08:36 PM Prepared by: MG Using The NAIC Investor's ToolkitTRENDTo 1DOWN
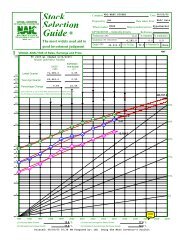
RECENTINVESTORS FIN’L SVCS NDQ--IFIN 42.32 19.7 1.02 0.2%PRICETRAILINGP/E RATIORELATIVEP/E RATIODIV’DYLDBETA 1.55RANKSPERFORMANCETechnicalSAFETY1 Highest3 Average3 Average(1.00 = Market)LEGENDS12 Mos Mov Avg.... Rel Price Strength2-for-1 split 3/992-for-1 split 6/002-for-1 split 6/02Shaded area indicates recessionVALUELINE3.55 6.41 8.55 12.36 48.00 43.81 39.41 39.09 50.40 53.44 High2.56 3.44 3.94 6.69 9.03 23.00 19.66 20.18 34.68 40.80 Low5025Financial StrengthPrice Stability 30B1510Price Growth Persistence 100Earnings Predictability 80© VALUE LINE PUBLISHING, INC. 1996 1997 1998 1999 2000 2001 2002 2003 2004 2005/2006EARNINGS PER SH .15 .22 .27 .36 .54 .77 1.04 1.39 2.09 2.56 A,B /3.03 CDIV’DS DECL’D PER SH .00 .01 .02 .02 .03 .04 .05 .06 .07BOOK VALUE PER SH 1.20 1.45 1.64 2.34 2.99 5.36 6.84 8.26 10.71COMMON SHS OUTST’G (MILL) 51.55 51.78 53.74 58.44 59.83 63.94 64.78 65.41 66.52AVG ANN’L P/E RATIO 19.4 22.7 23.6 25.1 41.7 43.9 31.6 21.0 20.4 16.5/14.0RELATIVE P/E RATIO 1.22 1.31 1.23 1.43 2.71 2.25 1.73 1.20 1.09AVG ANN’L DIV’D YIELD .1% .2% .2% .2% .1% .1% .2% .2% .2%TOTAL ASSETS ($MILL) 964.5 1459.3 1465.5 2553.1 3811.1 5298.6 7214.8 9223.2 11168 Bold figuresLOANS ($MILL) 66.2 55.9 54.3 109.3 129.3 232.1 143.7 199.5 134.5 are consensusNET INTEREST INC ($MILL) 18.0 26.2 26.7 35.8 58.8 109.3 143.5 153.9 187.7 earningsLOAN LOSS PROV’N ($MILL) .1 -- -- -- -- -- -- -- -- estimatesNONINTEREST INC ($MILL) 56.6 76.8 98.9 133.8 162.0 243.3 294.1 336.2 425.5 <strong>and</strong>, using theNONINTEREST EXP ($MILL) 61.9 82.7 99.6 135.8 169.0 278.0 336.7 344.9 398.4 recent prices,NET PROFIT ($MILL) 7.8 11.6 15.1 21.3 33.6 50.2 68.9 92.4 142.0 P/E ratios.INCOME TAX RATE 38.5% 36.0% 36.0% 32.0% 32.1% 30.6% 30.1% 36.3% 33.9%RETURN ON TOTAL ASSETS .81% .79% 1.03% .83% .88% .95% .96% 1.00% 1.27%LONG-TERM DEBT ($MILL) -- 24.2 24.2 -- -- 24.3 2575.3 574.8 724.8SHR. EQUITY ($MILL) 61.9 74.9 88.3 136.8 178.8 342.8 443.0 540.3 712.3SHR. EQ. TO TOTAL ASSETS 6.4% 5.1% 6.0% 5.4% 4.7% 6.5% 6.1% 5.9% 6.4%LOANS TO TOT ASSETS 6.9% 3.8% 3.7% 4.3% 3.4% 4.4% 2.0% 2.2% 1.2%RETURN ON SHR. EQUITY 12.6% 15.5% 17.0% 15.5% 18.8% 14.6% 15.6% 17.1% 19.9%RETAINED TO COM EQ 12.3% 15.4% 16.1% 14.7% 17.8% 13.9% 14.8% 16.4% 19.3%ALL DIV’DS TO NET PROF 2% 1% 6% 5% 5% 5% 5% 4% 3%A No. of analysts changing earn. est. in last 30 days: 1 up, 1 down, consensus 5-year earnings growth 25.0% per year. B Based upon 4 analysts’ estimates. C Based upon 4 analysts’ estimates.ANNUAL RATESof change (per share) 5 Yrs. 1 Yr.Loans 13.0% -33.5%Earnings 39.5% 50.5%Dividends 32.0% 16.5%Book Value 36.5% 29.5%Total Assets 33.5% 19.0%FiscalYearLOANS ($mill.)1Q 2Q 3Q 4Q12/31/02 135.2 125.8 139.0 143.712/31/03 107.2 126.7 166.8 199.512/31/04 152.7 192.2 148.8 134.512/31/05 167.8Fiscal EARNINGS PER SHAREYear 1Q 2Q 3Q 4QFullYear12/31/01 .16 .18 .21 .22 .7712/31/02 .24 .26 .26 .28 1.0412/31/03 .09 .42 .41 .47 1.3912/31/04 .54 .50 .53 .52 2.0912/31/05 .60 .61 .67 .69CalendarQUARTERLY DIVIDENDS PAID1Q 2Q 3Q 4QFullYear2002 .013 .013 .013 .013 .052003 .015 .015 .015 .015 .062004 .018 .018 .018 .018 .072005 .02 .02INSTITUTIONAL DECISIONS2Q’04 3Q’04 4Q’04to Buy 156 133 138to Sell 86 106 121Hld’s(000) 77426 71829 73303ASSETS ($mill.) 2002 2003 12/31/04Loans 143.7 199.5 134.5Funds Sold .0 .0 .0Securities 6711.2 8602.9 10508.2Other Earning .0 .0 .0Other 359.9 420.8 525.1LIABILITIES ($mill.)Deposits 3332.9 4207.1 5396.4Funds Borrowed 491.1 3806.1 4150.2Long-Term Debt 2575.3 574.8 724.8Net Worth 443.0 540.3 712.3Other 372.5 94.9 184.1Total 7214.8 9223.2 11167.8Loan Loss Resrv. .1 .1 .1LONG-TERM DEBT AND EQUITYas of 12/31/04LT Debt $724.8 mill.Including Cap. Leases NoneDue in 5 Yrs. NoneLeases, Uncapitalized Annual rentals $30.3 mill.Pension Liability None in ’04 vs. None in ’03Pfd Stock NoneCommon Stock 66,522,112 sharesPfd Div’d Paid NoneINDUSTRY: Financial Svcs. (Div.)May 13, 2005518600VOL.(thous.)BUSINESS: Investors Financial Services Corp. acts as abank holding company for Investors Bank & Trust Company.It provides a broad range of services to financial assetmanagers, such as mutual fund complexes, investmentadvisors, family offices, banks, <strong>and</strong> insurance companies.The company defines these services as core services <strong>and</strong>value-added services. Its core services include middle officeoutsourcing, global custody, multicurrency accounting <strong>and</strong>fund administration. The value-added services include securitieslending, foreign exchange, cash management, performancemeasurement, institutional transfer agency, investmentadvisory services, lines of credit, <strong>and</strong> brokerage<strong>and</strong> transition management services. At December 31, 2004,the company provided services for approximately $1.4trillion in net assets, including approximately $236 billionof foreign net assets. Has 2778 employees. Chairman &C.E.O.: Kevin J. Sheehan. Inc.: DE. Address: 200 ClarendonStreet, P.O. Box 9130, Boston, MA 02117. Tel.: (617)937-6700. Internet: http://www.investorsbnk.com.E.B.TOTAL SHAREHOLDER RETURNDividends plus appreciation as of 4/30/20053 Mos. 6 Mos. 1 Yr. 3 Yrs. 5 Yrs.-16.64% 9.21% 8.16% 14.73% 104.87%©2005 Value Line Publishing, Inc. All rights reserved. Factual material is obtained from sources believed to be reliable <strong>and</strong> is provided without warranties of any kind.THE PUBLISHER IS NOT RESPONSIBLE FOR ANY ERRORS OR OMISSIONS HEREIN. This publication is strictly for subscriber’s own, non-commercial, internal use. No part To subscribe call 1-800-833-0046.of it may be reproduced, resold, stored or transmitted in any printed, electronic or other form, or used for generating or marketing any printed or electronic publication, service or product.