Teddy Graham Lab.pdf - Mrs Stovel
Teddy Graham Lab.pdf - Mrs Stovel
Teddy Graham Lab.pdf - Mrs Stovel
- No tags were found...
Create successful ePaper yourself
Turn your PDF publications into a flip-book with our unique Google optimized e-Paper software.
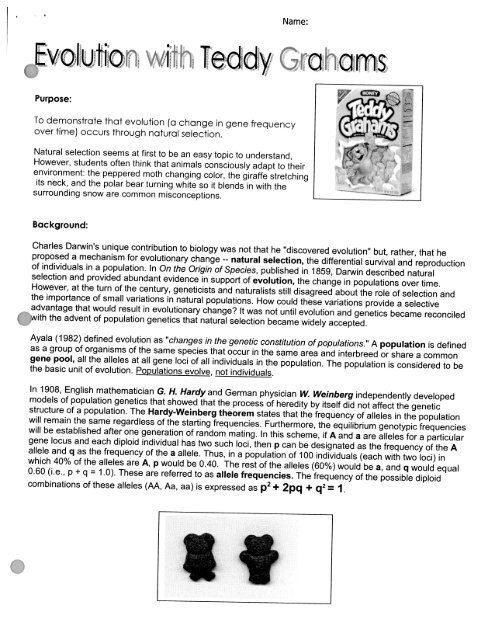
Name:mPurpose:To demonstrate that evolution (a change in gene frequencyover tinne) occurs through natural selection.Natural selection seems at first to be an easy topic to understand,However, students often think that animals consciously adapt to theirenvironment: the peppered moth changing color, the giraffe stretchingits neck, and the polar bear turning white so it blends in with thesurrounding snow are common misconceptions.Background:nr1n'?^°^'^'"'!.""'''"®.^°"*''^"^'°" ^° ^'^'^^^ ^^^ "°^ ^^^^ ^^ "discovered evolution" but, rather that heproposed a mechanism for evolutionary change - natural selection, the differential survival and reproductionsIlPrt'ion'fnH'" ' 'H'."'"K°".'" F" ''' """^'^ ""'^P^''^'' ^^^''^^ed in 1859, Darwin described naSHowptr ^"^,P7'd^d abundant evidence in support of evolution, the change in populations over time.thpTrfn^f r ° /^^ T*"*^' 9^"^t'^'sts 3"d naturalists still disagreed about the role of selection andIXlTn Tht TH^" '^^1^*'°"" '" "^*"''^' P°P"'^t'°"S- How could these variations provide a selectivew^h thlfdi/n nf°nl' T^ '" ^^° "^'^^ "'""^e? It was not until evolution and genetics became reconciledwith the advent of population genetics that natural selection became widely accepted.Ayala (1982) defined evolution as "changes in the genetic constitution of populations." A population is definednL^Z^ uir'nT °V'n ^^"^^.^P^^'«^ ^^atoccur in the same area and interbreed orsha^e a commonZ L T ' J T ^f" 'L'" ^^T '°"' °^"" '•"^'"''^""'^ '" ^^^ population. The population is conside°e7o Sethe basic unit of evolution. Populations evolve not individuals.mnnlif n?n?^^ mathematician G H Hardy and German physician 14^. Weinberg independently developedmodels of population genetics that showed that the process of heredity by itself did not affect the geneticwNI rlm^in thr'"'''°"- ""HI" "^^^^•''"'"berg theorem states that the frequency of alleles in the pop lationwl remain Je same regardless ofthe starting frequencies. Furthermore, the equihbrium genotypic frequencies^ne lo!!f Jn'n'!' fH' ?"H ' T ? 7 . ° ' ^'"'°"^ "^^^'"9. In this scheme, if A and a are aLTes for a par^cu^rifZ LnH „ .h f '^'P'°'^ '"*^;^'^'^^' ^^' *^° '"^^ '°^'- *^^" P ^^" be designated as the frequency of the AwhfhTnt^fth ' fr^^"^"^y °f the a allele. Thus, in a population of 100 individuals (each with two loc) in0 60 n e ;° o - IO'T^TJ; """?'' H'. °'°- J"",' r' °' *'^ ^""'"^ (^°°/°) ^°"'d be a, and q would equalU.60 (I.e., p + q - 1.0). These are referred to as allele frequencies. The frequency ofthe possible diploidcombinations of these alleles (AA, Aa, aa) is expressed as p^ + 2pq + q^ = 1.
The Hardy-Weinberg theorem is valid only if certain conditions are met:1. The population is very large. (The effect of chance on changes in allele frequencies isgreatly reduced; new genes will be a very small fraction ofthe total population size)2. Mating is random. (Individuals show no mating preference for a particular phenotype)ll^llV^ "°,? "" !"5®® i" ^^^ 3®"® P°°' ^"^ *° mutation, that is, mutation from A toa must be equal to mutation from a to A. (also exon shuffling must not come into play)4. There is no migration of individuals into and out of the population (no gene flow)5. There is no selection; all genotypes are equal in reproductive success.^nH «f "y'.^^^ Hardy-Weinberg theorem provides a baseline model in which gene frequencies do not changeand evolution does not occur. By testing the fundamental hypothesis of the Hardy-Weinberg theoremn^?.r^iT^ t '"^ investigated the roles of mutation, migration, population size, nonrandom mating andnatural selec^n in effecting evolutionary change in natural populations. Although some populations maintaingenetic equilibnum, the exceptions are intriguing to scientists. H H i UM5> r.idiniamMaterials:P^er ^uSe^ '''''^ ^^"^ ^^"^^^ <strong>Graham</strong> crackers (approx. 40 per group or 56 grams worth)Graph PaperCalculatorLTif ^w^ff^^'"''^''/!'''? "'°'''^'- ^^^'^ '"'^ ^° '''"''^' °^ ^^^^^- ^°PP^ S^a^^ ^"^ 5ad Bears. You cantell the difference between them by fhe way they hold their hands. Happy Bears hold their handsSrH [fn' °"f '^'^K-fr '°'^ ''^'' '^'^^^ ^^^'^ '°^- ^^PP>^ «^^^^ ^^'^^ ^^^ef ond are easy toNew bears are born every year (during hibernation) and fhe birth rate is one new bear for every oldbear left from tlie last year.'Procedure:1. Read the story above and follow the directions below.put them on the plate). (These numbers have already been recorded for you in Table 1. Happy BearPopulation =7, Sad Bear Population = 3, Total Bear Population = 10).3. Eat three Happy Bears. (In future trials, if you don't have three Happy Bears, then eat whatevernumber of Happy Bears you have).4. Now, randomly (don't choose!!) select one bear cookie from the cookie bag for each bear remainingin the population and place them on the plate with the others. Count and record numbers and types ofnew bears added to the plate population. (The first time around, you will select 7 more bears, making14 the total population in generation 2 ) ' """^'"y5.Repeat steps 3 and 4 for two more generations (for a total of four generations). Record your data inI dul6 1.
Use the data from Table 1 and a punnett square to determine the genotypic frequencies ofthefnlMel ^^^^^ ^^^'^ ^'^ recessive). Rewrite the frequencies calculated in the punnett squareb.d.e.Draw a Punnett square in the space provided, one for each generationUse the genotypes Hh x Hh to fill it in.You know the proportion of your recessive bears (happy is recessive). Put that number in thePunnett square box labeled hh. (For example, 9% would be written as 09)You need to know the frequency of the "h" allele, so take the square rnnfr of the hhpercentage to find "h". (In the example above, that would be 0.3)Both alleles, H and h, must add up to one. If "h" is 0.3, then "H" must be 0 7Now just multiply the numbers to fill in the percentages for each box in the Punnett squareH .70 .30H.70h.30.49HH.21Hh.21Hh.09hhf. In the example, the frequency of the "H" allele is 70%. The frequency of the "h" allele is 30%The percentage of the population of bears that are homozygous dominant is 49%; 42% of thepopulation IS heterozygous, and we already knew that 9% were recessive.7. Construct a line graph for each genotype using the data from Table 2. Use percentages rounded towhole numbers. (Graph generations vs. percentage)8. Graph the frequencies of the three genotypes over the four generations.Use a different color for each ofthe genotypes (HH, Hh, hh).Graph it all on one graph.Frequency(% of thePopulation)Generation
Table 1: Phenotypic Frequencies (round %toldecimal place)Generation1Number ofHappyBears (hh)7»/o hh70Number ofSad «/o HHBears (H_r p&ndHh3 30TotalNumber ofBears1021434Punnett Squares: (mund to 3 decimal places)Generation 1H(0.16)H(0.16, 1 0.03h(0.84,|Genera tion 31h (0.8^0.1340.70Generation 21Generation 41Ta ble 2: Genot^ ^pic Frequencies{round to 2 d€ }clmalplaces)Generation1P^(HH)0.032pq(Hh)0.27(hh)0.70P (H)(1-Q)0.16Q(h)(Vhh)0.84234Forn nulas:p + q = lP^ + 2 •pq( Ci^ = 1
Questions;1. Explain which trait is not favorable, and why.2. Which phenotype is reduced in the population?3. What specifically happens to each genotypic frequency from generation one to generation four?4. What occurs when there is a change over time of the genotypic frequencies?5. Explain what would happen if the selection pressure changed and the recessive allele was selected for(that is, what if sad bears were better to eat?).6. What would happen if it were better to be heterozygous...that is, if the heterozygous genotype weremore fit? Will there be homozygous recessive bears? Explain your answer.7. What happens to the recessive (happy) allele over successive generations?8. Explain why the recessive allele does not completely disappear from the population.


