Group finance director's report continued - MTN Group
Group finance director's report continued - MTN Group
Group finance director's report continued - MTN Group

Create successful ePaper yourself
Turn your PDF publications into a flip-book with our unique Google optimized e-Paper software.
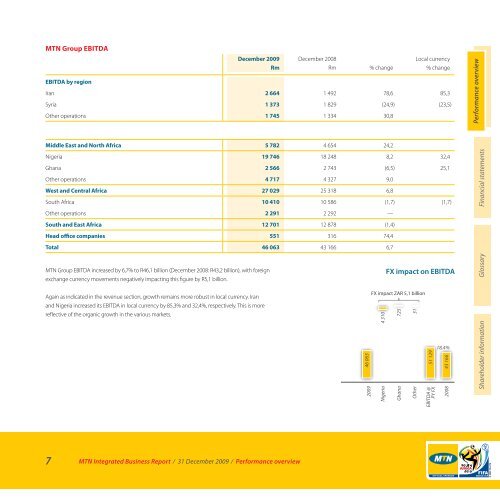
<strong>MTN</strong> <strong>Group</strong> EBITDA<br />
December 2009<br />
Middle East and North Africa 5 782 4 654 24,2<br />
Nigeria 19 746 18 248 8,2 32,4<br />
Ghana 2 566 2 743 (6,5) 25,1<br />
Other operations 4 717 4 327 9,0<br />
West and Central Africa 27 029 25 318 6,8<br />
South Africa 10 410 10 586 (1,7) (1,7)<br />
Other operations 2 291 2 292 —<br />
South and East Africa 12 701 12 878 (1,4)<br />
Head office companies 551 316 74,4<br />
Total 46 063 43 166 6,7<br />
7 <strong>MTN</strong> Integrated Business Report ⁄ 31 December 2009 ⁄ Performance overview<br />
Rm<br />
December 2008<br />
Rm % change<br />
Local currency<br />
% change<br />
EBITDA by region<br />
Iran 2 664 1 492 78,6 85,3<br />
Syria 1 373 1 829 (24,9) (23,5)<br />
Other operations 1 745 1 334 30,8<br />
<strong>MTN</strong> <strong>Group</strong> EBITDA increased by 6,7% to R46,1 billion (December 2008: R43,2 billion), with foreign<br />
exchange currency movements negatively impacting this figure by R5,1 billion.<br />
Again as indicated in the revenue section, growth remains more robust in local currency. Iran<br />
and Nigeria increased its EBITDA in local currency by 85,3% and 32,4%, respectively. This is more<br />
reflective of the organic growth in the various markets.<br />
46 063<br />
2009<br />
4 310<br />
Nigeria<br />
FX impact on EBITDA<br />
FX impact ZAR 5,1 billion<br />
725<br />
Ghana<br />
31<br />
Other<br />
51 129<br />
EBITDA @<br />
PY FX<br />
18,4%<br />
43 166<br />
2008<br />
Performance overview<br />
Glossary Financial statements<br />
Shareholder information