Group finance director's report continued - MTN Group
Group finance director's report continued - MTN Group
Group finance director's report continued - MTN Group

Create successful ePaper yourself
Turn your PDF publications into a flip-book with our unique Google optimized e-Paper software.
<strong>Group</strong> <strong>finance</strong> director’s <strong>report</strong><br />
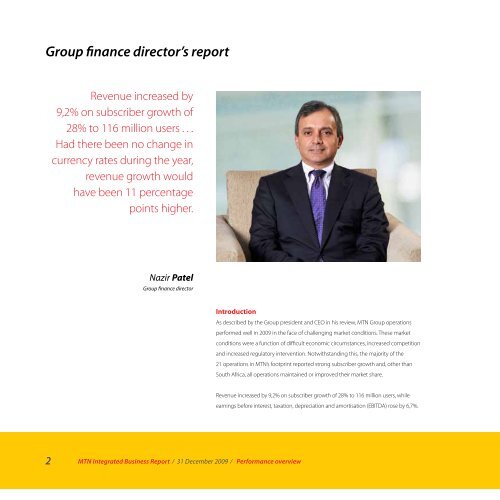
Revenue increased by<br />
9,2% on subscriber growth of<br />
28% to 116 million users . . .<br />
Had there been no change in<br />
currency rates during the year,<br />
revenue growth would<br />
have been 11 percentage<br />
points higher.<br />
Nazir Patel<br />
<strong>Group</strong> <strong>finance</strong> director<br />
Introduction<br />
2 <strong>MTN</strong> Integrated Business Report ⁄ 31 December 2009 ⁄ Performance overview<br />
As described by the <strong>Group</strong> president and CEO in his review, <strong>MTN</strong> <strong>Group</strong> operations<br />
performed well in 2009 in the face of challenging market conditions. These market<br />
conditions were a function of difficult economic circumstances, increased competition<br />
and increased regulatory intervention. Notwithstanding this, the majority of the<br />
21 operations in <strong>MTN</strong>’s footprint <strong>report</strong>ed strong subscriber growth and, other than<br />
South Africa, all operations maintained or improved their market share.<br />
Revenue increased by 9,2% on subscriber growth of 28% to 116 million users, while<br />
earnings before interest, taxation, depreciation and amortisation (EBITDA) rose by 6,7%.
This resulted in an erosion of the EBITDA margin. The muted growth in revenue and EBITDA<br />
relative to the strong increase in subscribers clearly reflects the dampening effect of movements<br />
in exchange rates in the full year, compounded by the strength of the South African rand<br />
(rand) against the US dollar (USD), in the second half of the year. Reported financial results were<br />
negatively impacted as almost 70% of <strong>MTN</strong> <strong>Group</strong> earnings were generated outside South Africa<br />
but translated to rand for <strong>report</strong>ing purposes. The EBITDA margin reduced by 1 percentage<br />
point to end the year at 41,1%. This was mainly a result of the weaker performance in the<br />
South African operation and an increase in the revenue share to the authorities in Syria.<br />
Finally, the <strong>Group</strong>’s extensive capital expenditure (capex) roll out programme, initiated in 2008,<br />
was sustained throughout the year supporting the strong subscriber growth. R31,2 billion was<br />
spent in 2009 which is expected to be the peak amount for the <strong>Group</strong>.<br />
Changes in ownership<br />
<strong>MTN</strong> <strong>Group</strong> concluded a number of transactions that impacted the financial statements:<br />
• In January 2009, <strong>MTN</strong> increased its shareholding in iTalk Cellular (Proprietary) Limited<br />
from 41% (equity accounted) to 100% (consolidated) at a cost of R355 million.<br />
• In January 2009, <strong>MTN</strong> Zambia issued a 2,2% shareholding to a minority shareholder as part<br />
of a private placement arrangement, diluting <strong>MTN</strong>’s shareholding from 100% to 97,8%.<br />
• In January 2009, <strong>MTN</strong> disposed of its 50% joint venture investment in Digital Mobile TV<br />
Africa (Proprietary) Limited (DMTV) for a consideration of R58 million.<br />
• In February 2009, <strong>MTN</strong> acquired 100% of Verizon South Africa (Proprietary) Limited at a<br />
cost of R1,8 billion.<br />
• In October 2009, <strong>MTN</strong> increased its shareholding in <strong>MTN</strong> Uganda from 95% to 96% at a cost<br />
of USD6,5 million.<br />
• In November 2009, <strong>MTN</strong> acquired a 20% investment in Belgacom International Carrier<br />
Services SA (BICS). The purchase consideration was in exchange for <strong>MTN</strong> International<br />
Carrier Services and Uniglobe assets and a contract for 70% of the international traffic from<br />
selected operations over a period of five years to 2014.<br />
3 <strong>MTN</strong> Integrated Business Report ⁄ 31 December 2009 ⁄ Performance overview<br />
Performance overview<br />
Glossary Financial statements<br />
Shareholder information
<strong>Group</strong> <strong>finance</strong> director’s <strong>report</strong> <strong>continued</strong><br />
Foreign exchange<br />
Currency volatility had a substantial bearing on numerous items in the <strong>Group</strong>’s income<br />
statement and balance sheet. Had there been no change in currency rates during the year, 9 169<br />
9 086<br />
9 243 9 300 9 175 9 365<br />
9 830 9 943<br />
revenue growth at year-end would have been 11 percentage points higher, and EBITDA<br />
129 128 128<br />
126<br />
117<br />
118<br />
147 148<br />
growth would have been 12 percentage points above that <strong>report</strong>ed. A more detailed analysis<br />
6,3 7,0 9 169<br />
of the foreign exchange rate (FX) impact on revenue and EBITDA is detailed 9 086 below under the<br />
7,1 9 243 7,0<br />
9 300<br />
7,6<br />
9 175<br />
8,1<br />
9 365<br />
9 830<br />
9,1<br />
9 943<br />
8,3<br />
0,9 0,9<br />
respective headings. Functional currency losses of R3,2 billion were recorded, 129 compared 128 with<br />
0,9<br />
128<br />
0,9<br />
126<br />
1,0<br />
117<br />
1,1<br />
118<br />
1,4 147 148<br />
1,4<br />
gains in the previous year of R2,4 billion. This reduced adjusted headline EPS H1-06 by 124,6 H2-06 cents from H1-07 a<br />
6,3 7,0 7,1<br />
H2-07<br />
7,0<br />
H1-08<br />
7,6<br />
H2-08<br />
8,1<br />
H1-09<br />
9,1<br />
H2-09<br />
8,3<br />
gain of 94,2 cents the previous year. Adjusted headline EPS, excluding the impact 0,9 of the functional<br />
0,9 0,9<br />
currency losses, increased by 8,5% to 878,9 cents for the year.<br />
0,9 1,0 1,1 1,4 1,4<br />
H1-06 H2-06 H1-07 H2-07 H1-08 H2-08 H1-09 H2-09<br />
1 450 1 365<br />
The strong rand, however, had a positive impact on capex, reducing the effective 20,3 spend of the<br />
<strong>Group</strong> by R3,5 billion.<br />
20,3<br />
It is appropriate to consider the performance in the first half of the year against the second 18,7 half 17,9<br />
largely in light of the movements of foreign currencies both in South Africa, H1-06 as well as H2-06 our key H1-07<br />
17,9<br />
H2-07<br />
15,4<br />
H1-08<br />
14,5<br />
H2-08<br />
16,1<br />
H1-09<br />
17,8<br />
H2-09<br />
markets such as Nigeria and Ghana. In H1, revenue was up 24% and EBITDA was 24,8% higher.<br />
0,14 0,13<br />
In H2, revenue was down 3% and the EBITDA margin declined by 8,8%. Both of these are directly<br />
0,13 0,13 0,13 0,13 0,15 0,17<br />
H1-06 H2-06<br />
related to the weakening of the Nigerian naira (NGN) on a cross‐rate basis against the rand of<br />
approximately 30% and the Ghanaian cedi of approximately 22%.<br />
H1-07 H2-07 H1-08 H2-08 H1-09 H2-09<br />
Income statement analysis (the complete income statement appears on page 46).<br />
4 <strong>MTN</strong> Integrated Business Report ⁄ 31 December 2009 ⁄ Performance overview<br />
1 292<br />
1 320<br />
1 198<br />
1 152<br />
1 091<br />
1 195<br />
18,7 17,9 17,9<br />
15,4 14,5<br />
16,1<br />
17,8<br />
1 450<br />
0,14<br />
1 365<br />
0,13<br />
1 292<br />
0,13<br />
1 320<br />
0,13<br />
1 198<br />
0,13 1 0,13 152<br />
1 091<br />
0,15<br />
1 195<br />
0,17<br />
USD: Local currency<br />
Rial<br />
Naira<br />
ZAR<br />
Cedis<br />
Rial<br />
Naira<br />
ZAR<br />
Cedis<br />
ZAR: Local currency<br />
Rial<br />
Naira<br />
Cedis<br />
Rial<br />
Naira<br />
Cedis
<strong>MTN</strong> <strong>Group</strong> revenue<br />
December 2009<br />
5 <strong>MTN</strong> Integrated Business Report ⁄ 31 December 2009 ⁄ Performance overview<br />
Rm<br />
December 2008<br />
Rm % change<br />
Local currency<br />
% change<br />
Revenue by region<br />
Iran 7 625 4 935 54,5 60,0<br />
Syria 6 987 6 508 7,4 8,2<br />
Other operations 6 913 5 771 19,8<br />
Middle East and North Africa 21 525 17 215 25,0<br />
Nigeria 33 326 31 558 5,6 30,0<br />
Ghana 5 667 6 047 (6,3) 25,1<br />
Other operations 11 550 10 078 14,6<br />
West and Central Africa 50 543 47 682 6,0<br />
South Africa 33 149 32 148 3,1 3,1<br />
Other operations 6 520 5 335 22,2<br />
South and East Africa 39 669 37 483 5,8<br />
Head office companies 210 146 43,8<br />
Total 111 947 102 526 9,2<br />
<strong>MTN</strong> <strong>Group</strong> revenue increased by 9,2% to R111,9 billion (2008: R102,5 billion), driven largely by<br />
the strong growth in the subscriber base. When prior year FX rates are used, 2009 revenue was<br />
negatively impacted by R10,9 billion due to foreign exchange currency movements.<br />
When local currency growth in the various markets is analysed, it is evident that growth<br />
remained robust, indicating a sound operational performance despite the weak rand <strong>report</strong>ed<br />
numbers. <strong>MTN</strong>’s major markets, with the exception of South Africa and Syria, enjoyed growth<br />
above 20% with Iran showing an increase of 60%. Due to the very high level of competition, it<br />
was especially pleasing that Ugandan growth was still strong at 26,4%.<br />
The slower growth in revenue in Syria was due to subscriber acquisitions lagging in the first half<br />
of the year resulting in limited revenue contribution from the substantial increase in subscribers<br />
in the second half of the year.<br />
111 947<br />
2009<br />
7 548<br />
Nigeria<br />
FX impact on revenue<br />
FX impact ZAR 10,9 billion<br />
1 738<br />
Ghana<br />
1 653<br />
Other<br />
122 886<br />
Rev @ PY FX<br />
19,9%<br />
102 526<br />
2008<br />
Performance overview<br />
Glossary Financial statements<br />
Shareholder information
<strong>Group</strong> <strong>finance</strong> director’s <strong>report</strong> <strong>continued</strong><br />
Revenue analysis<br />
6 <strong>MTN</strong> Integrated Business Report ⁄ 31 December 2009 ⁄ Performance overview<br />
December<br />
2009<br />
December<br />
2008 % change<br />
Airtime and subscription 76 814<br />
70 963<br />
8,2<br />
68,6%<br />
69,2%<br />
Data 3 329<br />
2 690<br />
23,8<br />
3,0%<br />
2,6%<br />
SMS 5 437<br />
4 394<br />
23,7<br />
4,9%<br />
4,3%<br />
Interconnect 19 516<br />
18 364<br />
6,3<br />
17,4%<br />
17,9%<br />
Cellular phones and accessories 3 279<br />
3 551<br />
(7,7)<br />
2,9%<br />
3,5%<br />
Other 3 572<br />
2 564<br />
39,3<br />
3,2%<br />
2,5%<br />
Revenue 111 947 102 526 9,2<br />
South Africa’s contribution to airtime and subscription revenues remained flat year‐on‐year, despite<br />
the 1,1 million reduction in subscribers over the period indicating that the disconnected subscribers<br />
were not significant revenue generating customers. Airtime revenue was the major contributor to<br />
revenue in the remaining operations which increased in line with overall organic revenue growth.<br />
Data and SMS revenue showed a strong increase due to solid mobile data growth in South Africa<br />
and to a lesser extent Nigeria and Iran. During the year, investments made in 3G infrastructure, fibre<br />
capability and data solutions, which together with improved products (including those in support of<br />
our sponsorship of the FIFA World Cup), allowed us to grow this particular revenue stream as part of<br />
our data strategy.<br />
The contribution of interconnect to total revenue dropped as a result of a 6% fall in Nigerian<br />
interconnect revenue, where nearly 80% of all traffic is now on-net. In South Africa, however,<br />
interconnect revenue growth was ahead of airtime revenue growth.<br />
Revenue generated on cellular phones and accessories dropped due to a considerable reduction in<br />
the selling prices, not withstanding an increase in handset volumes from approximately 4,1 million to<br />
5,1 million units. Handsets are mainly purchased for distribution in South Africa.<br />
Other revenues of R3,6 billion were generated which mostly related to the acquisition of<br />
Verizon SA in February 2009.
<strong>MTN</strong> <strong>Group</strong> EBITDA<br />
December 2009<br />
Middle East and North Africa 5 782 4 654 24,2<br />
Nigeria 19 746 18 248 8,2 32,4<br />
Ghana 2 566 2 743 (6,5) 25,1<br />
Other operations 4 717 4 327 9,0<br />
West and Central Africa 27 029 25 318 6,8<br />
South Africa 10 410 10 586 (1,7) (1,7)<br />
Other operations 2 291 2 292 —<br />
South and East Africa 12 701 12 878 (1,4)<br />
Head office companies 551 316 74,4<br />
Total 46 063 43 166 6,7<br />
7 <strong>MTN</strong> Integrated Business Report ⁄ 31 December 2009 ⁄ Performance overview<br />
Rm<br />
December 2008<br />
Rm % change<br />
Local currency<br />
% change<br />
EBITDA by region<br />
Iran 2 664 1 492 78,6 85,3<br />
Syria 1 373 1 829 (24,9) (23,5)<br />
Other operations 1 745 1 334 30,8<br />
<strong>MTN</strong> <strong>Group</strong> EBITDA increased by 6,7% to R46,1 billion (December 2008: R43,2 billion), with foreign<br />
exchange currency movements negatively impacting this figure by R5,1 billion.<br />
Again as indicated in the revenue section, growth remains more robust in local currency. Iran<br />
and Nigeria increased its EBITDA in local currency by 85,3% and 32,4%, respectively. This is more<br />
reflective of the organic growth in the various markets.<br />
46 063<br />
2009<br />
4 310<br />
Nigeria<br />
FX impact on EBITDA<br />
FX impact ZAR 5,1 billion<br />
725<br />
Ghana<br />
31<br />
Other<br />
51 129<br />
EBITDA @<br />
PY FX<br />
18,4%<br />
43 166<br />
2008<br />
Performance overview<br />
Glossary Financial statements<br />
Shareholder information
<strong>Group</strong> <strong>finance</strong> director’s <strong>report</strong> <strong>continued</strong><br />
The <strong>Group</strong>’s EBITDA margin dropped by one percentage point to 41,1%. The drop in the EBITDA<br />
margin was mainly attributable to the weaker performance of the South African operation<br />
and the increased share of revenue paid to the authorities in Syria, in line with the conditions<br />
of the BOT contract in that country. The Nigerian operation <strong>continued</strong> to contribute positively<br />
to the <strong>Group</strong>’s EBITDA margin. The Nigerian EBITDA margin improved 1,4 percentage points to<br />
59,3% mainly due to an increase in revenue together with a containment of operating expenses,<br />
in particular an 18% decline in the price of fuel. This was marginally weaker than the 61% EBITDA<br />
margin <strong>report</strong>ed in H1 of 2009, due to exceptional charges taken on impairment provisions,<br />
FIFA‐related promotional activity and an increase in the cost of site leasing for the increased<br />
number of BTS’s rolled out during the year.<br />
Iran raised its EBITDA margin by 4,7 percentage points to 34,9% due to an increase in economies<br />
of scale benefits, cost optimisation from single vendor maintenance and locally manufactured<br />
vouchers.<br />
South Africa’s EBITDA margin declined 1,5 percentage points to 31,4% due to reduced fixed to<br />
mobile interconnect traffic; reduced number of subscribers, especially in the postpaid segment;<br />
migration to lower-value packages; an increase in handset sales as margins reduced and higher<br />
distribution costs following the integration of iTalk and Cell Place.<br />
EBITDA restated at constant prior year FX rates would have been approximately 12 percentage<br />
points higher than the 6,7% growth <strong>report</strong>ed.<br />
8 <strong>MTN</strong> Integrated Business Report ⁄ 31 December 2009 ⁄ Performance overview<br />
EBITDA reconciliation<br />
EBITDA margin 2008 42,1<br />
Nigeria 0,7<br />
Syria (0,6)<br />
South Africa (0,5)<br />
Other operations (0,6)<br />
EBITDA margin 2009 41,1
EBITDA analysis<br />
9 <strong>MTN</strong> Integrated Business Report ⁄ 31 December 2009 ⁄ Performance overview<br />
December<br />
2009<br />
December<br />
2008 % change<br />
Revenue 111 947 102 526 9,2<br />
Direct network operating costs<br />
Cost of handsets and other accessories<br />
Interconnect and roaming<br />
Employee benefits<br />
Selling, distribution and marketing expenses<br />
Other expenses<br />
EBITDA<br />
EBITDA margin %<br />
Direct network operating costs due to network roll out together with the Syrian revenue share<br />
charge had a substantial impact on total costs. Interconnect and roaming costs increased<br />
in South Africa mainly due to higher prices charged by the fixed line operator on outgoing<br />
international traffic to neighbouring operations. Following the integration of Verizon, iTalk and<br />
Cell Place in the South African operation, employee‐related and distribution costs also increased.<br />
Moving forward, we would expect to reduce these costs through the headcount restructuring<br />
exercise announced late last year. The closure of poorly positioned or under-performing<br />
distribution points will also assist in reducing costs. Included in other expenses is the positive<br />
impact of a claim settlement by a smaller competitor of R354 million.<br />
15 925 14 140 12,6<br />
14,2% 13,8%<br />
6 297 5 985 5,2<br />
5,6% 5,8%<br />
15 166 13 217 14,7<br />
13,5% 12,9%<br />
5 843 4 776 22,3<br />
5,2% 4,7%<br />
14 649 13 274 10,4<br />
13,1% 12,9%<br />
8 004 7 968 0,5<br />
7,1% 7,8%<br />
46 063<br />
43 166<br />
41,1%<br />
42,1%<br />
6,7<br />
Performance overview<br />
Glossary Financial statements<br />
Shareholder information
<strong>Group</strong> <strong>finance</strong> director’s <strong>report</strong> <strong>continued</strong><br />
Depreciation and amortisation<br />
<strong>MTN</strong> <strong>Group</strong>’s depreciation charge increased by 18,8% or R1,9 billion to R11,8 billion as a result of<br />
a <strong>continued</strong> investment in network infrastructure by the <strong>Group</strong>’s operations, particularly in the<br />
past two years. Nigeria, Iran and South Africa were the main contributors to depreciation in their<br />
respective regions, indicative of the heavy infrastructure roll out in these countries. The <strong>Group</strong>’s<br />
amortisation charge decreased by R0,2 billion to R2,7 billion. This is largely due to the unwinding<br />
of the intangible assets recognised on the Investcom acquisition in 2006.<br />
Net <strong>finance</strong> costs<br />
Net <strong>finance</strong> costs increased by 203% or R3,9 billion to R5,8 billion. The strengthening of the<br />
rand relative to the dollar, which resulted in the recognition of a functional currency loss<br />
of R3,2 billion (December 2008: R2,4 billion functional currency gain) is the main driver for<br />
this movement. Much of the loss was attributable to foreign currency denominated loans,<br />
receivables and cash balances in Mauritius (a functional currency rand entity). A net gain of<br />
R0,7 billion for the Nigerian put option was recognised in the 2009 year, compared to a net<br />
charge of R1,3 billion in 2008 mainly as a result of the weakening of the NGN on a cross-rate<br />
basis against the rand. Net interest paid increased due to a 4% increase in the interest rates in<br />
Nigeria lending combined with further draw-down on the Nigerian local facilities.<br />
Taxation<br />
The <strong>Group</strong>’s taxation charge decreased by 24,2% or R2,7 billion to R8,6 billion, resulting in a<br />
decline in the effective tax rate from 39,9% in 2008 to 33,4% in 2009. The expiration, in March<br />
2008, of the one-year commencement period in Nigeria and the positive effect of the Nigerian<br />
put option on profit before tax strongly impacted the decline in the effective tax rate. The oneyear<br />
commencement period began in March 2007, marking the beginning of the reversal of<br />
the deferred tax asset that had been created during the five-year tax holiday granted in Nigeria.<br />
Non-controlling interests<br />
Non-controlling interests increased to R2,5 billion from R1,8 billion in the prior <strong>report</strong>ed period.<br />
The higher profit after tax in Nigeria and the increase in the non-controlling share in that<br />
particular operation were largely responsible for this increase.<br />
10 <strong>MTN</strong> Integrated Business Report ⁄ 31 December 2009 ⁄ Performance overview<br />
39,5%<br />
2007<br />
E�ective tax rate<br />
39,9%<br />
33,4%<br />
2008 2009
Headline earnings per share<br />
Adjusted headline earnings per share (HEPS) decreased by 16,6% to 754,3 cents compared with<br />
904,4 cents in 2008. The core contributor to this decrease was the functional currency loss of<br />
R3,2 billion in 2009, compared to a functional currency gain of R2,4 billion in 2008. Adjusted HEPS,<br />
excluding the functional currency impact, increased by 8,5% to 878,9 cents compared to 2008.<br />
IFRS requires the <strong>Group</strong> to account for a written put option held by a non-controlling<br />
shareholder of one of the <strong>Group</strong> subsidiaries, which provides the non-controlling shareholder<br />
with the right to require the subsidiary to acquire its shareholdings at fair value. Prior to the<br />
implementation of IFRS the shareholding was treated as a non-controlling shareholder in the<br />
subsidiary as all risks and rewards associated with these shares, including dividends, accrue to<br />
the non-controlling shareholder.<br />
IAS 32 requires that in the circumstances described in the previous paragraph:<br />
(a) the present value of the future redemption amount be reclassified from equity to financial<br />
liabilities and the financial liability so reclassified subsequently be measured in accordance<br />
with IAS 39;<br />
(b) in accordance with IAS 39, all subsequent changes in the fair value of the liability together<br />
with the related interest charges arising from present valuing the future liability be<br />
recognised in the income statement;<br />
(c) the non-controlling shareholder holding the put option no longer be regarded as a noncontrolling<br />
shareholder but rather as a creditor from the date of receiving the put option.<br />
Although the <strong>Group</strong> has complied with the requirements of IAS 32 and IAS 39 as outlined<br />
above, the board of directors has reservations about the appropriateness of this treatment in<br />
view of the fact that:<br />
(a) the recording of a liability for the present value of the future strike price of the written put<br />
option results in the recording of a liability that is inconsistent with the framework, as there<br />
is no present obligation for the future strike price;<br />
(b) the shares considered to be subject to the contracts are issued and fully paid up, have the<br />
same rights as any other issued and fully paid up shares and should be treated as such;<br />
(c) the written put option meets the definition of a derivative and should therefore be<br />
accounted for as a derivative in which case the liability and the related fair value<br />
adjustments recorded through the income statement would not be required.<br />
11 <strong>MTN</strong> Integrated Business Report ⁄ 31 December 2009 ⁄ Performance overview<br />
Performance overview<br />
Glossary Financial statements<br />
Shareholder information
<strong>Group</strong> <strong>finance</strong> director’s <strong>report</strong> <strong>continued</strong><br />
The full balance sheet and cash flow statement appear on pages 48 and 50, respectively.<br />
Balance sheet and cash flow statement<br />
Capex<br />
<strong>MTN</strong>’s extensive network expansion and investment strategy resulted in capex for the year of<br />
R31,2 billion, a 10,6% increase on 2008. This was lower than the R42 billion approved capex<br />
budget for the year due to a R7,2 billion expenditure rollover into 2010 and a R3,5 billion saving<br />
due to rand strength. We expect 2009 to have been our peak year for capital expenditure. The<br />
approved budget for 2010 is R23,6 billion (including rollover capex), 44% lower than the 2009<br />
budgeted amount.<br />
Assets and liabilities<br />
Assets and liabilities were also impacted by foreign currency translation adjustments. Property,<br />
plant and equipment was adversely affected by foreign currency translation adjustments<br />
approximately R13 billion. Goodwill and other intangible assets decreased by 21% or R9,7 billion<br />
to R36,1 billion, mainly due to foreign currency translation adjustments and the unwinding of<br />
the intangible assets recognised on the Investcom acquisition in 2006.<br />
Other non-current liabilities include a deferred gain of R1,3 billion recognised on the sale or<br />
swap of the specific <strong>MTN</strong> International Carrier Services, Uniglobe and <strong>MTN</strong> Dubai assets to BICS.<br />
This will be released over a five-year period until 2014.<br />
Net debt<br />
The net debt to EBITDA of 0,26 times has allowed the board to relax the dividend policy of the<br />
Company, and a dividend of 192 cents has accordingly been paid. <strong>MTN</strong> has <strong>continued</strong> financing<br />
its underlying subsidiary companies on a non-recourse basis. During the year, approximately<br />
USD462 million was raised in the various operations, including Côte d’Ivoire, Uganda, Rwanda,<br />
Benin, Liberia and Afghanistan. Most of this, other than Afghanistan, had been drawndown<br />
at year end. <strong>MTN</strong>’s South African holding company raised a R6 billion term loan facility in<br />
December 2009 as part of refinancing maturing debt and creating headroom facilities.<br />
The repayment profile shows significant debt repayments in 2010. These are made up of a R5 billion<br />
repayment on the <strong>MTN</strong>01 bond, approximately R6 billion due in Nigeria in October 2010 as well as<br />
approximately R3 billion on the <strong>continued</strong> amortisation of <strong>MTN</strong>’s jumbo syndication facility. <strong>MTN</strong> is<br />
well advanced in refinancing these liabilities which will result in an improved profile not only for the<br />
2010 debt but also the significant debt due in 2012, principally for <strong>MTN</strong> Nigeria.<br />
12 <strong>MTN</strong> Integrated Business Report ⁄ 31 December 2009 ⁄ Performance overview<br />
19,0%<br />
9 778<br />
2006<br />
Actual spend<br />
21,0%<br />
15 348<br />
2007<br />
Capex spend<br />
27,6%<br />
28 263<br />
27,9%<br />
31 248<br />
2008 2009<br />
Capex as % of revenue<br />
Capex spend to budget in 2009<br />
Budget 42 031<br />
Underspend ZAR 7,2 billion<br />
(3 560)<br />
FX<br />
(3 382)<br />
Nigeria<br />
(1 607)<br />
Ghana<br />
(154)<br />
Iran<br />
(2 080)<br />
Other<br />
31 248<br />
Actual
<strong>MTN</strong> eliminated the last R600 million of unproductive interest from the Investcom transaction<br />
shortly after year-end. Intercompany loans (excluding holding companies and South Africa)<br />
totalling R7,6 billion were mainly to Iran, Sudan and Afghanistan.<br />
Cash generated from operating activities increased to R36,3 billion from R34,2 billion, reflecting<br />
a strong operational performance. Cash outflows from investing activities increased by R6,0 billion<br />
to R33,2 billion. Investing activities include the cash spent on the acquisitions of Verizon SA, iTalk and<br />
Cell Place in the current period.<br />
Looking forward<br />
Capex of R23,6 billion has been approved for 2010, although approximately R20 billion is<br />
actually expected to be spent in the year ahead. The capex budget is based on the current<br />
average exchange rate assumption of R8,07 to the USD.<br />
Capital expenditure<br />
South Africa 4 245<br />
Nigeria 6 424<br />
Ghana 1 551<br />
Iran 2 666<br />
Syria 456<br />
Other operations 8 257<br />
Total 23 599<br />
Net addition subscriber guidance for 2010:<br />
South Africa 800<br />
Nigeria 6 000<br />
Ghana 800<br />
Iran 5 000<br />
Syria 400<br />
Other operations 7 000<br />
Total 20 000<br />
Nazir Patel<br />
<strong>Group</strong> <strong>finance</strong> director<br />
10 March 2010<br />
13 <strong>MTN</strong> Integrated Business Report ⁄ 31 December 2009 ⁄ Performance overview<br />
15 851<br />
Debt repayment pro�le<br />
4 847<br />
11 928<br />
1 340<br />
1 761<br />
2010 2011 2012 2013 2014<br />
and<br />
beyond<br />
Performance overview<br />
Glossary Financial statements<br />
Shareholder information