

S t a t e S u m m a r y - K e y V a r i a b l e s - DISE
S t a t e S u m m a r y - K e y V a r i a b l e s - DISE
S t a t e S u m m a r y - K e y V a r i a b l e s - DISE

You also want an ePaper? Increase the reach of your titles
YUMPU automatically turns print PDFs into web optimized ePapers that Google loves.
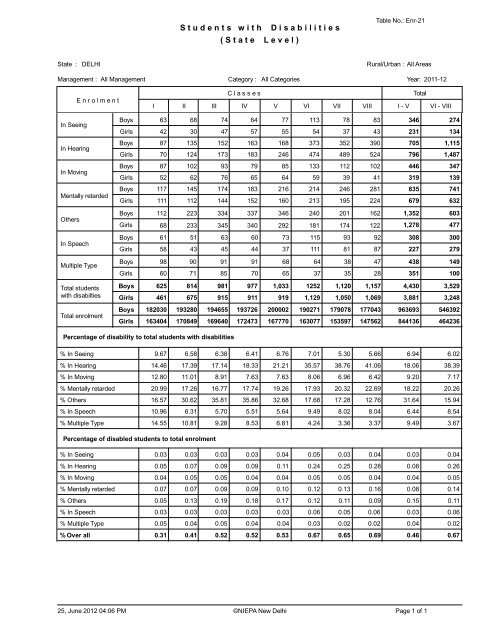
S t u d e n t s w i t h( S t a t e L e v e l )D i s a b i l i t i e sTable No.: Enr-21State : DELHI Rural/Urban : All AreasManagement :All Management Category : All CategoriesYear: 2011-12E n r o l m e n tC l a s s e sTotalI II III IV V VI VII VIII I - V VI - VIIIIn SeeingBoysGirls634268307447645777551135478378343346231274134In HearingBoys 87 135 152 163 168 373Girls 70 124 173 183 246 4743524893905247057961,1151,487In MovingBoys 87 102 93 79 85 133Girls 52 62 76 65 64 591123910241446319347139Mentally retardedBoys 117 145 174 183 216 214Girls 111 112 144 152 160 213246195281 835224 679741632OthersBoysGirls112 223 334 337 346 24068 233 345 340 292 1812011741621221,3521,278603477In SpeechBoysGirls61 51 63 60 73 115 93 9258 43 45 44 37 111 81 87308227300279Multiple TypeBoysGirls989060 719185917068 64653738354728438351149100Total studentswith disabiltiesTotal enrolmentBoys 625Girls 461Boys 182030Girls 163404814 981 977 1,033 1252 1,120 1,157 4,430 3,529675 915 911 919 1,129 1,050 1,069 3,881 3,248193280170849194655169640193726172473200002167770190271163077 153597179078 177043147562 844136963693 546392464236Percentage of disability to total students with disabilities% In Seeing 9.67 6.58 6.38 6.41 6.76 7.01 5.30 5.66% In Hearing% In Moving% Mentally retarded% Others% In Speech% Multiple Type14.4612.8020.9916.5710.9617.3917.2617.1411.01 8.9130.626.3114.55 10.8118.337.6316.77 17.7421.217.6319.2635.5717.9338.768.06 6.9620.3241.066.4222.6935.81 35.86 32.68 17.68 17.28 12.765.709.285.518.535.646.819.494.248.023.368.043.376.9418.069.206.0238.397.1718.22 20.2631.64 15.946.44 8.549.49 3.67Percentage of disabled students to total enrolment% In Seeing0.03 0.03 0.03 0.03 0.04 0.05 0.03 0.04 0.03 0.04% In Hearing0.05 0.07 0.09 0.09 0.11 0.24 0.25 0.28 0.08 0.26% In Moving0.04 0.05 0.05 0.04 0.04 0.05 0.05 0.04 0.04 0.05% Mentally retarded0.07 0.07 0.09 0.09 0.10 0.12 0.13 0.16 0.08 0.14% Others0.05 0.13 0.19 0.18 0.17 0.12 0.11 0.09 0.15 0.11% In Speech0.03 0.03 0.03 0.03 0.03 0.06 0.05 0.06 0.03 0.06% Multiple Type0.05 0.04 0.05 0.04 0.04 0.03 0.02 0.02 0.04 0.02% Over all 0.31 0.41 0.52 0.52 0.53 0.67 0.65 0.69 0.46 0.6725, June 2012 04:06 PM ©NIEPA New DelhiPage 1 of 1


